


















Knowledge graphs are graph-based databases that represent data as interconnected nodes and relationships, enabling complex traversals and pattern matching that are significantly faster than traditional SQL databases. They transform raw data into intelligent systems by combining graph structures with machine learning, allowing organizations to build comprehensive customer 360 views, detect anomalies, and create proactive business intelligence. The key advantage lies in their ability to handle complex, multi-hop queries efficiently while maintaining linear performance, making them ideal for applications like recommendation engines, fraud detection, and enterprise search. Organizations can implement knowledge graphs by first building data graphs from existing systems, then applying machine learning models to extract insights, and finally writing predictions back as relationships or properties to create an intelligent, self-updating knowledge base.
Knowledge Graphs in the Enterprise | EY AI & Graph Technology
Added:Welcome everyone. My name is Michael Moore. I'm the executive director of EY's knowledge graph practice. Um I operate across all sectors and I'm joined here this afternoon uh by Omar Azar who is from our financial services organization. um who is one of the um principal scientists in our um advanced analytics and machine learning um center of excellence um right here uh downtown um in five times square.
So today we want to talk a little bit about uh knowledge graphs. We're going to share some perspectives that are based on our engagements and um and we're going to give you a little bit of a how-to and maybe a little bit of a road map for thinking about how you can incorporate uh graphs into your infrastructure, how you can take those data graphs and turn them into knowledge graphs um and how you can leverage them in the long term.
So our agenda today is I want to give you a brief overview of Ernston Young.
Um uh we're going to talk um uh a little bit about why we are so excited about graphs and graph technology. Um we're also going to uh spend a uh a little bit of time on how knowledge graphs are being used across a variety of um of uh use cases within financial services. We know that there's a lot of folks uh from the industry here today. So, we picked uh financial services, but keep it keep in the back of your mind that a lot of the use cases we're going to touch on are actually broadly applicable. And then finally, we're going to give you some tips and tricks on how to get started, how you can run some conversations with your own IT organization and um and get moving on deploying graphs.
So, we are very pleased to be able to sponsor Graph Connect. Um I've been working in graphs for four years. I think this is the most exciting transformative technology that's come around since the advent of SQL. Um I firmly believe that within 10 years probably 50% of the SQL workloads will be all running on graphs. Um at Ernston Young, we're a services organization. Um we uh work closely um with emerging technologies. Um we have the ability to you know help organizations around the world um uh be successful with those technologies and solving real business uh problems. And um uh we offer a number of different services just like any other consulting firm. But I think what we like to differentiate ourselves on is that um we work on really hard problems. We tend to have small teams working on hard problems um and trying to drive high value outcomes.
our our data and analytics practice globally um is deployed in over 150 countries. We have um well over I don't know what is that number 6,000 or so um analysts um and developers working across a whole number of capabilities from strategy to analytics to transformation implementations and then just running business operations as managed services. Um we do things um all the way from you know designing data warehouses to moving data to building BI and visualizations to doing things like robotic process automation where we can you know um apply machine learning to documents to make sure that they're being processed more accurately and efficiently things like that. Um if we look at some of the tools um that we're using um this is you know this is the typical group of tools. Um we uh um we do a lot of work um with large systems. Um I'll show you in just a second uh some of our alliance partners.
Um but um you know we're we're fully stood up around uh using all the best practices around notebooking. We do a lot of work. Uh we have many R our developers. Uh Python developers um uh Omar's group makes extensive use of TensorFlow. I make a I make a lot of use of H2OI. Um and then um of course a lot of um capability around all the common BI tools. And so our whole go our whole goal around um around our data and analytics practice is to quickly find um value out of data and then push that higher up into the organization. Um we are um our our mix of onshore versus offshore. We tend to be about um 30% uh onshore or nearshore and then we also have some global delivery centers that we use for some of our managed services um or more straightforward u migrations and things like that.
We have a number of global alliance partners. Um some of the notable ones are um Adobe um we have a global alliance with Adobe. So we have a number of consultants that are very well verssed in the entire Adobe stack. We also have a big practice around SAP.
We're a global alliance partner also with Microsoft and we are actually involved in some co-development work with them. Um and um uh and then um and then we have a number of other um interesting alliances. So for example um one that's of interest to me is we have an alliance with IBM for example and and um which opens up some interesting possibilities about large server on-prem deployments of graphs and things like that. All right so that's enough about EY. How many people are here at Graph Connect for the very first time? Raise your hand. Excellent. How many people have actually I'm gonna be gentle. We're going to start slow. And so um the first thing that I want to talk about is what is a graph? Okay. And um and uh this is uh something that actually this is probably the my most used slide in all of my decks. So when I we go talk to business leaders, we always start right here. But um so what is a graph? So a graph is a is a visual representation of how uh data uh is connected, how different things are connected.
And um graphs are very useful for describing processes.
And you know this because anytime you give somebody a dry erase marker and they and you ask them, you know, tell me how your business works or how this system works or whatever, um within minutes, somebody is drawing bubbles with arrows to more bubbles and boxes and so forth. And they've began to to use a graph as a construct to explain how a complex process works. And one of the really fascinating things about graphs is that you have this interesting dichotomy between nodes and relationships. Sometimes nodes are called vertices, sometimes relationships are called edges.
And um what's interesting about this is that from a design perspective, you can actually leverage this in a couple of different ways. So I can take I can take my graph representation um and I can create a database in something like Neo forj and the schema of that um of that database can be an almost exact replica of what was originally described. And one of the most important features for driving graph adoption in businesses is they have this um very high degree of what I call semantic fidelity. And so as a data developer, you can have a very very informed discussion with your business counterparts and you can say, you know, here's how I understand your business works. Here's the schema I've built. May I show it to you? And in the SQL world, that would be a horrifying statement, right? But in the graph world, that's actually kind of fun. And you can sit right down with the business leads and you can say, "This is what how I I understand it works." and that business leader can basically say no no it doesn't work that way there's an arrow missing and you're like great we'll create another relationship and so there's a very nice agile flow around graph development and so in this slide here the graph that we've described and you guys are have been following along is just a simple e-commerce scenario where we're trying to drive somebody to a website and so in that in that um scenario I have I'm sending email to people um I'm trying to get that person to visit visit the website and when they get to the website I want them to buy a product that's sold on that website and so that's what this little graph shows and in this schema um we've implemented a graph database that does exactly that and in the graph database um I have my nodes for my emails and so think of a whole bunch of individual emails each the each would be labeled as an email but the contents of that node might be the specifics of what that message was I have a bunch of customers.
So these are this is my person node and I have I would have a whole bunch of person nodes and every one of those nodes would carry the details of that individual. I would also have a website node and maybe that node would have um a bunch of pages associated to it and I would carry all the details of the pages. I'd have my product nodes and I'd have all my product records and now whenever we do one of these executions I have the opportunity to set a relationship. So we did send an email to this person. So I can set that relationship. Now I have a con now I have a concrete connection between a group of emails that were sent to a discrete individual. Did that individual take action. Did we see them on the website? If so, I can set another relationship. Yep. They visited the website right now. Did they buy something? And and and uh and what was it that they bought? And then I can actually connect the product node. So, I know what my inventory on the website is because I can see that it's sold on the website. And so, the real thing that I'm looking for is did they buy the thing that was sold on the website. Now, if you were to write a SQL query and you wanted to actually find out how many individuals went through this pattern, you'd have to touch um at least four different tables, you'd have to do a lot of recursive querying to figure out how many paths existed across those relationships.
in uh in a graph world, instead of figuring out what tables you're trying to put together and what keys you want to join use to join those tables, you declare a traversal path. And I know this sounds very simplistic to those of you who have already used graphs. But it's important to reme remember that the biggest shift around thinking about graphs is to begin to imagine how you traverse the graph. And so here we see um some example code. And in that code block, this is how simple it is to query this graph and come back with this pattern. And so here we're basically saying we're going to send this email to this person. And because Neo Forj is a property graph, we're actually going to filter for only the emails that were sent to a guy named Steve Newman.
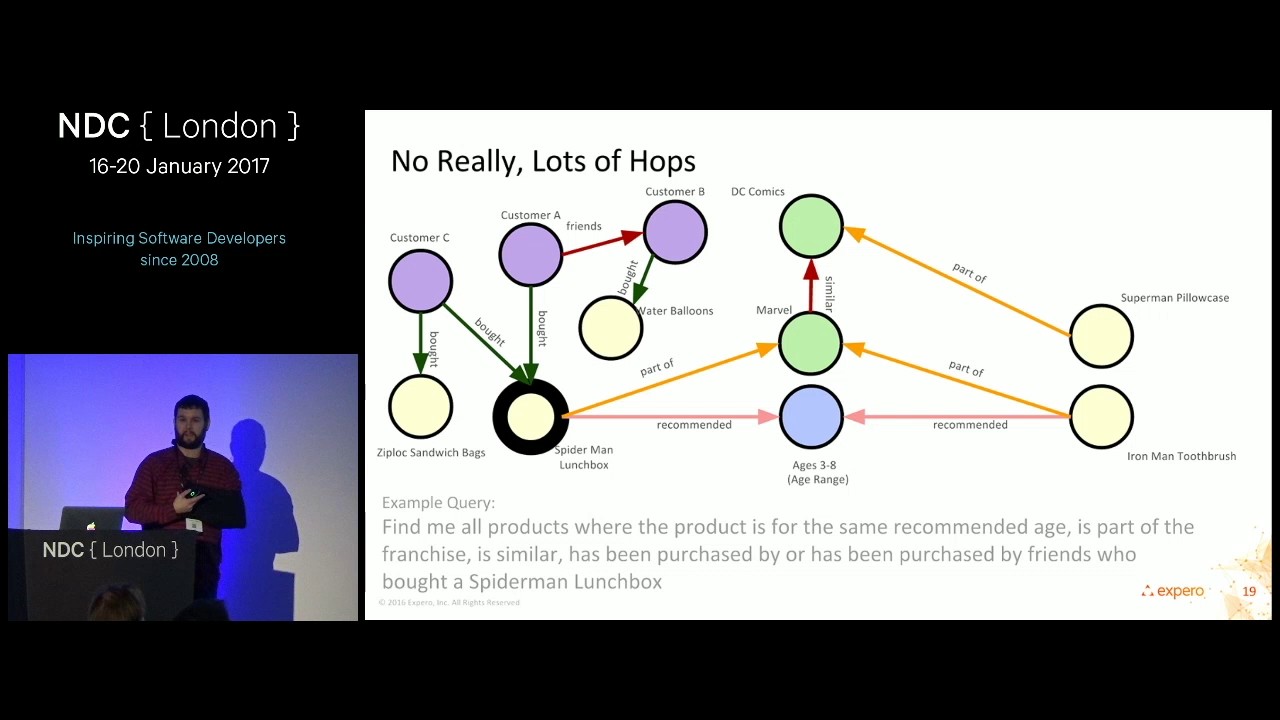
And we're also going to apply the constraint that Steve will have had to have visited the website. And we're going to apply another constraint that he's bought a product that's been sold on that uh that's been sold on that website. And now given this complex cyclic query which is it's a correlated subquery, right? Represented in a single line um of code then it will return all the records that satisfy that pattern that traversal pattern. And so um and so graphs are very very good for doing these kind of complex um uh traversals across large landscapes of data. And um one of the interesting things about graphs is that all of the logical possible relationships that would exist between two data entities would have been premputed and stored in the storage structure. Um this makes them very very fast at query time. So they're a little slower to write to, but they're very, very fast to query, much faster than SQL. The other thing that's very important about graphs is that you can query through traversals many, many, many different entities and still get a very linear consistent response. You'll never have the graph database just simply fall over and throw up its hands and say, I'm out of memory, which happens all the time in SQL. And anybody who's a SQL pract practitioner, you know, you do a lot of work with query optimizer and hinting and the ordering of the tables and all this kind of stuff so that you don't run out of memory. not a concern in a graph.
So, um, what are some of the use cases for graphs? This is a slide. I'll I'll admit it. It was a better slide than I could make myself and so I stole it from Neo forj um a while ago. Um, you'll recognize it. Um, but this just gives you a really nice view of some of the some of the use cases around graphs. And so um one of the most common requests we get from our customers are customer 360 um uh recommendation engines, marketing attribution, enterprise search, and a host of others. And so we'll touch on some of those in a second. So why are we excited about graphs? Several reasons.
First one, they're super super fast on query time, which means that you can use a graph and run a really high performance digital experience directly off your graph.
They're easy. They're great development targets. They're iterative. They're forgiving. You can figure stuff out with a graph. You can load your nodes, set a bunch of relationships, and scratch your head and say, "You know what? I don't like the way those relationships look."
So, you just blow away the relationships and redo it. No big deal. Um, they're very impactful. And so, there's there's several uh ways of thinking about graphs. So, Neoforj is an OLTP optimized in-memory graph. It's wonderful for real-time applications. Um and um and then uh you can use graphs and we'll talk about this a little bit later um for use for doing machine learning and you can do that actually inside the graph you can do it using other OLAP um graph structures and all of that is a really great ecosystem uh for driving really impactful use of your data and I believe they're fully transformative and so a lot of the work that we're seeing is people start off with proof of concepts in a single data domain and they very quickly realize the power of this construct and they want to add additional domains and it really just becomes an a matter of rolling in and designing additional new edges and nodes uh for that graph and bringing them together. And so it's very it's it's well within the realm of possibility and there's and there's many use cases out there where large enterprises have basically said you know what we're going to use this graph to span many more data domains than we typically would with say this reporting system or this operational application.
And then finally, um, I look at them as being highly strategic and they're very, very good at unifying and mobilizing data and bringing that out to frontline experiences. And so, in my personal opinion, you know, data work is great, but unless you can mobilize that data and bring it out to customer experience, um, you haven't been as successful as you could be. And so, let's talk a little bit about data lakes. Um, I love data lakes. They're so beautiful and clean and, uh, it's such a great vision.
like all your data in one place. It's like, wow, that's really where I want to be, right? Um, but then you start to very quickly hear what's probably the most common corporate lie in the data world, which is we'll have the data lake done by next year. And I hear this every year, right? And the fact is, of course, a data lake is never going to be done, right? And u as the business evolves and grows, more and more data sources come in. Um, there's lots of unstructured data now being held in in uh data lakes.
you have whole topic areas where no one's even gotten around to thinking about it and so they take a whole snapshot of an Oracle database or a teraba you know and then they dump it into the data lake and like oh yeah we have an S3 you know bucket that has all of the data from our Oracle system you're like well have you looked at it there no we can't get around to it this year um and then of course there is some there's often um a lot of attention on specific data domains they tend to be highly conformed and curated and that's great great place to start working and then of course there's streams and so you have streaming technologies that are being stood up all the time around core processes and this is a great uh architectural model uh the the publish subscribe model. So the reason we like graphs and I'll say it again is that um we believe that graphs are a terrific accelerator for mobilizing data. And so this is kind of a functional um uh architecture here. And what we're really talking about is putting a graph layer over your data warehouse or your data lake. And what that gets you is it puts you very quickly into the world of real-time queries. You're out of batch mode. It puts you into the world of being able to iteratively and in an agile fashion evolve your data um uh your data uh presentation with how the business is changing. And typical consumers of graphs would be things like mobile and web applications, real-time BI and scorecards, your data science teams. Um and you know the another truism is that you know CIOS and those folks they don't necessarily care about the data itself. They're more concerned about the containers. The people that really care about the data the quality of the data what the data means what are the implication of the analytics. These are all of the end users across the business. You know your marketing departments your your ops departments the folks are involved in privacy and data governance product recommendations and development. um your sales teams. These are the people that need to see accurate data and they need to be able to leverage um all of the other things that graphs can do in ter in terms of um providing wider scope for their queries, machine learning, etc. And so um our vision for advanced analytics rests on basically four pillars. So our first pillar is natural language processing and um we have um a lot of um we've done a lot of work in this area and we believe that this is a really important area of focus because it's where you understand intent. It's where you understand sentiment. It's where you understand the nuances of how humans are interacting with each other. Um which you can't typically get out of structured data. machine learning is the the usefulness of machine learning is dramatically improved in scenario in when you can expose it to some NLP um sourced um information. The other thing uh the the next pillar is we've done a lot of work around um open uh platforms and we've actually built fully containerized platforms uh in Azure that that have uh the entire Apache stack from top to bottom and we use that we use those kinds of environments to do um large models um and we also um use them basically as test beds for customers to come and try out uh new ideas without getting into a lot of technology risk and And of course, knowledge graphs.
We're big fans of knowledge graphs. Um, we believe that ultimately this provides the best path for a full 360 view of your customers, whether you're involved in B2B or B TOC, if your customers are external or they're internal customers.
And um, and furthermore, what really constitutes a knowledge graph is when you take a data graph, which might be just a graph-based representation of your SQL environment, and then you begin to apply machine learning to that data, and then you write those results back to that graph.
And then finally, you have to get the data out of the data environment and out to the front edge. And so we have um uh we've placed a lot of bets around technologies like NodeJS um microservices um streaming um because we want to be able to set up um very um uh very um lowweight microservices so that we can actually do things like put a recommendation that's very intelligent recommendation in a widget that might be being rendered in a relatively unintelligent web experience. Right? So rather than doing a broad, you know, IT transformation, we're really looking for narrow narrow pipelines where we can push really smart um analytics right out to the front edge. And so with that, I'll hand it over to Omar.
Thanks, Michael.
All right, so a little bit about myself, right? So I started off as a quant finance you know financial engineering and applied mathematics and pretty soon I started getting into machine learning right the linear algebra and the optimization theory the same mathematical frameworks they use in financial engineering are pretty much used in machine learning as well right and so within advanced analytics what we do is we help our clients create build and implement practical AI and big data strategies right and kind of revolves around three key pillars the first is you understanding the customer to drive the growth agenda and customer experience taking out a process end to end and applying the right RPA and machine learning frameworks for intelligent process automation and then better signal for risk and control right and so with machine learning AI big data all the big buzzwords every executive wants to know how do I use this is this just smoke and mirrors are just buzzwords how do I leverage this to get an edge and create process efficiencies or gain better insights right and so one One of the big things is obviously natural language processing. Every day a whole slew of unstructured text is created from all the various different communication channels that exist, right? Especially in financial services.
You know, you could have a call center.
You're getting thousands of calls from clients every single day. You want to know what they're talking about. What products are they talking about? What's the topic conversation? What's the sentiment? You know, is my agent handling that call properly or do I have to give them additional training? In wealth management, you want to know how your financial advisors are talking to their clients, right? How are the clients related to one another? In sales and trading, you could be a desk that's getting thousands of emails a day from institutional clients. These could be anything from collateral margin obligations or price verifications or just some sales guy yelling at you. And so natural language processing has immense use cases within just the financial services industry from back office to front office no matter where you are, right? And so using natural language processing, we can extract a lot of the features from the conversation, right? What are people talking about in terms of context or topic? The entities being mentioned, is it an Apple stock, McDonald's, uh the country of USA or Russia? The sentiment and the intent. And when you pair up these features that you're extracting with your domain ontologies and your domain hierarchies, you actually get very good practical use cases. And a lot of companies are now starting to build, you know, very targeted NLP pipelines across their businesses.
But those are great tactical use cases for NLP, right? How do you actually create those features that you're extracting and the use cases you have?
How do you make that into an actual strategic asset? Well, we view this is once you've got your NLP pipeline, start pushing those communications to the graph. And now you're actually building that communication channel as an actual asset, right? You're now building a network of communications all your clients are having. You're able to now relate your clients just based on the topics that they're conversing on because the graph makes that communicate that linkage natural. Right. And as you keep expanding on this and you add more and more domains, you start getting to very um intrinsic like langu uh natural language about just your own enterprise.
All the different communications are having within your business. You're starting to build the conversational intelligence platform. And now all those NLP pipelines that you had that are recording going through your call centers, going through your emails, you know, going through your FA to client conversations, you're actually starting to build that up as an actual strategic asset that you can use going forward to better understand what's happening in your business and where your clients are actually talking about, your customers are talking about. So now you're starting to build essentially a communication graph and you're trying to understand how your customers are related to know one another just based on what they talk about. But then you can start adding in additional things, right? So in this particular example, if you're a wealth management client, wealth wealth management business, you know, you've already started building your communication network. You know how your FAS are talking to their clients.
You know exactly what the points of conversations have been, what products are talking about, you know, what are the different trends, but then start bringing additional data sets, right?
Bring in your transaction data, bring in your account level data, bring in your FA data, bring in the different career aspects that you know about your client.
started building this 360 customer 360 view, right? With a knowledge graph, a customer 360 view is very natural and innate. Everything you want to know about that one customer is right there on that node a few traversals away, right? And then from that, you're connecting how that customer is related to the other customer as well. If they own the same stock, they're automatically related just with a few of traversals in the graph.
But this 360 view that a graph provides is more than just for customer 360 and trying to build a better understanding of your customer building next best action frameworks and recommendation engines. You can also use it for the other two pillars we're talking about.
So a big one would be conduct surveillance, right?
Collusion or conduct in sales and trading or even in sales. You want to know if sales reps are pushing stuff that they shouldn't be pushing. Are they talking in ways that they shouldn't be talking to clients, you know, how do you detect anomalous behavior amongst your traders? If you start using this 360 view of the knowledge graph in your sales and trading as well, start putting in all the different communication channels they have or is your who are your traders talking to? What are they talking about? Right? What are the different actions that they've taken?
You're now starting to build a subgraph of each trader and using anomaly detection, you can see, okay, I have nothing but a group of equity blue chip stock traders. I would expect their subgraph to be relatively the same.
Right? So you can start doing some anomalies anomalous based graph detection to start detection maybe collusion behavior or insider trading or you know any sort of abnormal conduct that you should maybe look into and that 360 view that the graph provides you know makes that very natural for you to look at in terms of your data.
But now let's go back to the wealth management example. Right? So now you started adding in all these different data sets. You're adding in all these different domains and you're building this enterprise knowledge graph which includes all your customer 360 views, the various different products you have, you know, all the different customer conversations, you know, and then how do you make it smarter now, right? It's already pretty intelligent. It knows everything it knows about your business.
All the information you want to know is at your fingertips. You can build search engines, what have you. But you can make it even smarter and more proactive by bringing external data, right? So something like a external news data sources. You can start appending that to your own internal graph. In this example, your own internal business knowledge graph might end up at Apple as the furthest in terms of your product domain, right? You know, every single customer that owns an Apple stock and all their FAS that are related to them, but that's only your internal business data. Once you start bringing external data sources, you can start knowing, okay, what are the external events happening around Apple? And then how does that impact maybe my customers portfolios right is there some sort of action I need to take knowledge graphs make that traversal information very easy and completely natural right so in this example if we start appending external news that's happening and start putting them into the relevant products that I own within my business I can start using natural language processing or other machine learning framework to detect significant events right if a significant event happens in one location of my graph I can add in business rules and domain domain logic to automatically tell the graph, hey, here's a specific type of event. I want this information to be passed over to this particular node in this particular domain of my knowledge graph.
So in this particular example, an event happens on Apple stock. You can you can make your knowledge graph intelligent and actually take actions on its own by putting in the business rule. Okay, significant event on this stock. I want you to send information to all the FAS who have clients that have positions in this stock. And that FA gets a notification and it says, "Okay, this here's an event. Maybe you want to look into it. Here's a news article." Right?
You're starting to make this graph now intelligent and now you're making your business proactive. And all you have to do is really you can just start off with simple rules, right? This information needs to be sent here whenever something like this happens. You don't even need to go into complex machine learning or AI or deep learning frameworks because every piece of your business is now connected in the way it should be. All you need to do is say, "Hey, this information seems like it needs to go here."
But you can do more than just information retrieval for say customer and actions. You can also build a knowledge graph as a massive calculation engine. Right? In banking, we have what we call ccore or stress tests where every single bank has to build these massive number of models to stress test across a variety of scenarios that the Fed gives them. This is generally a monthsl long process and banks typically take you know anywhere from 8 to 12 months to complete these stress tests all the way from identifying their risks building the scenarios that they think are going to actually stress their institution build the models that act that accurately capture their business and then also then aggregating those model results into different line items that they've then sent to the Fed or the SEC or to the shareholders in terms of their revenues, their balance sheets and whatnot. That's just an information flow, right? And a graph can actually capture all that as well. If you start graphing your risk inventory that you identify, then connect it to the identified macro variables or market variables that you said drive those risks, then those variables are the ones that also are the drivers in your models and non-models. And then those models also then have the the results of those models also aggregate up to financial statements. That's just an information flow that you can start putting in as a network of models using a graph database and now you've built yourself an enterprise calculation engine. If you're a CEO, you if you put all your models into this non-models and you link it up into a knowledge graph, you can just wake up and say, "Hey, you know, let's see what if VIX goes up five bits tomorrow morning and adverse scenario, what's the impact to my balance sheet?"
Right now, if you ask someone that, that's about a 3 to four month process.
But if you put all your models and use the graph as just a natural information flow and it's just a calculation engine where one model's input goes into the other as it should and then they all get aggregated. That's a very relatively quick calculation, right? You just put that into whatever app you build for it.
And if you change one node in this example, if I change a little information about the VIX, a time series of VIX, all the downstream nodes will be impacted. And then I can then just look at the PPR, which stands for pre-provision net revenue. So here's a net revenue line item, and say, okay, this was the impact from that change in nodes.
So knowledge graphs can also be used. So anywhere where information needs to flow and data needs to be linked, right?
Whether it's building customer 360 views, whether it's doing anomaly detection, cyber, or even like linking in a massive network of models. I mean, for some of these banks, these are like 800 to a,000 different models that can range from anywhere from regression to ratiobased to complex Monte Carlo and stocastic calculus models.
And then you can also do a lot of cooler things, right? Once you've built your entire business into knowledge graph, you've kind of built this layer that sits on top of your data systems, you can start building very intelligent um enterprise search engines. One of our large private wealth management clients came to us recently and asked, you know, I'm just a business guy. I've got my data spread across multiple different data systems and I get my weekly reports from the tech teams and that's nice and I get that to my clients but every now and then I want to just retrieve information and make some ad hoc reports but I can't do it because a I have to go talk to the tech team give them the variables that I want and then they pull it for me and it's a cumbersome process I just want my data when I want it how I want it right and we said you know what this seems like a classic knowledge graph plus natural language processing problem for you've got your structured data across maybe a dozen or so systems.
If we just put a graph database on top of that using natural language processing, we can give you a search bar. You just type in what you want, right? Using natural language, it'll be able to interpret the intent, the named entities that you're talking about, the timestamps and what have you, convert that into a cipher query, and pull the real information from a graph.
And that's just the beginning of how you would go about building an enterprise search, right? And then from here, it'll output. I mean, what I've shown you is just screenshots of the proof of concept that we built for them. You know, they just type in what they want and it'll give you an Excel file that they can go put into Tableau or Spotfire and create their ad hoc reports when they want.
Now, I'll hand it back over to Michael to talk about, you know, how you would actually go about starting building enterprise graph.
All right. Thank you, Omar. That was terrific.
Okay. So the next few slides are basically a little bit of a cookbook on how you can get started. Um uh so the basic process in getting to a data graph at enterprise scale. What we found as a general method that works well is we will um after we've done some you know we've we've done some uh locating of where the data is etc. Um the basic process is we'll u we'll build a bunch of queries. um those queries result in what I call graph form tables. So these would be deep tables of either nodes or relationship maps between nodes. And then what we'll do is we'll just do a simple select star query from each one of those tables. And I'll get to why we do it that way. Um and then we create a zipped um a compressed CSV file. And then we load that into Neo4j. Um and the Neo Forj loader there's a terrific fast loading tool that can directly um consume zipped uh CSV files is highly highly efficient. It and this is used for essentially your initial graph hydration.
Um what we found is the hardest part about building a new graph is everything that happens before the graph. So um you know when you're starting to deal with really high volumes of data and you're trying to do things like map relationships and things like that um you have to observe all of your key key constraints. You have to make sure that all your string handling is done properly and there's a bunch of things like that. And so what we end up finding is that we have to iterate a lot um on the core tables. They're going to go form the graph. And so we'll spend you know weeks um working on those first two you know those first two major steps.
But then when it all comes together, as you can see there on the little black screen, um that's real output from a graph that I built um about a year ago on Azure. Um 500 million nodes, two billion relationships, hour and a half, just terrific performance. And of course, all of that is um being validated as it's being loaded. And being a database, Neo4j properly will complain very very loudly if it can't find a key, right? To to create a create a relationship between a node or if you violated a uniqueness constraint. All right. All right. So, the next part that's important to realize is that as you're talking with teams around your company. So, in this first model, um, if you're fortunate, you've got a pretty good data lake, pick some data that's already been worked on a little bit, and then you're basically in this business of creating node and relationship tables. Um, this is a good accelerant for your projects. Typically, that data will already be cleaned, someone will have thought about it and so forth.
Another common scenario that we see is uh our clients will have legacy databases and what we find here is that this is a little bit slower and I'm sure uh folks are aware of this but you'll have to do an individual extraction from every one of these databases and what's probably the slowest part of it is just negotiating access to that specific system. Um and then finally um we love working in streams. Streams are very easy to bring into a graph. Um we typically start thinking about streams after we've done our initial graph hydrations and we're talking about updates. There's a variety of ways to update graphs. You can use you know incremental uh CSV loads. Um you can have applications updating graphs through the various um uh drivers for example that Neoforj uh supports. U but streams are a great way to go and very scalable.
Now let's talk about how you go from that data graph to a to a knowledge graph.
Um and there's several patterns. So the first pattern and which is probably the most common pattern is um and we do this um we'll extract data out of Neo4j. It will typically need to be extracted in some kind of tabular um format um that will have all the features that are necessary to do the model build. Um we'll push that into um some modeling environment like R or H2O or TensorFlow and then we'll take the scored results and write that back to the graph.
little clunky. It works. It's very powerful. Leverages um you know the best abilities of each platform.
This is another pattern that's starting to emerge. And this is the pattern of using a distributed OLAP graph processing. And so we've had some really great discussions um here at Graph Connect about um uh the great work that Neoforj is doing with Spark integrations. And so I believe that this pattern will become increasingly prevalent. And so here you're talking about basically doing um uh doing extracts from Neo4j pushing those into graph frames inside Spark uh running a Scala based uh modeling procedure and then updating um from that output back up into Neo forj. Now, my favorite pattern and the one that I'm hoping we'll see the most progress in is of course in in graph in-memory machine learning and um there's been some really really nice work that was recently done uh by Michael Hunger and team um around a whole set of extensions procedures.
They're basically a plugin that you can put into your Neo Forj server and this this exposes for you a number of highly parallelized um graph machine learning algorithms. Um and uh this is a really powerful model because now instead of moving the data around to go where the modeling is, we're actually bringing the modeling into the graph. And um uh then this can be very very fast as well. And so where do we go from there? So once we have the model scores, um what transforms your your data graph into a knowledge graph is how you choose to write your predictions back to the graph. And so you've seen this little graph here that we have on the side. Um I did this for a PC. This is a marketing attribution graph. All those yellow dots are different marketing messages that have all converged on a single individual. And so the question on on the table is what marketing message should um should this individual be exposed to next so that they will convert to a lead. And if you look at this graph, you can see that there's a similarity relationship.
So I'll get back I'll get to that in just a second, but your So there's basically four ways you can think about how you want to make your graph smarter.
So you can take your predictions and you can just simply add them as properties to existing nodes. um this is commonly done. Another interesting thing that you can do, this is good for things like clustering algorithms is you can actually apply additional labels to nodes in your graph. So you can actually have as many different labels as you want in a Neo4j graph. All a label does is it just declares a set of nodes. And so those and those labels can be fully overlapping. And so that's kind of interesting. One of the and one of the things that you get by applying a label is you basically get a free index. And so you can immediately sub-segment your graph by labels. Of course, you can take, you know, complex model results um and uh and just push them in as nodes and connect them um into the graph. But I think one of the most powerful models around uh pushing scores into graphs is to leverage the relationship. And one of the interesting things about Neo4j, it is a property graph and you can put properties on relationships. And because you can put properties on relationships, right, I can have my two data points and I can have multiple model runs. And with each model run, I can set a new model relationship, a new predicts relationship that references which model made that prediction. It may be a probability score or a confidence score, a similarity score. And that's essentially what we're doing here with these similarity relationships. And so in this uh in this calculation we're computing similarities across every single customer to every other customer in this graph. And that's a and that's a very accessible kind of calculation in Neo4j. And then you write it out to the and you write it out as a as a relationship.
And now you can keep track of multiple versions of your models. And of course because of directionality you could have different different predictions for the same two nodes. As you can see, I've got a I've got some blue arrows where A is predicting B, but I could just as equally have B predicting A. And now I come up and then this becomes a very compact language for representing knowledge in the graph. And the most important aspect of all of this is that now that they are instantiated as relationships, I can actually traverse using cipher and pick out all the predicted nodes. And you could have multiple linked predictions. And this is what Omar was referring to earlier. you got a multiple linked predictions um extracting um uh highly related data that you're essentially imputing um using this combination of of the graph and machine learning and that's a very powerful construct. So um getting started this is a typical um sandbox. Um uh this is uh implemented in AWS. Azure has very similar um uh services. And so typically what we'll end up doing is we run it, you know, we'll do stuff in Hive. We'll create a a um a bunch a bunch of of those graph form tables um in S3 and then we'll import those into say a um an EC2 server that's running standalone in the virtual private cloud.
Um and what we always like to do is throw in a bunch of other tooling so that um so that the data science teams can be working directly with the graph using the packages of their choice.
So, uh, we're going to finish up right there. Um, uh, so how do you know you need to use a graph? And I think, um, rather than thinking about this as a technical problem, I think it's much better to think about it as a business problem. So, if you are starting to hear questions like, I have a large volume of incoming customer communication. How can I better understand what my customers are saying? That's a graph problem. How can I um how can I get a better understanding of my customers to give them a better experience, right? How can I improve the way that I directly interact with my customers? Another good graph problem. How can I be more proactive? How can I separate signal from noise? Again, a great graph problem. My data is spread across many, many sources. How can I easily get access to it and come up with a better view without having to go through so much difficulty? excellent work uh workload for graphs. And then finally, and I think this is probably the most important question, what's the next best action I can take? And in my opinion, a knowledge graph, a data graph that's combined with iterative machine learning is probably going to be the best pattern going forward um for answering that specific question. So with that, I'd like to say thank you. Thank you, Omar.
And if you have any questions, let us know.
Up Next

Deep Reinforcement Learning Lecture: MDPs, Q-Learning, and Policy Gradients
@stanfordengineering
384.7K views•2017-08-11

Secure Multiparty Computation (MPC): Foundations & Challenges
@SimonsInstitute
7.3K views•2015-05-28

Graph-Based Long-Term Memory for Agentic Workflows
@neo4j
280 views•2026-06-03
Neural Networks Explained: Math, Layers, and Learning Fundamentals
@3blue1brown
21.9M views•2017-10-05
Related Study Plans & Knowledge Roadmaps
Structured learning paths in Artificial Intelligence