

![Data Science Full Course | Complete Data Science Full Course For Beginners IBM [PART 7]](https://i.ytimg.com/vi/JCix5j4OdWI/maxresdefault.jpg)


















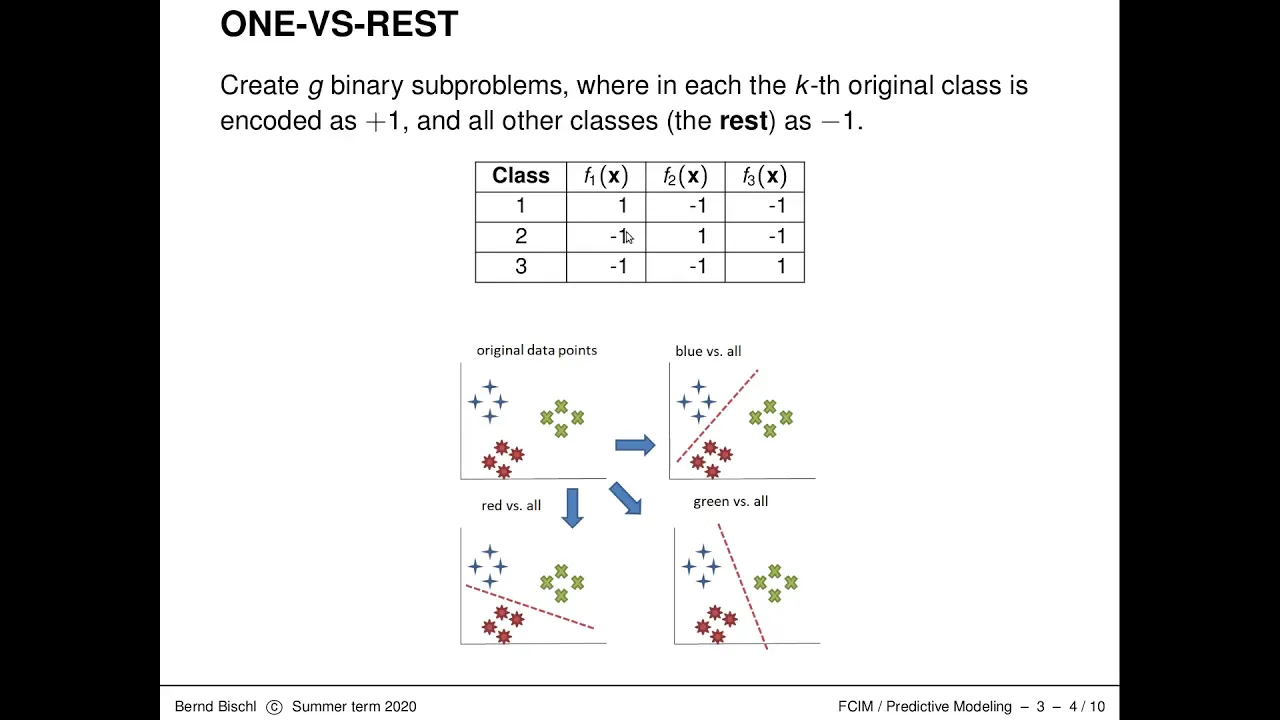





In multiclass classification, precision, recall, and F1 score are calculated per class using the confusion matrix, where precision = TP/(TP+FP), recall = TP/(TP+FN), and F1 = 2×(precision×recall)/(precision+recall); overall model metrics can be computed using sklearn's classification_report, with macro average taking the arithmetic mean of all class scores and weighted average accounting for class sample sizes.
Precision, Recall, and F1 Score for Multiclass Classification in Python
Added:Basic Python programming proficiency, including familiarity with data science libraries like NumPy and scikit-learn.
Fundamental understanding of supervised machine learning, specifically the difference between binary and multiclass classification tasks.
The concept of a Confusion Matrix and its core components: True Positives (TP), False Positives (FP), True Negatives (TN), and False Negatives (FN).
Theoretical definitions and formulas for binary classification metrics: Precision, Recall, and the F1-Score.
In-depth analysis of multiclass averaging strategies, specifically comparing Micro, Macro, and Weighted averaging methods.
Techniques for handling highly imbalanced multiclass datasets, such as adjusting class weights or applying resampling methods like SMOTE.
Evaluating multiclass models using Area Under the Receiver Operating Characteristic (ROC-AUC) curves via One-vs-Rest (OvR) and One-vs-One (OvO) approaches.
Integrating specific multiclass evaluation metrics into cross-validation and hyperparameter tuning workflows using scikit-learn's GridSearchCV.
12.9K views197likes14:24Original Release: 2022-06-09
hello everyone this is rashida welcome to my channel my today's video is going to be on precision recon and f1 score on multi-class classification problem if you haven't seen my last video on precision record and f1 score on binary classification i suggest please feel free to go and check that one first because that one explains the basics of all these concepts in today's video we are going to learn how to calculate precision recall and f1 score for each class of a multi-class classification problem we are also going to learn how to calculate these metrics for the total model we are going to use this model that we developed in one of our previous videos to demonstrate the calculation of precision recall and f1 score you will find the link to that video in the description box and i will still give an overview of this model for a refresher this was an image classification model and we use this famous fashion mist data set for this model we had fashion image trained or csp data for training the model and we had fashion nameless tested csv for testing the model for both of them we first had this label column the values ranges from 0 to 9 and each digit represents a fashion item and then we have these pixel values from pixel 1 to pixel 784 so in this first row we have this label 2 that represent a fashion item it could be a handbag it could be a dress it could be a shoes it could be a pullover t-shirt anything and then we have these pixel values in the same rows from 1 to 784 all these pixel values represent the pixels of the picture of that fashion item that's in level two and here is our testing data set here we are just separating the labels from the features labels are literally this label column and features has to be these pixel values the aim of this project was to train the model with the special values so that the model learns the pixel values and from the pixel values it knows which fashion item it was the next we wanted to see some of the pictures of this fashion items this is a pullover and some shoes ankle boot you can see this is a handbag and then we imported the logistic regression from the psychic learned library then we trained the model using the training data after that we got this course after that we got this course for the training set we had 86 percent accuracy and for testing data we had 85 accuracy to get to the precision we call an f1 score we need to find out the y prediction and also the confusion matrix so let's see that y print dot predict x test okay now the confusion matrix so first import s can learn import matrix okay now the confusion matrix matrix the confusion matrix why uh test the original one and why red look at the confusion matrix here is the confusion matrix look when we did the binary classification the confusion matrix was two by two because binary classification had only two classes zero and one and our in this model we had ten classes i want to put this confusion matrix in a heat map so it will look nicer and more presentable import method leave dot python plt import seaborn as essence p o t dot favors fixed size 9x9 now sms start i hit cn and not true and now format 0.3 f of sorry s line width 0.5 square true and we do not need any color bar and plt dot y label and y we will have actual values and plt dot x label these are the predicted values equal t dot show so here is the confusion matrix in a heat map as you can see it looks a lot more nicer and understandable these are the predicted values in this side and actual values in this side let's use this confusion matrix now this is the same confusion matrix i am just using a different color here i hope you remember the formula for precision from my last video precision is true positive over true positive plus false positive so let's see how we can calculate precision for each label okay let's take label nine what is true positive for label nine look this 947 was the predicted label for label line and again for label 9 we have this 947 true label or actual label so 947 has to be the true positive for label 9 so here we put 947 and bottom also true positive we put 947 here now the false positive what is false positive look at this two these two samples are predicted as level 9 by our model but these two samples are actually level 8.
again these 40 samples are predicted as level 9 but they are actually level 7 so they are false positives for label nine so the false positive would be one plus 38 plus 40 plus two look one plus 38 plus 40 plus two and so we have the precision of 0.92 which is really good for the perfect case position is one so in that case 0.92 is really high here we are calculating precision for label 2.
for level 2 true positive is 762.
actual label 2 and we have 762 samples now predictive label 2 is also 762 samples so 762 are the true positives the true positive over true positive plus false positives let's see the false positives these 18 samples this is actually zero but our model predicted them as two so this agent samples has to be false positive 4 label 2 4 this 16 72 105 and 9. they all are actually predicted as level 2 but actually they are not labeled they are level eight or six or four or one so the false positives are 18 plus four plus 16 72 plus 105 plus nine and it's 0.77 now recall the formula for recall was true positive over true positive plus false negatives so you also calculated to recall for label 9 and level 2.
as we already have seen 947 was the true positive for label nine and look at the false negatives this time look at these three samples it's actually level nine but our model predicted as label 8 it didn't predict as naval 9 so it was predicted as a negative for label 9 right look at this 36 it's actually label 9 but our model did not predict them as label 9 so for label 9 this 36 actually falls negative so the false negative has to be 3 plus 36 plus 14.
so recall is 0.947 so recall is very high record for level 2 as usual you already know this true positive was 762 and then let's see the false negatives look at these 14 samples it's actually labeled 2 but our model predicted is level 0. so it did not predict it as label 2. so for lamb 2 these 14 samples were false negatives same as this 2 same as this 13 same as this 122 so the false negatives has to be 14 plus 2 plus 13 plus 122 plus 75 plus 12.
the recall came out to be 0.762 for label 2.
i'm only showing precision and recall for label 9 and level 2 only but you can use the same method and calculate precision and recall for each and every label the f1 score we are just going to calculate the f1 square using the simple formula two times precision times recall over precision plus recall so you can see for label nine we have zero point nine three and four label two we have zero point 0.766 as a reminder f1 score is the harmonic mean of precision and recall and f1 score tend to lean towards the lower value between precision and recall if either precision or recall one of them is zero if one score becomes zero so to get a high f1 score precision and recall both has to be high the good news is you don't have to calculate the precision recon and f1 scroll that way you can use the simple line of code print now matrix dot classification report you simply give y test and y prediction and you can see the precision recall and f1 score for each label we have label from zero to nine so we got precision we call an f1 score for each label and you can see this support these are the number of data for each label we have 1000 data each for each label so total we have 10 000 data look this is good to have precision recall an f1 score for each label but at the end of the day we still want one single position we call an f1 score for a certain model so for the overall model we have the precision of 0.85 0.85 was the recall and f1 score also 0.85 luckily and weighted average also 0.85 0.85 now look how to calculate this macro average and weighted average precision recall and f1 score the macro average iphone score is actually the arithmetic mean of all the f1 score we have 10 f1 score for 10 labels so simply you add all the 10 values and divide it by 10 that's how we get macro average f1 score 0.85 and the weighted average f1 score takes into consideration the number of samples we have the same amount of data for each label for 0 we have 1000 data for one we have 1000 data and for nine we have one thousand data all one thousand right and over we have ten thousand data so luckily we have one thousand data each that's why macro average and weighted average are exactly the same but it doesn't happen in most of the cases in most real world data set we have different number of data for different labels in that case macro averaging weighted average f1 score can be different look at this weighted average f1 score so the sample size is 1000 for label 0 and f1 score is 0.81 so 1000 times 0.81 plus again the sample size of label 1 1000 times the f1 score for label 1 and 0.962 plus consider all of them and at the end for level 9 we have 0.934 the f1 score times the sample size 1000 divided by total sample size 10 000. so we got 0.85 so you can calculate the macro average and weighted average precision and recall in the same way simply take the arithmetic mean of all the precision for macro average precision and simply take the arithmetic mean of all the recall for macro average recall and for weighted average precision take precision times number of sample plus precision 0.95 times 1000 plus precision 0.77 times 1000 and so on divided by the total number of samples and for recall also do the same because we have the same number of samples for each label but it doesn't happen very often in real world in most of the real world data set you will find different number of samples for different labels in that is macro averaging with an average varies well that was all about precision recon and f1 score for multi-class classification problems if you like this video please like comment share and subscribe thank you so much for watching
Up Next

5:36
Coqui TTS Setup: Local Voice Cloning with Web UI
@Dev-Spot
19.2K views•2023-12-26

57:48
Secure Multiparty Computation (MPC): Foundations & Challenges
@SimonsInstitute
7.3K views•2015-05-28

13:03
Bypassing Tor Censorship: Bridges and Pluggable Transport Guide
@Coding_ForEveryone
397 views•2024-06-11
18:41
Neural Networks Explained: Math, Layers, and Learning Fundamentals
@3blue1brown
21.9M views•2017-10-05
Related Study Plans & Knowledge Roadmaps
Structured learning paths in Artificial Intelligence
artificial-intelligence
Aligning LLMs: DPO, TRL & Custom Datasets
01Foundations of Python & Machine Learning
02Transformers and Large Language Models (LLMs)
03Aligning LLMs: SFT and RLHF
+ 3 more learning modules
24h6 modules
Explore Roadmap
artificial-intelligence
Federated Learning: PyTorch, Flower & Privacy
01Python & Machine Learning Foundations
02Deep Learning Basics with PyTorch
03Introduction to Federated Learning
+ 2 more learning modules
35h5 modules
Explore Roadmap
artificial-intelligence
Securing LLMs: Guardrails AI & NeMo Gateway
01Introduction to LLMs, Python, and APIs
02Understanding LLM Vulnerabilities & Threats
03Defending LLMs with Guardrails AI
+ 2 more learning modules
15h5 modules
Explore Roadmap
artificial-intelligence
Building Recommenders: Two-Tower & Vector DBs
01Foundations of Python & Machine Learning Basics
02Introduction to Recommender Systems
03Deep Learning & Representation Learning
+ 3 more learning modules
75h6 modules
Explore Roadmap