Clang AST Linters: C Buffer Overflow & Leaks
Learning Goal
To build a functional static analysis linter in Python using the Clang AST (via
libclangbindings) that traverses C source code to programmatically detect memory leaks (allocated memory not freed) and buffer overflows (unsafe string copies and out-of-bounds array access).
- Prerequisites: Intermediate programming experience (Python & basic C), familiarity with memory concepts (pointers, stack, heap), and a terminal environment.
- Estimated Total Study Time: 18 Hours
Course Map
Module 1: C Memory Management & Vulnerabilities
In manual memory management systems like C, the programmer is directly responsible for requesting and freeing resources. This module focuses on the mechanics of the run-time stack and heap, pointers, and the severe safety risks—such as buffer overflows and memory leaks—that occur when memory rules are violated.
Recommended Videos
Why this video
This video explains how memory is structurally organized during execution. It presents a visual comparison between stack-allocated variables (handled automatically by the compiler) and heap-allocated objects (managed manually at runtime). It builds the mental model needed to understand why heap allocations can "leak" while stack frames clean themselves up.
Why this video
A focused, program-level demonstration of how dynamic allocations via malloc() become orphaned. You will learn how failing to call free() on active pointers permanently blocks system RAM, and you'll see simple code patterns that introduce these bugs.
Why this video
This classic computer security lesson shows how a program that accepts user input without verifying buffer bounds can be manipulated. You will watch step-by-step how adjacent memory on the stack (including the function return address) is overwritten to hijack execution flow.
Knowledge Checkpoint
- Contrast how the life cycle of stack allocation differs from heap allocation in C.
- Explain what happens to the address space of a process when a pointer variable containing a heap address falls out of scope without being freed.
- Diagram a stack overflow exploit: show the location of the buffer, the frame pointer, and the return address.
Module 2: Compiler Basics & Abstract Syntax Trees (AST)
Before writing a tool to audit C code, you must understand how a compiler processes it. This module covers parsing, intermediate representations, and the structure of an Abstract Syntax Tree (AST)—specifically focusing on how the Clang compiler frontend represents source structures.
Recommended Videos

Why this video
This short, animated guide explains the sequential phases of translation: Lexical analysis (breaking characters into tokens), Syntax analysis (grouping tokens into a tree structure), and Code generation. It explains how compilers transition from raw source code to structured parse representations.
Why this video
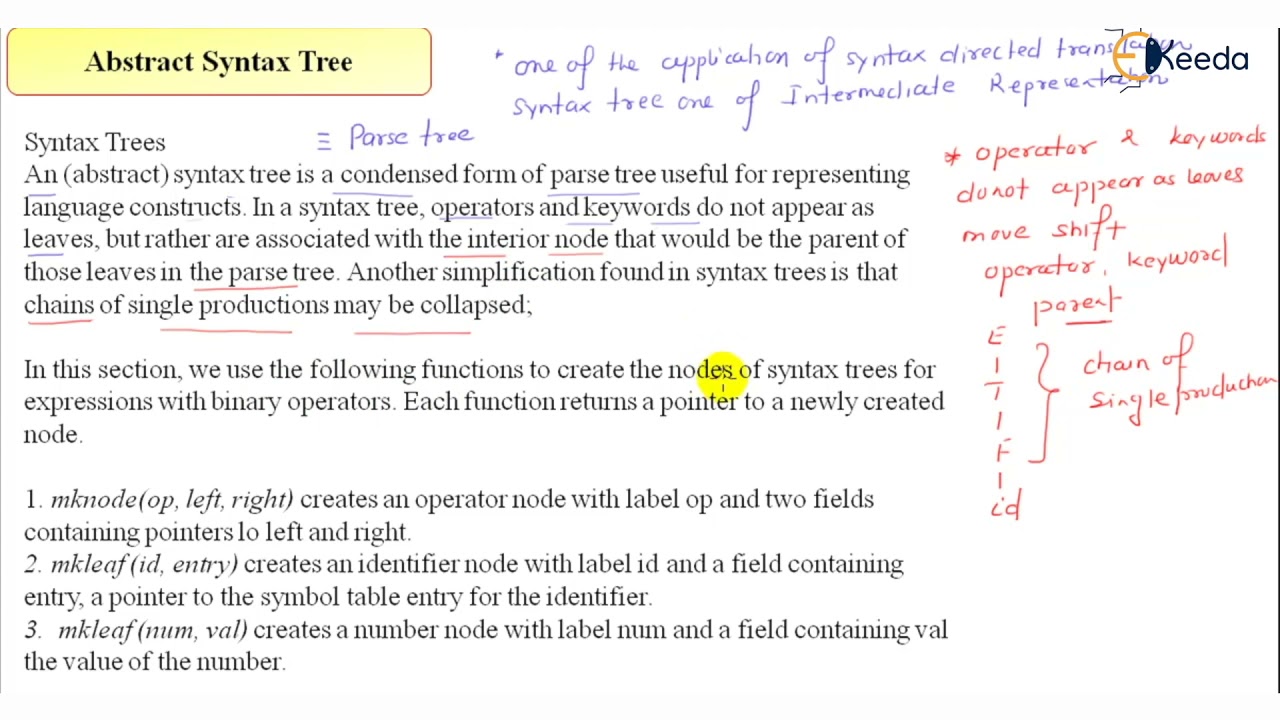
This video provides a deep dive into the difference between a detailed parse tree (Concrete Syntax Tree) and an Abstract Syntax Tree (AST). It explains how AST nodes discard grammatical boilerplate (such as semicolons and brackets) to focus entirely on structural semantic units like operators, variables, and expressions.
Why this video
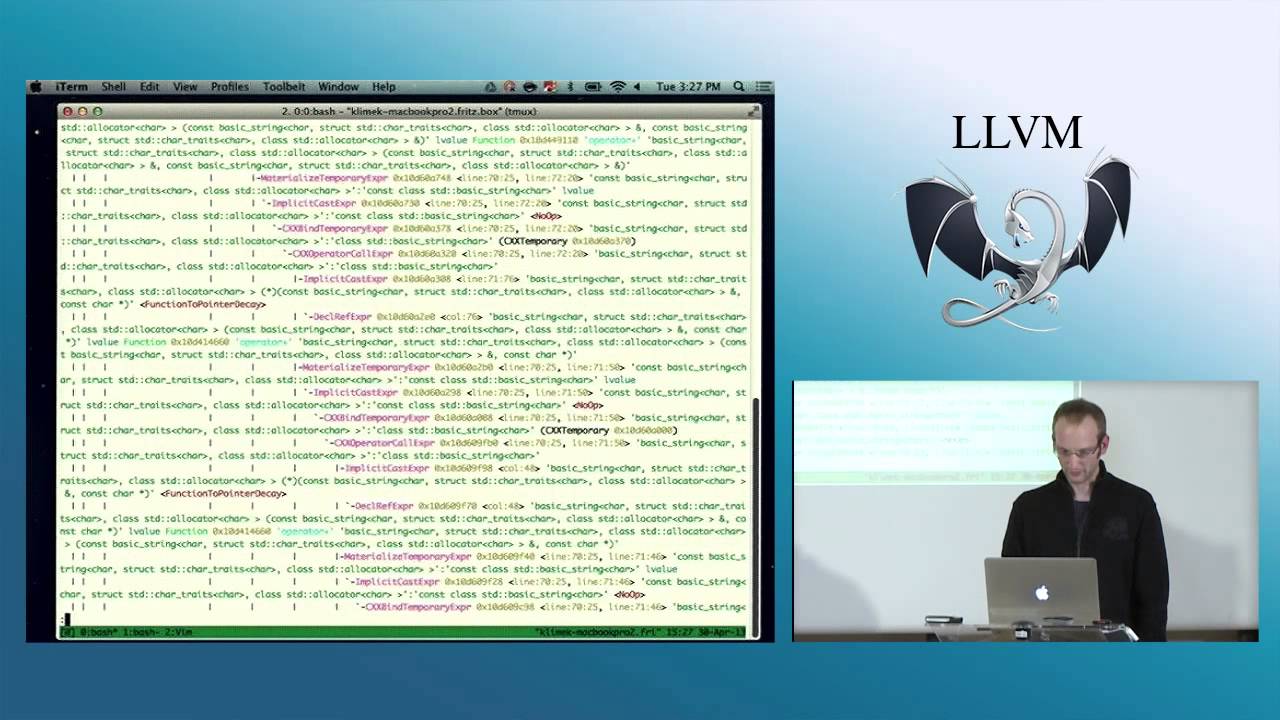
An essential deep dive by a core LLVM contributor on the design of the Clang AST. Manuel Klimek explains how Clang models types, declarations, statements, and expressions using an optimized, immutable tree structure. It provides the exact theoretical basis you need before writing Python-based AST traversal code.
Knowledge Checkpoint
- Explain how a compiler turns raw text like
x = 5 + y;into hierarchical AST nodes. - Distinguish between a declaration node (e.g.,
VarDecl) and an expression node (e.g.,BinaryOperator) in an AST. - Explain why static analysis tools prefer analyzing an AST over regex matching on raw source text.
Module 3: Parsing C with Python and libclang
To write our custom linter, we will use Clang's stable C interface (libclang) via its official Python bindings. This module guides you through environment setup, parsing a C source file into a translation unit, and traversing the AST nodes programmatically in Python.
Recommended Videos

Why this video
This presentation shows you how to script AST traversals using Python's clang.cindex library. It walks through real examples of filtering cursors, inspecting child nodes, and extracting source file line numbers and positions.

Why this video
This short segment demonstrates how to query Clang cursors to extract metadata like names, variable types, function signatures, and field lists. It's a helpful reference for understanding how libclang exposes attributes of source entities to Python.
Practical Guide: Python libclang Setup
Since beginner setup material is limited in the video pool, use the following guide to prepare your environment.
1. System Requirements
You must install LLVM/Clang on your host operating system so that the Python bindings can load libclang.so (Linux), libclang.dylib (macOS), or libclang.dll (Windows).
- Ubuntu/Debian:
sudo apt-get install clang libclang-dev - macOS:
brew install llvm - Windows: Download the LLVM binary installer from the official LLVM releases page or install via
winget install LLVM.LLVM.
2. Installing Python Bindings
Install the official bindings package:
pip install clang
3. Diagnostic Script
Verify your installation with this script. If libclang is installed in a non-standard directory (common on macOS with Homebrew), manually specify the path using Config.set_library_file().
import sys from clang.cindex import Config, Index, CursorKind
On macOS, you might need to point directly to your Homebrew LLVM installation, e.g.:
Config.set_library_file('/opt/homebrew/opt/llvm/lib/libclang.dylib')
try: index = Index.create() print("Success: libclang bindings loaded correctly!") except Exception as e: print(f"Error loading libclang: {e}", file=sys.stderr) sys.exit(1)
Knowledge Checkpoint
- Set up a Python virtual environment and successfully run a basic
libclangdiagnostic check. - Define what a
Cursoris inlibclang, and list three key attributes it provides (e.g.,kind,spelling,location). - Write a simple recursive Python function that visits every node in an AST and prints its type and name.
Module 4: Static Analysis: Detecting Buffer Overflows
Buffer overflows occur when data writes overrun the boundary of an allocated buffer. We can prevent these bugs by writing custom rules to look for unsafe, unvalidated runtime string functions (like strcpy or gets) and out-of-bounds array access.
Recommended Videos
Why this video
This video introduces the principles of static security auditing. It explains how tools trace "sources" (unsafe input interfaces) to "sinks" (unbounded string copy actions) to discover buffer vulnerabilities without running the application.

Why this video
Dave Plummer highlights the specific C runtime library functions (such as strcpy, strcat, sprintf, and gets) that lack internal size constraints. This video acts as a target list of function names for our static analyzer rules.
Practical Implementation: Detecting Unsafe Function Sinks
To help you apply these concepts, here is a functional Python script using libclang that scans a C file's AST to detect calls to unsafe functions.
Target C Code (target.c)
#include <string.h>
void exploit_me(char* user_input) { char local_buffer[64]; // Vuln: strcpy does not check if user_input length fits into local_buffer strcpy(local_buffer, user_input); }
Linter Script (overflow_linter.py)
import sys from clang.cindex import Index, CursorKind
UNSAFE_FUNCTIONS = {"strcpy", "gets", "strcat", "sprintf"}
def analyze_ast(node, filepath): # Only report issues inside our target source file (ignores headers) if node.location.file and node.location.file.name == filepath: # Check if this node is a function call if node.kind == CursorKind.CALL_EXPR: # Check the spelling of the function called func_name = node.spelling if func_name in UNSAFE_FUNCTIONS: print(f"[WARNING] Buffer Overflow Hazard at line {node.location.line}, " f"col {node.location.column}: Use of unsafe function '{func_name}'.")
# Recurse through all child nodes
for child in node.get_children():
    analyze_ast(child, filepath)
def run_linter(source_file): index = Index.create() # Parse source file translation_unit = index.parse(source_file) print(f"Scanning '{source_file}' for unsafe function calls...") analyze_ast(translation_unit.cursor, source_file)
if name == "main": if len(sys.argv) < 2: print("Usage: python overflow_linter.py <path_to_c_file>") sys.exit(1) run_linter(sys.argv[1])
Knowledge Checkpoint
- Explain why the Clang AST representation of
strcpy(dest, src)uses aCALL_EXPRcursor. - Extend the
UNSAFE_FUNCTIONSlist in your Python linter to flag bothgetsandsprintfcalls. - Discuss the difference between syntactic checks (checking for function names) and semantic checks (comparing the size of an array with the input index).
Module 5: Static Analysis: Tracking Memory Leaks
Detecting memory leaks requires tracking how dynamic allocations move through a program. This module shows how to write an AST analyzer that matches memory allocations (like malloc and calloc) with their corresponding deallocations (free) inside a function.
Recommended Videos

Why this video
This video explains how debuggers and analytical tools extract control flow graphs and track allocations. It helps you understand how compiler outputs can be mapped to runtime memory models.
Why this video
Jacob Sorber shows how to build basic runtime tracing mechanisms for malloc and free. Studying this runtime tracking behavior will help you design a static analysis engine that tracks pointers as they enter and exit function scopes.
Practical Implementation: Static Pointer Life Cycle Tracking
This script uses libclang to parse a C file and run a basic static check. It verifies that any variable assigned the result of a malloc() call is subsequently passed to a free() call within the same scope.
Target C Code (memory_test.c)
#include <stdlib.h>
void good_function() { int* ptr_a = (int*)malloc(10 * sizeof(int)); free(ptr_a); // Resolved }
void leaky_function() { int* ptr_b = (int*)malloc(20 * sizeof(int)); // Leak: ptr_b is never freed before the scope ends }
Linter Script (leak_detector.py)
import sys from clang.cindex import Index, CursorKind
def find_allocations_and_frees(node, filepath, allocations, frees): """ Traverse AST recursively to extract variables receiving mallocs and the variables passed to free(). """ if node.location.file and node.location.file.name == filepath: # Detect: Var assignment involving a malloc # e.g., int* ptr_b = (int*)malloc(...) if node.kind == CursorKind.VAR_DECL: # Inspect children of the declaration to find if malloc was assigned for child in node.get_children(): # Traverse cast operations to find the actual call expression expr = child while expr.kind in (CursorKind.UNEXPOSED_EXPR, CursorKind.CSTYLE_CAST_EXPR): expr_children = list(expr.get_children()) if expr_children: expr = expr_children[0] else: break
            if expr.kind == CursorKind.CALL_EXPR and expr.spelling == "malloc":
                allocations[node.spelling] = {
                    'line': node.location.line,
                    'freed': False
                }

    # Detect: free(variable)
    if node.kind == CursorKind.CALL_EXPR and node.spelling == "free":
        # Inspect the first argument of the call to get its variable reference
        args = list(node.get_arguments())
        if args:
            arg = args[0]
            # Walk past any implicit casts
            while arg.kind in (CursorKind.UNEXPOSED_EXPR, CursorKind.CSTYLE_CAST_EXPR):
                arg_children = list(arg.get_children())
                if arg_children:
                    arg = arg_children[0]
                else:
                    break

            if arg.kind == CursorKind.DECL_REF_EXPR:
                frees.add(arg.spelling)

for child in node.get_children():
    find_allocations_and_frees(child, filepath, allocations, frees)
def check_memory_leaks(source_file): index = Index.create() translation_unit = index.parse(source_file)
allocations = {}
frees = set()

find_allocations_and_frees(translation_unit.cursor, source_file, allocations, frees)

print(f"Analyzing '{source_file}' for basic memory leaks...\n")
for var_name, info in allocations.items():
    if var_name not in frees:
        print(f"[ALERT] Memory Leak Found! Variable '{var_name}' allocated at "
              f"line {info['line']} is never freed in this file.")
    else:
        print(f"[OK] Variable '{var_name}' allocated at line {info['line']} was freed successfully.")
if name == "main": if len(sys.argv) < 2: print("Usage: python leak_detector.py <path_to_c_file>") sys.exit(1) check_memory_leaks(sys.argv[1])
Knowledge Checkpoint
- Run the
leak_detector.pyscript against the target C file. Confirm that it correctly flagsptr_band ignoresptr_a. - Explain how this simple tracking approach can fail (e.g., when a pointer is passed to a helper function or reassigned).
- How does path sensitivity affect leak detection when a pointer is freed in one conditional branch (e.g., an
ifblock) but not another (e.g., anelseblock)?
Key People Index
- Manuel Klimek: Core LLVM contributor and software engineer. He is a key designer of modern compiler tools and pioneered many of Clang's automated refactoring tool APIs and matching frameworks.
- Dave Plummer (DavesGarage): Veteran operating system developer. He advocates for safe coding practices and demonstrates vulnerabilities in classic C runtime library APIs.
- Jacob Sorber: Computer science professor and researcher. He uses interactive code guides to teach memory management, Unix system APIs, and embedded systems programming.
Final Self-Assessment
Test your static analysis skills by completing this final self-assessment.
- Explain how stack memory frames are set up during function calls and torn down during returns.
- List four common unsafe C runtime library calls and provide their secure, size-bounded alternatives.
- Describe the phases of compiling C source into machine code, and explain where AST analysis fits in that pipeline.
- Successfully load Clang's python bindings (
clang.cindex) on your development machine. - Write a script that parses a C source file into an AST and prints each node's spelling along with its cursor type.
- Detect calls to unsafe functions like
strcpyby matching on ASTCALL_EXPRnodes. - Identify dynamic allocations in C by tracking assignments of
mallocreturn values to local variables. - Detect variable scopes where a pointer was initialized with
mallocbut never released withfree(). - Explain the differences, trade-offs, and design challenges of using static code analysis compared to dynamic runtime memory checks (like AddressSanitizer).