















![The Performance Price of Dynamic Memory in C++ - Ivica Bogosavljevic - [CppNow 2021]](https://i.ytimg.com/vi_webp/LC4jOs6z-ZI/maxresdefault.webp)


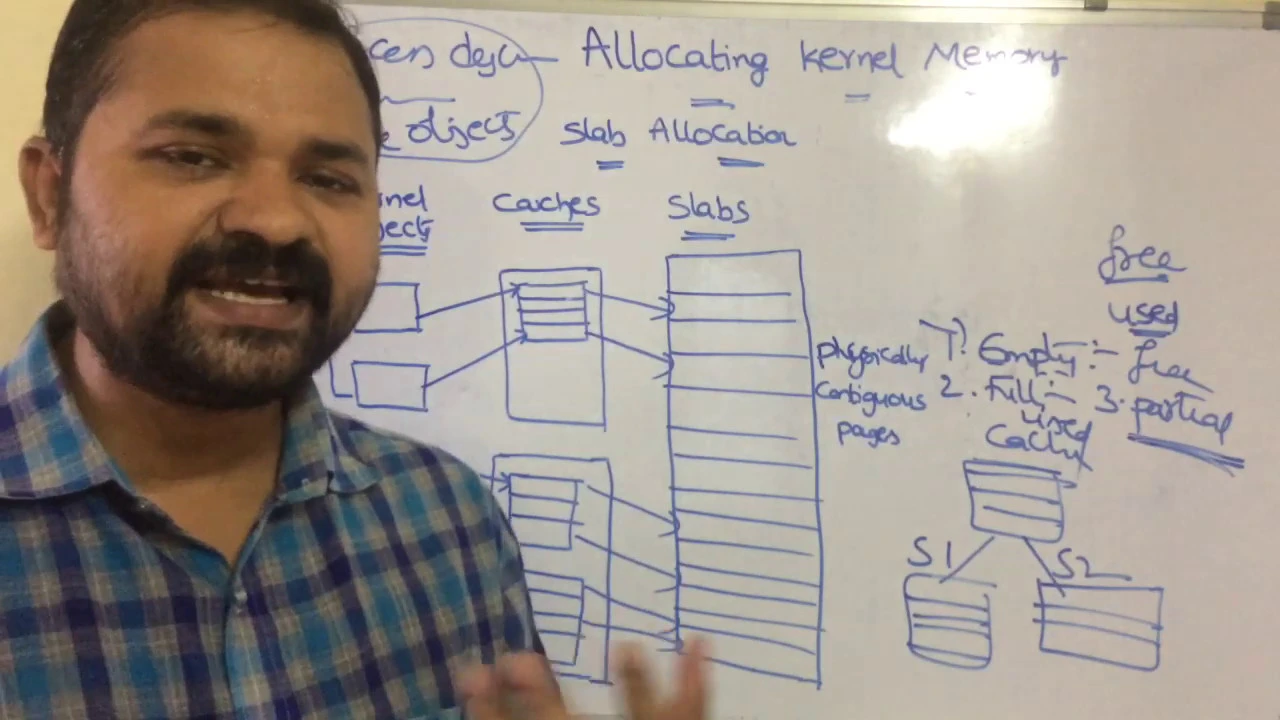
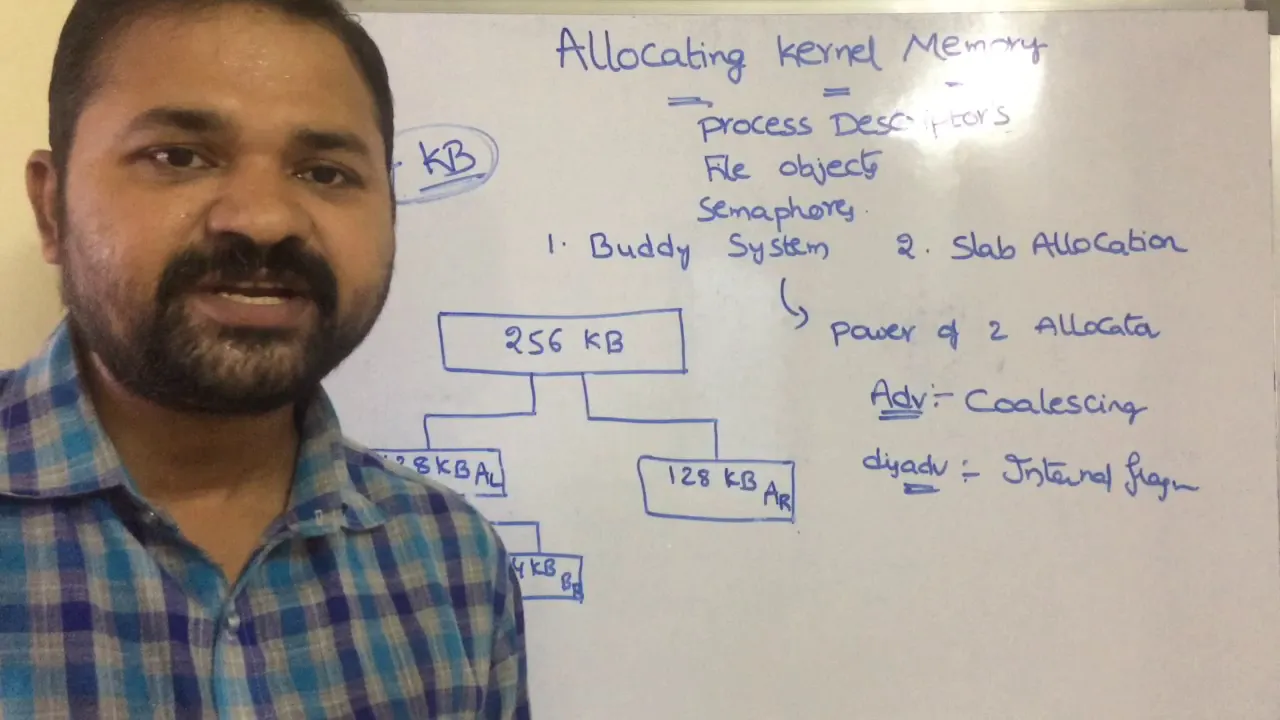

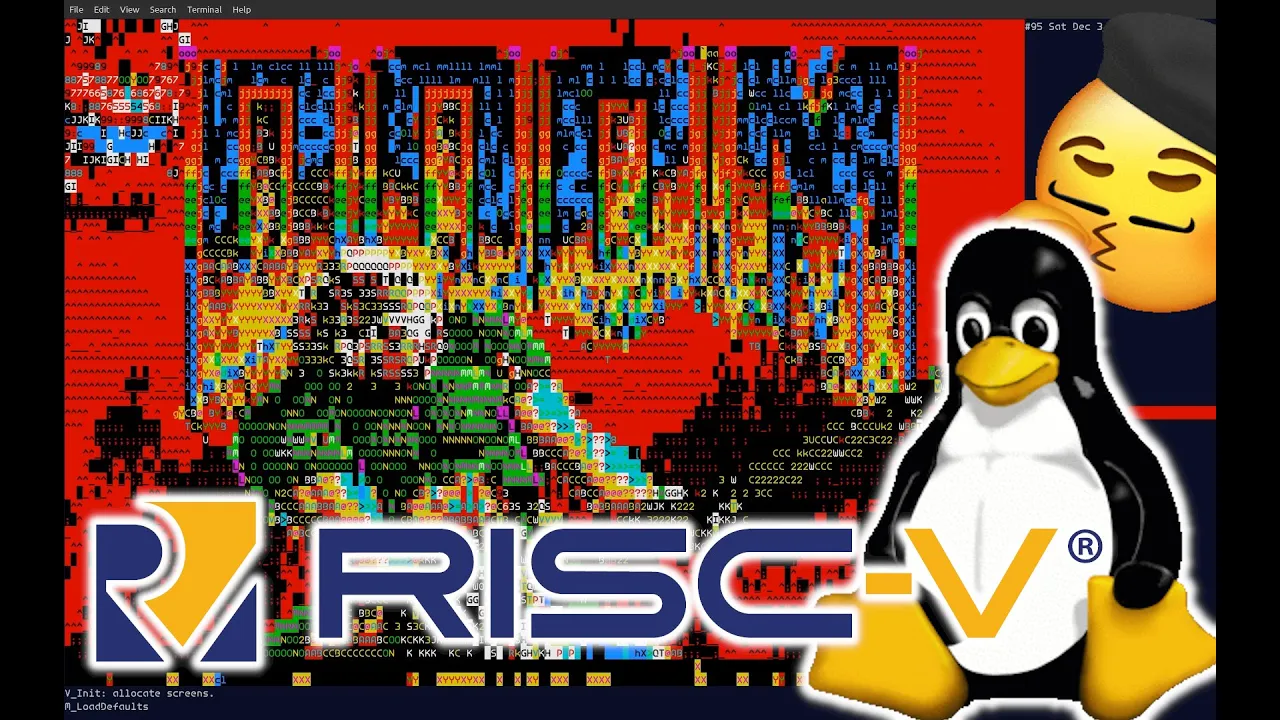

Memory allocators like malloc and free manage heap memory by tracking allocated blocks and their addresses, and by replacing the system allocator with a custom implementation that logs allocation and deallocation operations, we can visualize how memory is actually laid out in the heap, revealing patterns such as sequential allocation, fragmentation, and memory reuse that are otherwise invisible to programmers.
Visualizing the Heap: A Deep Dive into Memory Allocators
Added:Understanding of the program memory layout, specifically the structural differences and use cases of the Stack versus the Heap.
Familiarity with manual memory management in C/C++, particularly the basic mechanics of dynamic allocation using malloc() and free().
A foundational grasp of pointers, memory addresses, and pointer arithmetic in lower-level programming languages.
Conceptual awareness of how operating systems manage virtual memory and execute system calls like brk/sbrk or mmap to request memory pages.
Designing and implementing a custom memory allocator from scratch using structural patterns like implicit free lists, explicit free lists, or segregated fits.
Analyzing advanced, production-grade memory allocators designed for multi-threaded performance, such as jemalloc, tcmalloc, and dlmalloc.
Exploring memory compaction techniques, slab allocation, and the buddy allocation system to mitigate internal and external fragmentation.
Mastering memory profiling and debugging tools (such as Valgrind, AddressSanitizer, and GDB) to detect and resolve memory leaks, double-frees, and heap corruption.
40.7K views2Klikes21:38Original Release: 2022-06-07
today we're gonna try to pull back the curtain a bit on malik and see what it's actually doing under the hood because it's kind of interesting and occasionally weird [Music] hey welcome back everybody today we're looking at memory allocators again specifically today i thought it would be cool to make a tool for one of my classes that helps my students visualize like actually see what their allocator is doing so that's what we're going to do today but before i get into it i just want to say a big thank you to all of you who support this channel on patreon i couldn't do what i do without you you know who you are and you're awesome and i really appreciate it so thank you also if you're new patreons where you can get access to all the source code for my videos and my virtual office hours so if you're interested in that sort of thing that's where you can find it okay so back to memory because memory allocators are one of those things they're really cool they're really useful just about everybody uses them and a lot of people probably most people haven't really given much thought to how they actually work and maybe you're saying to yourself oh i understand malik and free are those friendly little functions that i i request memory and they give me back pointers and that's right but how do they work what do they actually do under the hood and also yes i know about calicon realic and if you're in c plus plus you've got new and delete and if you're working with other languages you have other layers on top of malik and free for simplicity today i'm going to focus on malik and free because that's typically the bottom where everything ends up anyway so that's what we're going to focus on for time and simplicity i don't want to like over complicate this i want to just focus on the basics and the problem i'm trying to address is just the new programmers basically get into this mode where they they request memory they're mallocking a bunch of bytes but they don't really think about where that memory actually is and how it got there and on the flip side maybe somebody like me drew something for you like this that shows you hey this is this is how memory is laid out for a particular process this graphic has shown up in a few of my videos and you know i've pointed out that there's a heap right there right above the code and your global variables but a long way below your stack so that's the heap but have you ever actually looked at the addresses that malik gives you and i'm sure that a few of you have but i'm guessing that most of you have not so today we're going to change that we're going to take a look at it and like i said earlier look is the key word i want to visualize what malek's doing so rather than just tell you what i'm going to do let's just jump into the code and take a look so for this example what we're going to do is we're going to replace malek and free now i've done this in previous videos for debug reasons today we're going to do it for visualization reasons so this allocator.c file right here is going to be my new allocator and let's just start off as we have in previous videos by creating a malloc function this is just like the systems malik as far as what it takes so it's going to take in a size t which is a size and it's going to return a void pointer and then we also need a free that doesn't return anything but we pass in a pointer that we want to free so that's a pointer that presumably is either null or it's one that we received from malik which could give us null but so these are going to become my new malik and free functions and i don't really want to recreate my own allocator here from scratch i just want to watch it so for now what we're going to do we're going to assume that for example malik has let's say some kind of function we'll call it sysmalic we're going to call that that's going to be the original malloc we're going to call that with our size and it's going to return a void pointer and then we're just going to return that result okay so we're just basically using our new malloc as a pass through because we just want to observe and we're going to do something very similar with free we're just going to call some kind of cyst free function with our pointer and that's going to call the system's free function now of course at this point sysmalic and cis free don't actually exist so let's move back up here to the top and let's let's make a couple first of all a couple of type defs so i'm going to type def a what i'm going to call malloc like function so malloc like function this is just gonna make my code a little more readable i've talked about type defining uh function pointers in the past but basically this is just going to be a new type which is a pointer to a function that looks like malloc one that takes a size underscore t and returns a void pointer okay and we'll do something very similar for free only it's not going to return anything and it's going to take a void pointer and now that we have these types let's come down here and define a malloc like function called sysmalic i'm going to set that to be null and we're going to do the same thing with free we want a free like function that's going to be cis free so the type defs here just make things a little more readable so now we have these functions we could call them but right now they're set to null so if we call them bad things are gonna happen just a word to the y's don't don't ever call a null function pointer things will definitely end badly so we need to initialize each of these pointers so we can actually use them now i could do this initialization down in malik and free every time like right here i could i could just use dl sim to go grab this but i'd rather not do that because it's going to be slow and it's also for other reasons because we're going to be actually recording our mallex and freeze it is going to be useful to only do our initialization once so what i'm going to do is come in here and make another variable here a boolean a boolean called init we'll start it out as false and then i'm going to come down here and make a function called init check and this function is going to be really simple all it's going to do is check to see if we have not initialized things and if we've not initialized them then i am going to now call dl sims i'm going to set sysmalic equal to cassette to a malik like function and i'm going to call dl sim i've used this in the past just it helps me grab a symbol from a dynamically loaded library in this case i'm going to say rtld next it's going to say don't get the first occurrence because that's actually the malik in this translation unit but get the next one so that's and i get the next one called malik okay so we're gonna do the same thing with free so sysfree and free and we want our free like function okay so this is going to grab the function pointers from lib c for malik and free and then after this i want to set init equals true so that means it's only going to do this the first time and then it's going to be true and after that this init check function will never do it again and then down here in malik i can just call a knit check and we'll do the same thing in free and so now we should be good to go okay so now this allocator should work if i compile a program with it but it's not going to really do anything interesting yet all it's going to do is to call the system allocator system alex system free and what i'd like to do differently is i'd like to actually create a log i want to produce a log of every malik and free operation that this allocator actually does and so i'm going to do this with a file now i could write this to standard out or standard error but i might want to compile this allocator with a program that has its own output someday and so in this case i want to use a file so it kind of gets out of the way so to make this happen let's come up here and let's create two new variables so this one i'm going to make it a file pointer also started out as null and let's also make a character pointer we'll call it log file name and i could find a more flexible way to do this i'm in this example just for simplicity today i'm going to hard code it and call this alex dot log now we can come down here in our init check and just a couple other things we want to do we want to say fp equals f open log file name or open it in write mode so this is going to be the file that we're going to write to and then once we have that file opened which that's going to happen at the beginning then we're going to come down here and we're simply just going to have an if an fprintf that's going to print to our open file handle and i'm going to print out an m for malik and then we're going to print out a couple of long unsigns l-u-l-u and then this is going to be the first one's going to be a un-ptrt i'm just casting this is going to be the actual address it's going to be the the numerical representation the integer representation of the result address that malek returns and then we're going to get the size okay so this is going to print out m comma the address in decimal and comma and then the size of the block and then we're going to do something similar to this in free down here we're going to instead of m we're going to say f for free and in this case i only want one of these and it's going to be the thing that we're trying to free so that's p okay okay so now at this point my allocator should do what i needed to do and that is specifically as i mentioned before that the point is to give you a log of all of our mallex and freeze and then i'm going to use another program to visualize what this actually looks like and you might be wondering why i'm using a different program why don't i just do it all in the same program and i could that would get a little tricky you know i could use something like gtk plus or n curses you've seen those in other videos of mine but those libraries they also call malik and free and that would make my visualizings a little bit messier because i would be visualizing what the visualization is doing as well as my own program and i really wanted to keep things simple today i want to keep things isolated so i want to handle these in separate processes but before i get to drawing let me just show you a couple different programs these are basically just test programs that i've produced that are going to create different patterns of allocation the first one is this batch alec okay so i've got a couple of got like a number of iterations and a batch size and i've got sizes i'm basically going to try to allocate blocks between 50 and 500 bytes and then all i'm going to do is i'm going to use sran to set up my random number generator and then what i'm going to do i've got a batch of pointers and i'm going to go through and each time i'm going to allocate a bunch of randomly sized blocks and then free them all okay so i'm going to allocate the blocks free them all just to make things interesting i'm freeing them in reverse order but i don't need to do that in fact maybe maybe to start off with we won't do them in reverse order we'll just keep them going straight that's fine so this we should see a bunch of blocks appear and then a bunch of blocks disappear and we'll see where malik puts them the next one i'm gonna look at is random alec so random alec is basically doing something similar except it's going to do random so it's in this case i've got a struct which is keeping track of each allocation that's a pointer to each block that i'm allocating and the size which i actually don't actually need i thought i was going to use that but end up not needing it so we've got our block and we've got whether it's valid or not which i could have just set it to null but anyway we're using a boolean at this point it's fine we're still allocating blocks between 50 and 500 and we're gonna go through this loop a bunch of times right this is just so i can see what happens over time and 500 is going to be the number of allocations that i have at one time so at any given time i could have as many as 500 allocations but i'm never going to go more than that so things shouldn't grow infinitely they should just basically i should have a certain size and then that should just fluctuate you know i'll see things be allocated or deallocated and so you see that here this function do lots of allocations all this is going to do is it makes an array of these structs that's not going to be on the heap that's going to be on the stack and initially we'll go through in this for loop and set up all of our objects to be false so no allocations we haven't allocated anything yet and then we're going to go through and our num iterations we're going to go through each of these and i'm going to pick a block okay so this r i d x i'm basically just saying pick me a random number between 0 and max objects minus 1. so that's going to be somewhere in this aleks array and then i'm also going to pick a random size this is going to be between min size and max size and then down here i'm going to check to see if the block i picked at random was valid then i'm going to free that block and set its valid flag to false and otherwise i'm going to malloc a block of random size i removed this because i don't really need the size but so the point is is initially we should do a lot of mallets because most of our blocks are going to be invalid but then later on we're going to start to have about a 50 50 shot of mallocking something or freeing something depending on what we've got in our array and then down here in main all i'm doing is initializing my random number generator and then calling this function so really nothing crazy there so that's number two number three my number three test function is this leaky alec dot c all it's going to do is initialize the random number generator there's a pattern forming here i am doing things randomly and then we're going to go through a bunch of iterations and call a leaky function and that leaky function basically all it's going to do is it's going to malloc three blocks and it's gonna free two of them okay so it forgets to free one of them and it's just gonna do this over and over again and that's a vestige of a previous example so up here just have a couple of constants so the constants are how many iterations at this point we're going to go through and do this 500 times but we could we could make it bigger like the others and we don't need a batch size anymore you can tell i copied this from the previous one so we've got our number of iterations and our max size and our min size also at this point i'll point out that i am using a make file the makefile is really straightforward it will just compile all of these different test programs with my allocator so this should look pretty straightforward it's pretty typical with what i use typically in my other videos so now at this point i should be able to come down and compile everything it looks like i've got a couple of warnings let's fix those really quick oops i messed this up in my attempt to figure this out nope i meant to put j right there thank you compiler for giving me that very helpful warning and then what is going on down here so this warning is in my leaky alec and this is basically just pointing out that uh that my free here i'm never doing anything with p2 i'm not really doing much with p1 and p3 but i am freeing them and so this would be a way to let me know but we're just going to ignore that warning for right now because it's going to be useful so yeah so now we have everything compiled we have our programs in place and if i come in here and i run my batch alec program you can see that it does in fact produce this alex.log so my allocator is working i get this big batch of basically malik address and size and then if we come down here you can see that we also free all of these blocks just in the same order that we allocated them and of course that's going to work for let's let's just look at the others really quick so if i run leaky alec you can see you get a different pattern so you're getting three malik's two freeze and they match up so you can see that i got you know these are my two frees and they do match up with these two blocks that i allocated and then if we come down here and look at random alec well you can see now something that surprise surprise is more random and is pretty much the way that i described it early on mostly malik's as we get going you do start to get more freeze mixed in and it gets way more balanced okay so great we've got these logs and we could look at these but that's not fun so let's actually draw what's going on here and to do this i've written a little program in ruby this is mapper.rb i'm using ruby because it was just faster for me to get it working i'm using the ruby 2d library which is super useful simplifies things a lot and this program basically is just going to take my log file it reads it in and then it draws the mallocs as colored rectangles and each of those rectangles then get removed when that block is freed now due to time i am not going to go through all this ruby code there's actually not that much of it so we could do that in a future video let me know if you're interested down in the comments and maybe we'll do a ruby video you know a little break from our normal c and c plus videos if there's sufficient interest but for today's video i really want to focus on these visualizations and actually look at what this produces so let's take a look let's say that i run my batch alec and then immediately after i'm going to run my mapper.rb and what this is going to do it's going to pop up this this animation and basically you're seeing yeah this block gets allocated and then it gets freed and so you can kind of see how this is how this is working um one thing you want to notice is that the colors are random just so that you can see the different blocks okay one thing i will point out also is that these blocks aren't right on top of each other there are little gaps that's probably because the allocator is saving a little bit of space and that space is going to help the allocator keep track of what's next and what sizes things are if we wanted to fully understand what's going on we'd have to look at the code we'll save that for another video but this shows us we can see the batch basically being allocated and then freed you do notice every once in a while we get something weird something gets placed someplace that we don't expect it not sequentially and so again we'd have to look at the code to figure out what exactly is going on but for the most part things are being laid out fairly sequentially and part of that is because we're allocating these big blocks and then we're freeing them all together so that kind of frees up the whole heap and so then we start back over and so it's going to start back at the beginning also note that usually when we talk about the heap we're talking about the heap growing up but for this animation i'm starting with the heap going down so basically at the top is when your small addresses are and then larger addresses are further down also each row here is a 4k page in memory okay so four kilobytes that's the typical size chunk of memory that we deal with on our modern computers and so in this case each row is a 4k page and so you can kind of get an idea for how many pages i'm using at any given time okay so let's close this out and let's try another one if i come in here and let's look at my leaky alec we can run that this is going to run very similarly or only you're seeing a different pattern right so in this case you're allocating three and freeing two but what you do see is as this thing grows basically it's going to grow forever because every time through this loop it's leaving a block that's leaked right it leaks a block and this just shows you sort of what happens with memory leaks is you're leaving stuff behind that forces the allocator to come in here and to like keep building on to where it left off and so now i'm using a lot more memory over time and if i run this long enough i will consume way too much memory and this will actually start to slow my machine down okay so let's go try our third one so if i come down here and i try my random alec now you're gonna see very similar except that now we are basically doing it randomly and so you're going to see at some point we're going to get to a particular size where we have a certain number of blocks and then we're just going to be randomly mallocking and freeing our blocks and so you just sort of see these popping in and out now you notice that the allocator is trying to put my new block request in the gaps that are left by free sometimes it can't fit right so we do end up with sort of this fragmentation happening where you get little gaps of memory of unused memory and you know that's just that's part of what this allocator is trying to do it's trying to be space efficient but it's also trying to be fast and so in the interest of time it's not always going to be able to take all the time to find the most perfect fit so it's going to do the best it can now one thing that's really interesting as we look at this as i've been playing with these and i don't know if it's going to do it with this example but occasionally i get kind of weird behaviors like you can see that the allocator is actually starting to leave some good sized blocks up here at the beginning and that's kind of strange i'm not sure why it's doing that probably a speed optimization but one thing that you will notice if you watch enough of these simulations occasionally is occasionally with this example the allocator just decides to go off and do its own thing and basically abandon its previously used memory and move on to pages that are further in the address space i'm going to let it run for a little bit and see if we can make this happen it's been running for quite a while also some of you may recognize this color scheme let me know down in the comments if you do but so right here you can see what i was talking about is right here is like something clicked in the allocator and it just decided you know what i don't want to keep reusing these pages i've been reusing and i'm going to start using further pages and it starts abandoning you see these blocks start to get removed as they're freed and when they're reallocated they're reallocated further down in memory i'm honestly not really sure why the allocator is doing this if anyone has any insights and maybe at some point we'll take a look in a future video and look at the actual code and see if we can answer this question it might be kind of interesting but for right now we're just gonna leave that as this is pretty weird so anyway i hope this helps you understand a little better what malik and free are doing under the hood if nothing else i hope it's just an interesting visualization and a thought about how you can visualize some things that otherwise maybe seem a little bit arcane a little bit opaque and a little mysterious as i mentioned before if we really wanted to understand what malek and free are doing under the hood we'd have to take a look at the code and try to understand what algorithms they're actually using and these algorithms may differ from one machine to the other you know i'm trying this out on my mac right now but if i were to move to linux or something else i might see totally different patterns so maybe we'll look at that in a future video but i hope you learned something new today if you did please consider liking this video or subscribing so you don't miss future content also if you really like the way i teach or the way that we do things on this channel consider checking out my online courses i currently have one that is course zero got some more that are in the works i've talked about course zero in past videos and basically it focuses on strategy its whole goal is to help you to go from beginner to expert or intermediate or much more seasoned developer who gets paid to do really great work in a short amount of time so really helping you acquire skills quickly and efficiently so you make the most of your time and effort so please check that out if it sounds useful to you and until next week i'll see you later
Up Next

89:06
Modern Linux C++ Debugging Tools: Internals & Usage | ACCU Talk
@Undo-io
1.7K views•2021-05-25
87:26
Introduction to Secure Multiparty Computation with Yehuda Lindell
@fhe_org
7.7K views•2021-02-04
7:41
Does C or C++ Have Automatic Memory Management GC? | Explained
@JacobSorber
38.3K views•2022-06-28

19:25
Enigma Machine Mechanics: WWII Encryption Explained
@JaredOwen
13.2M views•2021-12-11
Related Study Plans & Knowledge Roadmaps
Structured learning paths in Computer Science
computer-science
Container Runtimes: Namespaces, Cgroups & Go
01Linux Systems & Go Programming Foundations
02The Core of Isolation: Chroot and Filesystems
03Linux Namespaces: Process Isolation
+ 3 more learning modules
32h6 modules
Explore Roadmap
computer-science
Building a CHIP-8 Emulator: Rust & CPU Basics
01Computer Architecture Foundations (Bits & Bytes)
02Rust Programming for Systems Development
03CHIP-8 Virtual Hardware Specifications
+ 2 more learning modules
32h5 modules
Explore Roadmap
computer-science
Building BitTorrent: Go, P2P & Concurrency
01Go Fundamentals & Concurrency
02Networking Foundations & P2P Architecture
03Bencode Parsing & Torrent Metadata
+ 3 more learning modules
26h6 modules
Explore Roadmap
computer-science
Actor Models (C++ Concurrency & Lock-Free)
01C++ Multi-Threading Foundations
02Thread Pools and Task Scheduling
03Atomics and Lock-Free Queue Design
+ 3 more learning modules
45h6 modules
Explore Roadmap