Building a Rust Debugger: ptrace, ELF & DWARF
Learning Goal: Designing and implementing a command-line debugger from scratch in Rust using the Linux
ptracesystem call, ELF file parsing, and the DWARF debugging format to master low-level process control and binary instrumentation.
- Estimated Total Study Time: 38 Hours
- Prerequisites: Intermediate Rust familiarity (ownership, lifetimes, pattern matching) and basic Linux command-line/systems administration awareness.
Module 1: Systems Programming Foundations & Rust
This module establishes the foundational knowledge required for systems-level development. You will explore how Linux handles processes, transition from user mode to kernel mode via system calls, and examine how Rust serves as a safe, high-performance alternative to C for low-level tasks. Special emphasis is placed on introducing low-level crates like nix and managing resources without a garbage collector.
Recommended Videos

- Why this video: This crash course bridges the gap between high-level development and systems-level programming in Rust. It introduces the ownership model, lifetimes, and memory layouts—concepts crucial when handling unsafe operations, pointers, and manual memory adjustments during debugger operations.

- Why this video: This lecture unpacks the relationship between user applications and the Linux kernel. Understanding kernel boundaries, CPU rings, and syscall dispatching is essential before you write code that leverages
ptraceto intercept execution.
- Why this video: It clarifies what a process is from the operating system's point of view, covering memory sections (stack, heap, code segments) and state management. This structural context is critical when inspecting or altering target processes.
Knowledge Checkpoint
- Differentiate between a standard library function call (e.g., standard formatting) and a raw system call.
- Explain how the CPU switches privileges from ring 3 (User Space) to ring 0 (Kernel Space) using interrupts or syscall instructions.
- Write a simple Rust program that calls standard UNIX APIs via the safe abstraction layers of the
nixcrate instead of linking raw Clibcelements directly.
Module 2: Process Control and the Linux Ptrace API
In this module, you will master the ptrace (process trace) system call, the foundation of modern Linux debuggers. You will learn to establish parent-child relationships, launch child targets with tracing enabled, wait for state changes, and read or write memory bytes within another process's virtual address space.
Recommended Videos
- Why this video: A rare, highly practical guide showing how to interact with the raw
ptracesystem call directly from Rust. It walks through usingnix::sys::ptraceto trace execution and track basic signals.

- Why this video: Liz Rice provides an excellent mental model for structural tracing. While demonstrated in Go, the explanation of fork-exec dynamics, using
PTRACE_TRACEMEin the child before execution, and capturing process execution states in the parent is universally applicable to any language.
- Why this video: Greg Law offers a deep dive into Linux debugger internals. He covers how industrial-grade debuggers like GDB structure their main trace loops and manage child processes through
ptraceconfigurations.
Gap Mitigation: Using the nix Crate for Safe ptrace
To build a debugger in Rust, you should avoid unsafe direct system calls by using the nix crate's ptrace module (nix::sys::ptrace and nix::sys::wait). The pattern involves:
- Forking the process with
fork(). - In the child process: execute
ptrace::traceme()followed by anexecvariant to load the target program. - In the parent process: monitor execution using
waitpid(...).
Knowledge Checkpoint
- Explain why the child must execute
PTRACE_TRACEMEbefore loading the target binary withexecve. - Implement a safe
forkin Rust where the parent waits for the child to stop usingnix::sys::wait::waitpid. - Describe the difference between
PTRACE_CONT,PTRACE_SINGLESTEP, andPTRACE_PEEKDATA.
Module 3: Software Breakpoints and CPU Registers
This module covers the core mechanics of software breakpoints. You will learn how to intercept execution by modifying the target process's memory. This involves replacing a valid CPU instruction with the x86-64 trap byte 0xCC (the INT 3 instruction), catching the resulting SIGTRAP, reading and updating the instruction pointer (RIP) register to point to the original location, restoring the original byte, and single-stepping to resume normal execution.
Recommended Videos
- Why this video: This video explains how x86 architectures handle interrupts, focusing on the
INT 3instruction (opcode0xCC). It explains why this specific 1-byte opcode is used for software breakpoints rather than multi-byte traps.
- Why this video: A direct, step-by-step look at manipulating virtual addresses and reading register values in Rust. It shows how to query the CPU's register states inside an active process context.
- Why this video: This practical demonstration shows how debuggers patch active program memory on the fly with a trap instruction. It provides code-adjacent context on modifying running binaries.
Gap Mitigation: Register Manipulation in Rust with nix
To modify thread registers (specifically the Instruction Pointer RIP) after hitting an INT 3 breakpoint:
- Use
ptrace::getregs(pid)to retrieve a struct of target register values. - When an
INT 3is triggered, the CPU executes0xCCand incrementsRIPtobreakpoint_address + 1. - To resume execution properly, update the register struct by subtracting 1 from
regs.rip. - Restore the original instruction byte at
breakpoint_addressusingptrace::write. - Call
ptrace::setregs(pid, ®s)to write the updated register state back to the CPU. - Single-step using
ptrace::step(pid)to execute the original instruction, re-apply the breakpoint, and then callptrace::contto resume execution.
// Conceptual snippet using nix to backup RIP register let mut regs = ptrace::getregs(child_pid).expect("Failed to get registers"); regs.rip -= 1; // Backstep RIP to point at the original instruction address ptrace::setregs(child_pid, regs).expect("Failed to set registers");
Knowledge Checkpoint
- Explain why the instruction pointer
RIPis incremented by 1 byte after hit-testing anINT 3instruction. - Implement a function that reads 8 bytes from a virtual address, replaces the first byte with
0xCC, writes the patched value back, and stores the original byte for restoration. - Describe the sequence of steps needed to execute the original instruction at a breakpoint without missing future hits of that same breakpoint.
Module 4: ELF Layout: Inside Linux Executables
Before automating address lookup, you must understand the file layout of Linux executables. This module covers the structure of the Executable and Linkable Format (ELF), explaining headers, program segment views used by the OS loader, and section table views used by linkers and compilers. You will learn to use the goblin crate to parse headers, symbol tables, and section offsets.
Recommended Videos
- Why this video: An excellent overview of the structural layout of ELF binaries. It breaks down the ELF header, magic numbers, entry points, and the distinct roles of Program Headers versus Section Headers.
- Why this video: This video provides a detailed look at the 64-byte structural header and how tools read the layout of the binary. This is helpful context for implementing programmatic parsers.

- Why this video: The hosts discuss the design and history of critical low-level Rust libraries, highlighting the
goblincrate for ELF parsing andgimlifor DWARF management. This provides valuable architectural context on how these crates solve parsing complexities.
Gap Mitigation: Programmatic ELF Parsing in Rust
To read symbolic debugging targets natively, write a helper file to parse ELF files using the goblin crate.
use std::fs::File; use std::io::Read; use std::path::Path;
pub fn find_elf_symbols(path: &Path) -> Result<(), goblin::error::Error> { let mut buffer = Vec::new(); File::open(path)?.read_to_end(&mut buffer)?;
// Parse target binary buffer
let elf = goblin::elf::Elf::parse(&buffer)?;

// Iterate over the symtab (Symbol Table)
for sym in elf.syms.iter() {
    let name = elf.strtab.get_at(sym.st_name).unwrap_or("<unknown>");
    if sym.is_function() {
        println!("Function: {} at address {:#x}", name, sym.st_value);
    }
}
Ok(())
}
Knowledge Checkpoint
- Explain the difference between Program Headers (Segments) and Section Headers in an ELF binary. Which one is used by the operating system kernel to load a process?
- Find the purpose of the
.strtaband.symtabsections in an ELF file. - Write a Rust function using
goblinthat opens a local file, reads its header, and returns the entry point address.
Module 5: DWARF Debugging Metadata Demystified
This module introduces DWARF, the debugging format that maps raw instruction addresses to source code files, line numbers, and variable names. You will study DWARF concepts such as Debugging Information Entries (DIEs), Compilation Units (CUs), and the DWARF state machine (Line Table). You will learn how to extract this information using the gimli crate in Rust.
Recommended Videos
- Why this video: This video introduces DWARF5 structures, discussing how compile-time definitions translate to binary schemas that capture function layouts, parameter scopes, and source-to-instruction mapping.
- Why this video: This video explains how GDB uses DWARF payloads inside an ELF binary to reconstruct stacks, identify variables, and resolve execution lines.
Gap Mitigation: Using the gimli Crate to Parse DWARF
Because online video tutorials on the gimli crate are rare, here is the standard pipeline to query a source line using gimli:
- Use
goblinor direct file-io to load sections like.debug_info,.debug_line,.debug_abbrev, and.debug_str. - Wrap raw section data using
gimli::EndianSlice. - Locate the Compilation Unit (CU) headers inside
.debug_info. - Parse the associated line table program inside
.debug_line. - Run the line table state machine to generate mapping rows containing
(Address, File, Line, Column).
// Pseudo-architecture pattern for querying line info via Gimli // 1. Load DWARF payload: let mut file = File::open(path)?; let mmap = unsafe { memmap2::Mmap::map(&file)? }; let dwarf = gimli::Dwarf::load(|id| { // Read corresponding elf section matching gimli section name IDs Ok::<_, std::io::Error>(gimli::EndianSlice::new(&mmap[section_range], gimli::RunTimeEndian::Little)) })?;
// 2. Iterate through compilation units and evaluate their line programs
Knowledge Checkpoint
- Define what a DIE (Debugging Information Entry) is and explain how trees of DIEs represent functions, scopes, and local variable declarations.
- Describe how the DWARF Line Table state machine compacts address-to-line pairs to save binary space.
- Write down the names of at least three specific debug sections required to translate an instruction pointer (RIP) address into a source line string.
Module 6: Assembling the Command-Line Debugger in Rust
In this final module, you will bring all the components together. You will build an interactive Read-Eval-Print Loop (REPL) using safe Rust abstractions, and implement debugger commands like break, continue, step, and register. You will combine the ptrace execution loop, register modifications, goblin ELF symbols, and gimli line tables into a fully functional CLI tool.
Recommended Videos
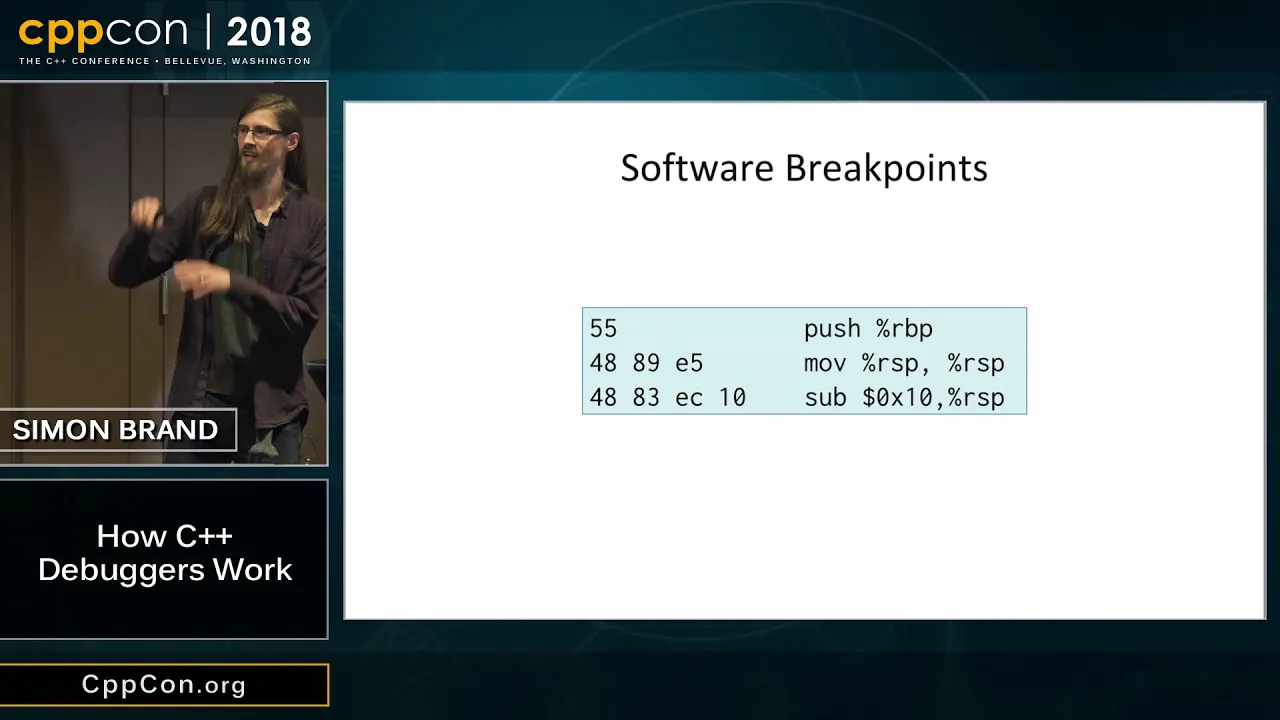
- Why this video: A comprehensive guide on structuring a debugger. Simon Brand explains the integration of DWARF engines, breakpoint managers, and the OS ptrace handler into a single, cohesive application architecture.

- Why this video: This code-along style presentation demonstrates how to structure the core execution loops of a custom debugger, illustrating how to handle user commands while managing child process states.
![C Tutorial \| Write your own Shell [Incomplete, Part II not available right now!]](https://i.ytimg.com/vi_webp/QUCSyDFPbOI/maxresdefault.webp)
- Why this video: This video breaks down how to construct a robust REPL (Read-Evaluate-Print Loop), manage user standard input strings, and parse command tokens.
Knowledge Checkpoint
- Draw the architectural boundary separating user REPL input, debug symbol engines (ELF/DWARF), and child thread state managers.
- Implement the
continueflow: disable the active breakpoint at the current RIP, single-step the target process to clear the original instruction, re-enable the breakpoint, and then resume execution. - Build a functioning interactive command line in Rust that successfully handles input options like
register dump,break <addr>, andcontinue.
Course Map
Key People Index
- Liz Rice (Author & open-source speaker): Known for explaining operating system containers, namespaces, and systems programming principles by building tools from scratch.
- Greg Law (Co-founder of Undo): A specialist in reverse-execution technology and Linux process inspection who frequently presents on debugger mechanics.
- Simon Brand (Compiler Engineer): Renowned for writing comprehensive, step-by-step guides and giving conference talks on the inner workings of compiler formats and debugger state machines.
Final Self-Assessment
Complete this checklist to verify your debugger meets all functional requirements:
- Process Launching: The debugger can spawn a child target with
PTRACE_TRACEMEenabled and halt before execution starts. - Address-Based Breakpoints: Users can set a breakpoint at a specific hexadecimal virtual memory address.
- Memory Patching: The engine successfully overwrites target instruction bytes with
0xCCand restores the original instructions when requested. - Register Access: The debugger can read and output all user-space CPU registers (including
RIP,RSP,RAX) usingnix::sys::ptrace::getregs. - RIP Recovery: When hitting a breakpoint, the instruction pointer is rolled back by 1 byte, allowing the original execution state to be restored.
- Symbol Resolution: The debugger reads the executable's ELF symbol table via
goblinand lists public functions alongside their virtual memory offsets. - Line-Number Mapping: Using the
gimlicrate, the debugger translates the current instruction pointer (RIP) to a file name and line number. - The REPL Loop: The interface processes user inputs like
continue,step, andbreakwithout crashing or dropping process control. - Resource Cleanup: The debugger handles child exits gracefully, checking exit codes without leaving zombie processes.