














![Anti-Flag [easy]: HackTheBox Reversing Challenge (binary patching with ghidra + pwntools)](https://i.ytimg.com/vi/L-P5mfkyzeo/maxresdefault.jpg)
![[치트엔진 특집]치트엔진/게임핵 개발 하는데 리버싱 기초가 왜 필요한가요!](https://i.ytimg.com/vi_webp/1R_XJh4zXxU/maxresdefault.webp)
Debuggers work by intercepting process execution through the ptrace system call, which allows one process to manipulate or monitor another. Software breakpoints are implemented by replacing target instructions with the INT3 (0xCC) instruction, which triggers a breakpoint exception when executed. Hardware breakpoints use debug registers (DR0-DR3) that can monitor specific memory addresses for reads, writes, or executions, providing more efficient breakpoint handling than software methods. Single-stepping works by setting the trap flag (TF) in the eflags register, causing the CPU to generate a debug interrupt after each instruction.
Writing a Linux Debugger in Rust: Ptrace, Breakpoints & More
Added:Intermediate Rust programming, particularly handling system calls, unsafe blocks, and foreign function interfaces (FFI) for interacting with C APIs.
Linux process mechanics, including parent-child process relationships, system calls, and UNIX signal handling (specifically SIGTRAP).
x86_64 CPU architecture fundamentals, particularly the role of CPU registers (like RIP), instruction execution, and software interrupt instructions (such as INT 3).
Parsing DWARF debug info to map raw memory addresses to high-level source code locations, variables, and data structures.
Handling multi-threaded debugging, including tracking thread lifecycles and managing debugger states across concurrent execution flows.
Implementing the GDB Remote Serial Protocol (RSP) to make your custom debugger compatible with standard frontends like VS Code or GDB.
Studying anti-debugging techniques (such as ptrace detection or timing checks) and reverse engineering practices.
10K views200likes36:40Original Release: 2018-01-26
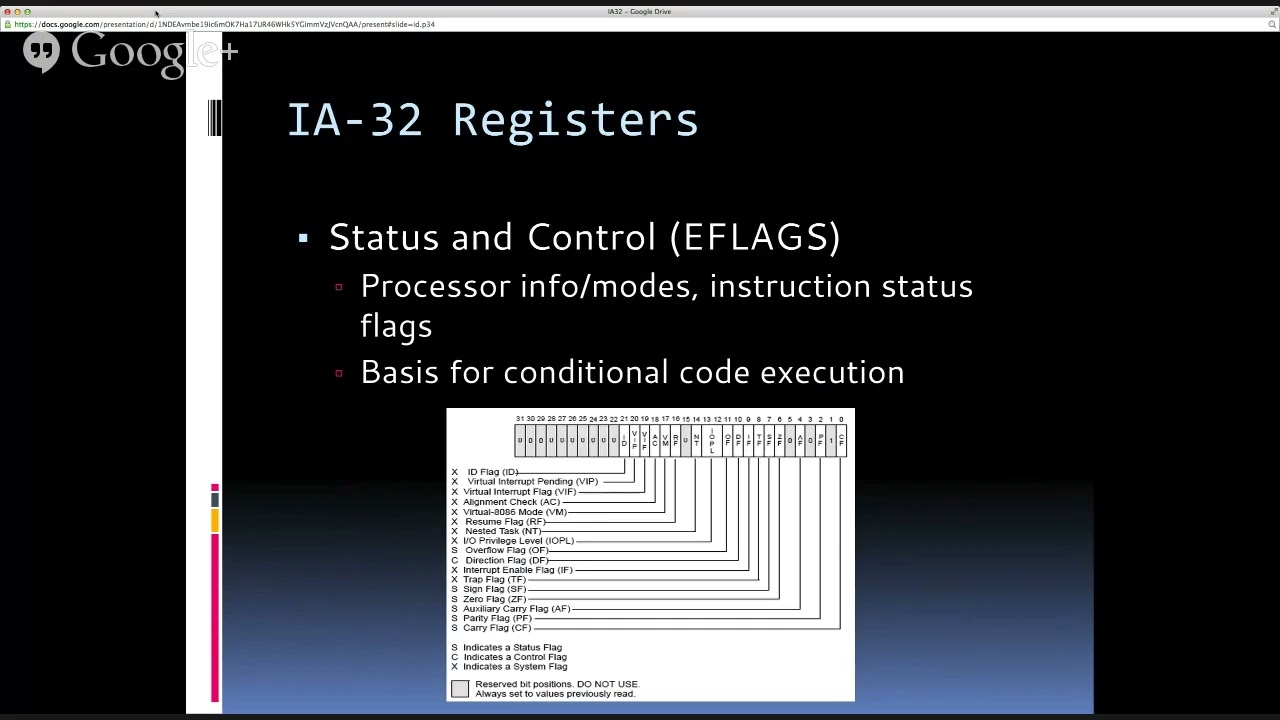
so first before we get get started with this session quick quick announcement so tomorrow there are still six session chair slots sorry three sessions chair slots there's two talks in each slot open if you'd like to chair a session it's literally just what I'm doing now you stand up here say some stuff introduce the speaker and then sit down it's it's not that hard and it's a nice way to get some practice standing up in front of people and talking to sign up to those go to the conference schedule and there's a little button that says about volunteer just click on that so yeah if anyone's interested in doing that that would be greatly appreciated by the organizers moving along live is a system software engineer currently studying at the Imperial College London and previously interning at Apple and Red Hat he's going to take us through the features of the limits of Linux and computing hardware that allows two buggers to do their jobs with let's write a debugger please make my floor welcome thank you [Applause] hello my name is Lev this is not my full name but this is what people call me and that's what I prefer so there's a few few sentences about me I'm a final year undergrad student at Imperial College London in the UK that's a 22-hour flight away previously I've worked at Apple and that Red Hat mostly working on operating systems and low-level performance engineering that sort of thing I usually write code in C Haskell she's my pet I just love how score it's a beautiful language recently I started writing in rust and this debugger that we're writing doing this talk will also be written in rust Hey yes gone like I exist I wanted some excitement oh it was so sometimes write and go but I'm not that excited about go so before we started to be really good thing to go over the history of debuggers we'll find out it's very closely tied with computers in general who's familiar with tx0 at MIT raise your hands so it's a it's a big single user machine it was one of the first computers and the way it usually worked so the way you usually develop programs for this tx0 machine is that you've wrote some program you loaded the assembler program into T x0 and then assembled your and assemble your program give you in order to pick another punch card which then you insert it into T x0 and then I executed your program and then at that point your program breaks and that's what and then you repeat this process and this is obviously very time-consuming and C people didn't like that and so what they did is they learned it a little program on top of the RAM or the memory at that time and which was able to single step through instructions and exam I memory modify registers basically what debunkers through these days at the same time however they were batch processing machines which is a different type of machine you have all these little punch cards tied together and then you gave that it's that little deck to someone an operator who then gave you back the results later today or the next day depending on when the computer was executed so the way you debug these machines is because you didn't have access to a computer directly is that you put macro calls that give you snapshots which are basically just a dump of all the registers in the computer or you call the nother macro that would give you a core dump which is basically just the entire memory you dump it dumped in time memory to some paper and then once the program crash you would be able to figure out why and how it crashed based on Clues left in the memory and all that sort of stuff also you can you could have looked at the registers then a few years later computing resources have become stronger and stronger and that was a new operating system called CTS S which is the compatible time sharing system where multiple users could log in simultaneously and do their work at that point however people realize that hey we can do something better than previous debugging is that you could have printf debugging which I assume everyone everyone here has used you put a statement it gives you some clues about what's happening for instance you could see here it's kind of will be ass what's gonna happen you're gonna get a sec hold on line three and that's how you can bisect basically where you co crashed and why that's also very important so that this this became a nice cycle of you you you write your program it crashes you had a printf you figure out it it crashed earlier you and another one and another one and then eventually find a particular line that was offending and this was very effective and there Kim UNIX which we all love for hate it had a debugger cool DB and GNU had the debugger called gdb which should be very familiar and it also had a debugger called ll DB which is nowadays mostly a Mac systems plan 9 had a DB which is another debugger to basically all similar debuggers and they all look similar to gdb these days which is what I use most of the time if I'm not printf debugging so for the history behind us let's talk a little about how do we trace a process how do we go ahead and start debugging so let's let's go with that so this is the system call P trace who's familiar with this system call oh that's incredible that's much more than I expected so basically yeah it's a system could follow so if you're not aware this is a system call you can give requests and a target pressure society and that particular process can be manipulated or information can be requested about that particular process most of the buggers heavily rely on this because it's it's it's a portable way between different architectures so same goodness it's meant to work on x86 will also probably work on arm or other architectures small cave yets of course but before we go into P trace it's a little important to decide how signals work and how they are triggered because it's signals are very important when it comes to P trace in this particular example we have a and B it's a typical example of a division zero basically what happens is that division is series of noticed by the CPU the CPU race is a divided error which is a internal state and eventually it calls a inte replied which calls into the kernel the kernel does a lot of magic figure that what happened who did the problem who was the offending process and then sends us again P which is the signal for zero division by zero at that point your signal handle will be called if you're lucky if it's a sick kill that was sent to you then it's not gonna be gold you're you're thrown out of everything and that signals are very important to P trace a but that will start a little implicit ting and let me show you what the the final product will be is this readable but do you need a larger font Pacific oh I wish I could do something about that so this is the debugger we'll be using this is what the final product will look like you can similarly as in gdb you would start a process just like that if I press a G's gonna tell you all the features it supports for instance what we can do is step through it goes to show that it has like this assembly shows the current instruction pointer which is a IP it also shows the stack pointer or SB and a frame pointer which is our BP we can also continue it to an X system call and it is basically like a strace it tells you that a book system called 12:00 with that particular result and a dead system for 21 with that particular result now we have breakpoints of course we also implement breakpoints with LSB you can see that there are no breakpoints set yet and then of course it B we can go add an input and type in an address to set a breakpoint and of course press C to continue now we can see that would see it executed some part of the code and they hit a breakpoint at that address now if I press hard it gives you me a dump of all the registers and if I know that it has to D is 32 plus 40 that would be 36 so if I press Continue now it will ask me to make a guess this is a simple guessing game it literally you just it gets a random number and then you type that if I'm a little bit against another game if I type in 2d which is 36 plus third first 32 plus something I can't count D is B is a bees 11 C is 12 13 so that's 32 plus 13 is 45 and that is the correct number so it works you could you were able to look at all the registers get a little debugger I'll get a little disassembly and this is what we're gonna build during this talk well we'll build the important parts at least because all the boilerplate I've written that previously yeah so yeah let's start with tracing so before before we want to trace the process the process has to tell us that hey I want to be traced like I want to be you know monitored and there's there's of course a P trace request for that which is traced me if you invoke P trace trace to me then oops and it will tell the chrome over hey it's okay for me it's okay that if another process comes along it can read my registers in my memory or even modify it so let's get to the curved fingers cross it works so that is very simple and this is Ross Garrett who's family little bit rust I am very very enthusiastic for rust so it basically issues at Peter's request from the process that hey it's okay for me to be traced and yeah so but naturally as a question arises like how am I going to get a process to invoke the system call right well it turns out that Linux has a nice system called Fork where you create a new process and then you you can execute a few system calls before you do something else so once we forked we'll be able to go and invoke a system call so we can just do beep trace trace me if I could type that would be useful and that will be that will tell the colonel that hey this new processes to be traced if you go down we do some magic with like set up the environment variables the arguments and all that sort of things that we don't care about right now and then we execute the program that we were given in this particular line is this slide readable it's got like I think I think my highlight matches this room pretty well that's not meant to be like that but whatever so excuse that program so at that point the colonel knows that this process can be traced and this is now running that particular program which is the in this particular example to gas the game alright so let's try what happens if we if we do that ok so it attached successfully nothing crashed we're good for now what if I heard a single step oh well it's not implemented yet so let's go ahead and do that so I mentioned run until system call because that something Petrie's can do and that's how i've strace is implemented i am not really going to go through implementing this particular thing as it's very complicated and involves the state machine which i think would be pretty boring oh the dist:22 sister core requests here please - this call is basically hey well until the next system call entry or exit and that's how you can get the P trace you can figure out what system call is invoked and then get its result back and that's how I stretched on the other end there are there sis mu which is runnin to the next system call but do not execute that system call so let's the let's the debugger emulate that particular system call which is handy for a number of for instance qme usually road and and other other pieces of software the next thing we're gonna implement is a register dump to be able to look at all the registers and for that there is a number of very useful petrus requests one of them is the peak user and poke user which lets you look at one particular register and modify that particular register and then you have get rags and set arrays which is get me all the registers and AH you can do whatever you want with them and then we sat down with cent registers so the way that works as we go here this is the this is just an input state machine it's not the most ideal at all but we want to get the registers so that is very easy create a new variable called registers we get the program and then we get the user's struct which is what you know wait what get regs returns you it returns you a user stroke which contains all the registers I don't know why it's called user struct but that's what it is and then from that week is there's a stop structure that has all the registers and very handily I have a list of that I this is just accidentally my bin you know every single time I have to do something with registers this is always in it most of the time so now if I compile I will be able to do oops yeah that's exactly that's that works so if we if we do registers we will be able to see a dump of registers which is very handy you have all the all the registers from 64-bit x86 and even the segment registers and everything that you could get eflags as well which is the extended flag register that's where all the flags are so at this point we still count single step right that doesn't work of course so let's go back and let's go implement single stepping arguably there is a PT request for that it's very handy you do Petrey single step it's literally just that what let's were hi but you need to implement so if I go area this is where we panic before in this particular line if I delete that and a comment then I can do P trace single step self that target PID because the prototype of Petrus is you have to give it the prayer Society so first you have to give it the request but that request is obstructed away with my Petrus library which is literally just a few lines like it's very simple so that works if I compile it and at that point we should be able to single step and yeah that works cool nothing crashed so far that is awesome you can see that so you can see that there's this assembly but I this assembly is provided by a different library it's not a trivial thing to do and I will not go with that just just assume that that's a nice thing yeah so you can now get all the registers do a single step egg and whatever you want so next next thing would be yeah breakpoints that is a very important thing oh yeah sorry so before we go over that we have we have like petition for us to manipulate memory which is what we will need for breakpoints so you have peek and poke text which basically means like hey multiply this particular word in the in the text section of the growing executable program and peak data that does the same by with the data section now there's a differences on Linux at least there is no different address spaces so everything is in the same address space text and data so these two two requests they all do the same we respect to peek text and peek data and poke text and poked a that they all do the same except peek is to read one and poke is the right one of course so we've seen a little about P trace but we don't really know how it's working right so it's very easy to just pass everything on to the operating system and then like do its work what's interesting though at least to me is how works and we're gonna start with our little friend PJ single-step oh is that my cursor there it's not longer there so when X is 6 there exists this beautiful register called eflags which is the flag register has all the bits and has left different like flags in it and we have one particular flag TF which is the trace flag or the trap flag depending on which literature you're reading and yeah trap flag or sometimes referred to as trace flag and basically this is what it does after each instruction it starts in it it goes into an interrupt that's a debug interrupt the curl got some magic and and eventually sends a sick trap to that process and that is then delivered to the debugger by a weight event and debugger can do whatever it wants for instance continue simple stepping to the next instruction so basically how single stopping works is you've got your process sets a flag in the in the e flags register and after every instruction it stops and then a signal is delivered to the to the process now let's talk a little about breakpoints which is what we'll be implementing next there multiple ways to implement breakpoints one of them that people did before was the beauty to instruction which is guaranteed to be a undefined instruction on x86 now the problem with this is that it's 2 bytes so it's little difficult to replace two bytes at one point it also triggers the undefined instruction exception instead of a nicer instruction nicer interrupts sooner is a better way of doing this which is the third interrupt which triggers the breakpoint exception and the mission covered for interrupt for the third interrupt is the 0x CC which is one byte it's always easy to modify one byte in most cases except in some other cases but we don't care about that so yeah with that being said this is the fury of how you would do how you would implement a breakpoint I give an address you get to by the dead address you replace it with the machine code for in the third interrupt which is zero x CC you take note of the previous instructions eventually you have to restore that right when the breakpoint is hit you replace it with the original but and then you try and try executing the instruction again I'll know the banner you could you could probably use UT 2 but it's a lot more complex and here we're gonna be using interrupts 3 so let's go and implement that first of all let's close this to speed so basically what happens is when you only I could type ok my contact but when you so this is how it works when you type in B and we get a address from it this is not probably not the best way to do it but this is what I could come up with at this time and we call a function called set breakpoint which is implemented here and yeah of course it sounds currently it's not implemented so let's delete that comment and basically let's go and I'm committed so as the site said the first thing you have to do is look at that buy that was there so let's just save that which is a byte and there's a handy function that I've written which uses the P trace peak user peak text to get a buy from a location this does some magic with like this awesome bitwise magic that we don't necessarily need but the idea is that it gets that byte and everything is everyone is happy so now we have the original by what we need to do is go there and bright 0 XC c to trigger an interrupt so there's another handy function poked by that which is location and I'm right 0 XE C now of course we're good programmers so we put a comment at 0 x CC is the machine code for three in my comments right we like comment here we go so that means at this point we have we have saved the original bite and I modified that instruction to be the third interrupt so at that point if the CPU executes that instruction it will trap into an error handler and send a signal to the process so the only thing we need to do now is to save the previous data so we created we have a vector and we put in a new data which is literally just the address is the location and the original byte is the original but so we saved that data put it into a list structure so that later we can retrieve it that's fine now we can set breakpoints but their report problem is that we still need to handle them and of course there's a function that I've written that is cold when a it's been a breakpoint is hit and what we do here is basically just we have to loop through all the all the breakpoints and find that particular breakpoint that was triggered hmm and then we do breakpoint you get so we loop through all the breakpoints we have to get that particular breakpoint and that is that breakpoints the clue Anika's I'm too lazy to figure out all the references so if VP that if the address over the breakpoint triggers is the same as the instruction that triggered a breakpoint then that means we have a breakpoint hit which is great so at that time we what we have to do basically is to replace the Basu HCC that was written to trigger is interrupt with the original value which is of course handily stored in that particular breakpoint structure now there is a problem so the CPU has is has completely finished executing that instruction which trigger to interrupt but the next instruction is corrupted because we replaced only one bytes we didn't place the entire thing so we have to tell the cpu to go back one press one instruction and execute that instruction that was originally there so the way we do that as we have the user structure that I handily copied here and inside that said the registers to be the register minus one because we we exhibited one byte of instructions before we have to go back to that to try that instruction again and that is handily done by a drink write it back to the curl now of course if something bad happens you put like an oops something bad happened and if we run that at that point everything's happy sweet so now we can put a breakpoint as previously we did it and if you see oh yes oh no something didn't quite work oh yeah you're right thank you sweet try again that is an address I memorized by the way if you haven't yet nerdist and the only significance of that is that you can dump the registers and then see here the actual value that was randomly generated so we calculate again 3 times 16 plus 11 that's 59 so if you continue then we can make a guess while it's now 58 why it's not 60 it's gonna be 59 so we can use our debugger to look at all the registers to breakpoints that sort of stuff yeah so that is cool we can implement our breakpoints so there are other ways of implementing breakpoints this is this is good battery called a software breakpoint there is another class of breakpoints called hardware breakpoints which we will cover on this slide so there's there's a set of registers called the debug registers on x86 which let you do a lot of magic with linear addresses so in one and two and three you can put addresses in it particularly near addresses which can be whatever they can be virtual memory or physical memory depending on how you set it up and the idea idea is that you can then tell the CPU - hey look at these addresses and mach notify me if something changes or something happens to those addresses there is a register called er 6 which is the debug control register it's a it's a it's a register where you can set bit masks to control what should happen and when depending on the values in tr02 the are 3 so for instance you can set the hey tell me that someone read that address which is how watch points are implemented you can you can tell it - hey tell me if something wrote to that address or if someone has to execute an address or you can tie to monitor 1 2 4 or 8 bytes depending on what you want there's a debug status so this register is used to when when you have an interrupt to figure out which address caused that particular problem it might be one drink so we have VR 0 2 3 6 & 7 what happened to 4 & 5 any guesses it was live not much it's just deprecated obsolete aliases unfortunately but that's that's that's what happens to them there's historical reasons we're not gonna cover that it's mostly just a naming problem so with that being said that is that is most of what I had to say I am very happy to take questions if there's anything thank you you have any questions yeah yeah well yeah you can single step and then once you tapped over that instruction oh yeah so the question was whether you can write when you when I show you you consume a big point whether you can have a recurring breakpoint that is automatically inserted yes you can the the way I would do it is you set up a single point right after you execute that the original instruction and off right after the instruction use you set back the breakpoint which is something you can do if you want but in this in this particular example I didn't implement that it's just a one-off break word there was another question somewhere oh yeah so the question was better debug registers are available from user space no they are protected resource only the kernel can modify them I mean the reason behind it so you can put any address in it so you could technically put a criminal address in it and then you know that's not ideal so the way that happens is that you can I go back a little you can see it's a lot faster this way so there's this poke user somewhere big user that's the only way you can modify those debug registers and the kernel actually does like sanity checking then are you allowed to do that if not you are killed if you are allowed then it's fine and everything is happy yeah yeah sir question was whether if I put the zero xcc at the broom at the wrong location it depends probably yes so you always want to aim to put it at the very beginning of the instruction so the address I memorized was was an address like that modern debuggers they have mechanisms of avoiding that like they actually understand machine code I don't nor the you know does this path debug or does it but in a modern debuggers you can actually prevent that from happening also another another most of times even you set a breakpoint you set it by in a file and then line number so that is extracted from barf which is a format for debugging debug information which I didn't cover in this form because that is a fairly complicated thing but yeah most of the time you can avoid the problem by using line numbers and if not then the debugger will try to help you yep oh this one sure in fact I can probably just I can do something like this and it will show if I open up a Chrome browser one second the service I used to have like I have it when I press T or a selection it automatically uploads the selection to you and then you can it gives you back a link it's having its birthday today so yeah you can have it of course it's it's not on github sadly a lot so the question was better the sink better a single-threaded cool so we're a multi-threaded program would complicate this a lot yes it will complicate it so yeah this is this is deliberately a single-core and I mean a single threaded application and multiple you gotta care about who's gonna get that signal delivered there are problems and they just complicate and don't they don't matter for a younger lying idea it was yeah the question is what happens if you want to modify wanted to more than four locations that are available endeavour give our registers you use a software breakpoint so when you do so this yeah so the question was whether so there's two processes playing there's a debugger and the debugger you can call that be buggy and when a sick trap is delivered who gets that signal so it's the process the debugger gets the signal but that is intercepted by Petrie's so when you when you trace me when you're digging up big on tracing basically what happens is that it tells the kernel behave any signal is delivered to me let the let the tracer know so that you know the debugger and at that point basically what happens is on any signal the the traced program stops and then it delivers a weight event to the debugger that you can use here so you can see here that I do ovate and I get the status and from that I can see that if this is not even true anymore but basically you can use the standard c library weight functions to determine what happened so if it was stopped then that means it was a breakpoint if it exited then that means exit it so you can do and then of course here you can do you can get the in the underlying signal number and compare depending on what happens and then figure out what's going on so the question was how run onto the next line is implemented like step over oh yes so you've got a so basically you find the address so you find the address of that particular line it starts from the barf information which is complicated and once you have that address you can set up a cell for break but for instance that's one thing you can do any more questions yeah oh no in this talk I deliberately cover so the question was whether I implemented this forearm know this talk only concerns x86 it's similar an arm depending on I mean certain arm there are there are things that come into play but this is mostly for x86 but that's what most people use at the moment from what I see any more questions so question was under any advantages to implementing this in rust memory safety sure it's yeah well it has to be unsafe at some point because it's it's calling into unsafe code that is Lipsy and that is not rusts fault it's C that's being unsafe and also just because I like rust and people seem to be generally happy when they see rust and hey it's pretty readable usually [Music] okay I'm just gonna do this so you don't see unreadable code yeah that's there's any more questions I'm happy to take them thank you
Up Next

23:22
Introduction to PyTorch: Build & Train a Neural Network from Scratch
@statquest
205.2K views•2022-04-25

11:23
Solving the Heat Equation with DeepXDE and PINNs
@Dr.Mohammad_Samara
8.5K views•2023-07-17
4:55
HTTP Requests Explained: GET, POST, PUT, DELETE
@codecademy
103.1K views•2021-10-07

19:25
Enigma Machine Mechanics: WWII Encryption Explained
@JaredOwen
13.2M views•2021-12-11
Related Study Plans & Knowledge Roadmaps
Structured learning paths in Computer Science
computer-science
Building a Rust Debugger: ptrace, ELF & DWARF
01Systems Programming Foundations & Rust
02Process Control and the Linux Ptrace API
03ELF Layout: Inside Linux Executables
+ 3 more learning modules
38h6 modules
Explore Roadmap
computer-science
Container Runtimes: Namespaces, Cgroups & Go
01Linux Systems & Go Programming Foundations
02The Core of Isolation: Chroot and Filesystems
03Linux Namespaces: Process Isolation
+ 3 more learning modules
32h6 modules
Explore Roadmap
computer-science
Building a CHIP-8 Emulator: Rust & CPU Basics
01Computer Architecture Foundations (Bits & Bytes)
02Rust Programming for Systems Development
03CHIP-8 Virtual Hardware Specifications
+ 2 more learning modules
32h5 modules
Explore Roadmap
computer-science
Building BitTorrent: Go, P2P & Concurrency
01Go Fundamentals & Concurrency
02Networking Foundations & P2P Architecture
03Bencode Parsing & Torrent Metadata
+ 3 more learning modules
26h6 modules
Explore Roadmap