



















This tutorial covers essential GDB techniques for embedded device debugging, including compiler debug flags (-g, -ggdb3), TUI mode for source/assembly viewing, breakpoint types (software, hardware, conditional, watchpoints), remote debugging with gdbserver, and profiling tools like strace, ltrace, gprof, valgrind, and ftrace for analyzing system calls, library calls, and kernel behavior.
Debugging Embedded Devices with GDB: Lessons Learned
Added:Proficiency in C or C++ programming, as these are the primary languages used in embedded systems development.
Fundamental understanding of microcontroller architecture, including registers, memory-mapped I/O, and the distinction between Flash and RAM.
Familiarity with the compilation and linking process, specifically how debug symbols (such as the -g flag in GCC) map source code to binary instructions.
Basic command-line interface (CLI) navigation and experience executing terminal commands.
Hardware-level debugging protocols and interfaces, such as JTAG/SWD, and configuring debug servers like OpenOCD or Segger J-Link.
Real-Time Operating System (RTOS) debugging, including task-aware debugging, analyzing race conditions, and identifying thread scheduling issues.
Advanced post-mortem analysis, such as reading and diagnosing system crashes from core dumps and handling micro-controller hardware faults.
Automation of debugging and testing workflows using the GDB Python API to script custom analysis tools and facilitate hardware-in-the-loop (HIL) testing.
18.3K views393likes1:37:24Original Release: 2020-09-11
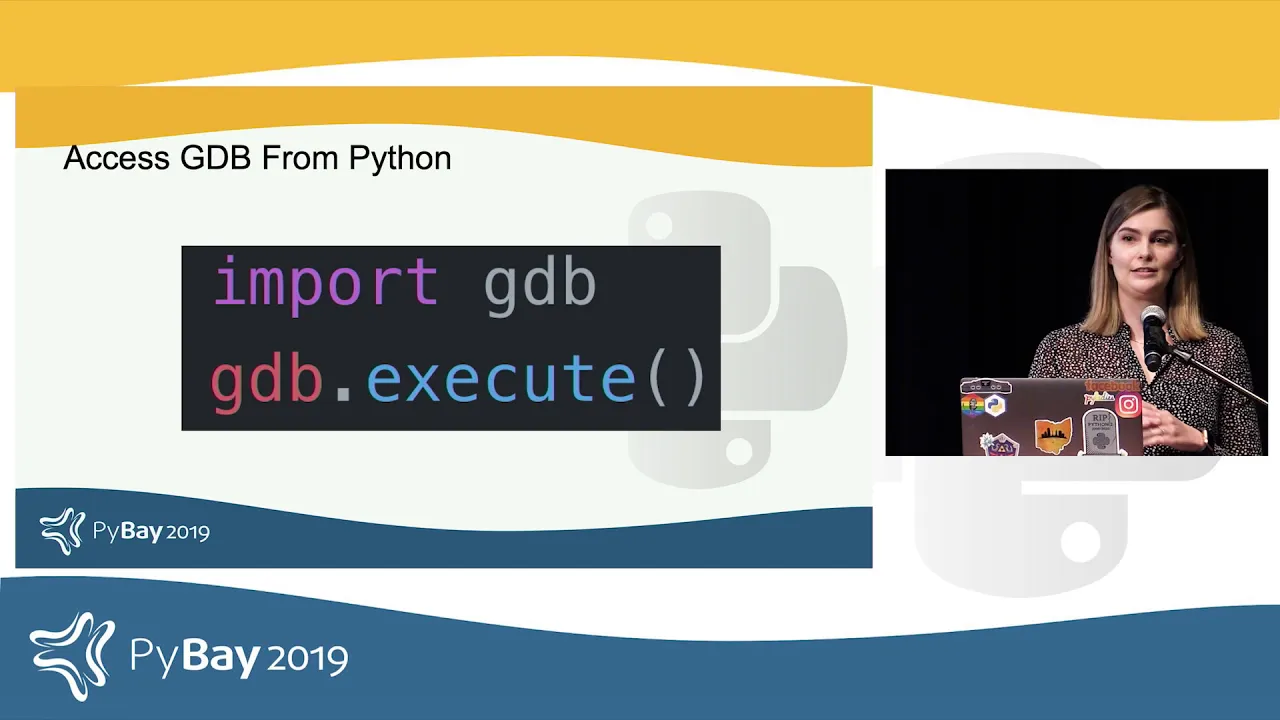
there goes hello everybody and uh welcome to our second talk in the uh the 101 essentials for embedded track um the next talk is going to be by mike anderson uh he's a long time speaker at the embedded linux conference and and other linux foundation conferences uh he often ends up giving far too many talks but we've managed to get him in to give this talk today on gdb on embedded devices and uh make sure that when you uh have many questions that uh you write them in the q a and he'll ask them at the answer them at the end otherwise take it away mike thanks ben uh let's see here let's get going uh obviously i hope that everybody's had an opportunity to at least download the charts i think they're available online if not they will be available shortly and with any luck you will be able to get those and then have them for your very own copy this is me mike anderson you can use my mail to there mike anderson ptr gmail.com at the time i wrote these particular charts i was unemployed actually between jobs i just started a new job last week so brand new on the job with the aerospace corporation this is me i've been in the industry for about 42 years 20 or so of those with embedded linux and i used to be chief scientist if the ptr group and many of you who have been in my presentations in the past probably know me from that particular role i'm now an embedded systems architect at the aerospace corporation and i continue to be the mentor or a mentor for uh first robotics team 116 epsilon delta out of herndon virginia uh if any of you are interested in robotics at all i highly recommend getting involved in first robotics it's a great way of being able to help the kids come up to speed and i look at it from my perspective it's a one of these days the software that those kids wrote may be running my ventilator and believe me i want to make sure they did it right so that's an important thing for me to make sure that they're all up to speed and embedded and are doing the right thing for us linkedin obviously if you want to get in touch with me on linkedin you're more than welcome to do that as well but enough about me let's move on to talk about what we're here to all chat about which is gcc and gdb and all the tools that go along with debugging and profiling inside of the kernel now obviously part of the problem that we have with linux is it's not that we don't have enough tools it's that we have way too many tools oftentimes with an overlap a considerable overlap between some of the tools so if i for whatever reason leave out your favorite tool uh i appreciate uh that you can be upset about that but unfortunately uh we only have so much time to work with here so we will press on and hope that we can cover most of the things that most people are interested in uh we'll talk a little bit about the gnu project in gdb and where it came from and what we need to do in order to compile uh for debugging we'll get into some special modes of gdb in particular one that not very many people are aware of and that is the text user interface mode or the tui mode uh we'll also talk about some of the gdb front ends we'll then dig into how we get help some of the scripts and macro mechanisms what we have to do to go about launching and kind of running applications within gdb attaching to a running application uh how we set points watch points trace points uh we'll get into gdb server which is a very useful tool for being able to debug code over on an embedded platform um the embedded platform that i have for use today is kind of a special one it's the udu bolt which happens to be based on the new uh apu from amd it is an x86 uh and it also has a kind of a an arduino built into it as well so it's kind of an interesting little beast uh but that's what i'll be using for my embedded platform discussion when we get to gdp server then we'll kind of switch gears from the debug perspective over to the trace and profile perspective we'll look at s trace and l trace uh g prof g cov valgrind ltt f trace and we'll talk a little bit about uh perf um which is relatively newish um and the issue that i have with perf is that it only runs over on the udu bolt because i'm running a custom kernel on my platform and as a consequence it doesn't like running perf uh out of the box but them is the way it goes so let's move on and start talking a little bit about debugging tools now when we look at debugging tools they basically fall into one of two different classes either they're a debugger like lldb or gdb live recorder etc or they're some sort of a checker now in particular checkers and profilers are focused on trying to find bad things stack overflows uh misuse double freeing of memory those kinds of things how we're using the caches address sanitizers and even some of the static code analysis tools like coverity kind of fall into that category because they do have the ability to look at threading possibilities the threading interactions and go well you know there could in fact be a problem here and they'll try to bring it up and uh you know try to uh deal with it at something a little bit uh um you know before you actually get into the debugging tools before you actually get into the the runtime stuff so they tend to be a little bit on the static side but that's okay because we need to be able to do those too certainly tools like coverity have really helped tremendously with the linux kernel so that we could in fact get some eliminate a lot of the potential uh race conditions and things of that sort that have existed in the kernel in the past now uh with the gnu project of course uh gnu stands for gnus not unix uh it was originally developed in 1984. uh it was actually put out there in 1983 september 1983 it was proposed and then the work didn't start until january of 1984 but one of the first processes one of the first things they wanted to do was to build uh the tools that were required to build an operating system that would be a completely open source uh free operating system that was very unix-like but was not unix and that's where the news not unix came from in at first there was just the gcc compiler and then that was focused largely on just c uh then later we got g plus plus uh which was c plus plus and now that's kind of finally manifest itself as the gcc with a capital gcc and that's the new compiler collection now the way the gnu compiler collection is built um it's got a front end that allows it to interpret the language and convert that into a back end which will then actually do the compilation so we see front ends for c and c plus plus objective c fortran ada go et cetera et cetera and of course libraries like lib standard c plus plus those are all part of the new tools and it's architected so that we do have that option of being able to work in terms of uh kind of a front end that's built to run on one machine and a back end that's built to run at a separate computer so for instance we would have something that was x86 cross arm or windows cross linux so all those kinds of things are different possibilities that exist with the gcc tool chains and uh of course uh as opposed to gcc we've got uh um llvm uh so there's lots of great compilers out there i'm going to be focusing largely on gcc and the new compilers at this point and gnu debugger rather at this point because that's the pretty much the topic of this particular talk perhaps i'll do an llvm uh debugger at some point in the future uh so that would all be kind of cool now um let me just go ahead and yes uh the slides are available for download they should be on the website uh if i had forget failed to mention that earlier if they don't show up on the website shortly you can always email me and i'll be able to get you a copy as well now uh the gnu debugger gdb uh it was built as a source debugger for the gnu compiler collection uh which means it actually supports many many different languages and this is one of the things that most people are not quite familiar with with gdb um gdb actually works with ada and c and c plus plus obviously but it also works in d fortran go objective c uh modula 2 pascal rush rust and several others so it is a very flexible debugger it is not simply limited to cnc plus plus it actually works across the gcc across the new compiler collection into quite a uh a nice debugger that works across multiple platforms now uh when we get ready to compile something for gdb uh we'll take a look at the command line debug options and this is when we get ready to build the code we will pass a special compiler flag and this compiler flag is a kind of ubiquitously known as the dash g option however there are more than one dash g option uh we range anything from dash g0 which means don't do anything which i guess makes more sense if we're in a make file and we're passing this as an environment variable um because why would you go to the trouble of actually typing dash g0 if you didn't have um anything out there to do if you didn't if you weren't really trying to compile the code uh dash g1 includes minimal information basically back traces uh but no information about local variables and line numbers and things of that sort dash g2 is the default debug level so if you just specify dash g on the command line you will get g2 and g2 produces symbols line numbers basically everything that's needed for symbolic and source debugging and this is like i say the default if you use the dash g option in the compiler but that is not all it turns out there's a dash g3 which includes additional information such as all the macro definitions that may be present in the program this is particularly important when we're looking at places where we're doing uh some large substitutions of macros uh like for instance in the in the linux kernel um there are a number of commands that look like c commands but they're actually inline assembly language commands so uh all of those would certainly be something that could potentially be a macro expansion that we'd be interested in knowing and we could see all that using the dash g3 option but you know all of these options these first three options g1 g2 and g3 all produce output in what's referred to as dwarf format and and if you look at the output from the compiler it's called elf embedded in linking format our executable linking format and then dwarf is debugging with attributed record formats or uh so that's dwarf so we have elf and dwarf very much a kind of middle earth sort of flavor there but the mack daddy of all the options is dash ggdb3 this is like dash g3 however it actually generates debugging information specifically for gdb rather than the normal uh cough or x-co for dwarf ii format that you come out with dash g so dash g gdb3 does in fact produce more information in the debug output and it's specifically targeted at being used by gdb rather than one or of the other uh debuggers that are potentially out there so uh here's an example of a compile for gdb we have this arm linux gnu abi gcc uh we're using the dash gdb3 option here uh dash oh hello and we're doing the compile of the ubiquitous hello world um the example if we were to take a look here in the elf header uh and we were using object dump as an example to show us all these things we see all these things that begin with a dot debug this is the code or the the sections rather that get output when the uh dash g option is turned on to the compiler now uh the nice thing about all these things is they are kept completely separate um and they're kept separate in the executable therefore the code itself the text segment in the executable does not get adulterated with debugging information this is really handy because what this means is i can actually debug code on the target that has not been compiled for debugging as long as i have a version of the code that has been compiled for debugging online so i will load the code compiled for debugging into the debugger but the code that's running on the target does not have to be that code it just has to be well obviously it doesn't have to be compiled for debugging but it does have to be the same code base obviously now that's an important factor here because when we're dealing with extremely low memory footprints uh and i have run linux on a two megabyte machine before it was a mips processor where they had already purchased all the ram chips and you couldn't get any more than the two megabytes that they had when you're trying to run linux in a very small memory footprint like that you do not want to put anything into memory that has any of the debugging code in it because the debugging code adds about 30 to the size of the executable so that's an a very important thing to keep in mind and we'll see example of this when we get uh into a little bit of the session that i'm going to show you a little bit later here so now uh we can run gdb from the command line interface now uh obviously when gdp is built from the source code we have to specify the host and target information and the host and target information will specify whether it's windows cross linux or linux cross linux x86 to arm et cetera et cetera so here's the kind of output that we would expect to see from uh this kind of a compiler we're going to output here we're just going to run the gdb interface and we'll see that this was particularly configured as x86 64 linux gnu now um if we had a cross compiler built on here then we would see that it was configured as x86 64 as the front end and potentially arm is the back end we did have a question come in what's the advantage of g1 g2 if g3 does even more especially if you can strip the executable from running on the target um the issue is that the more optimization the more stuff you turn on here especially if you turn on optimization optimization rearranges the instruction stream so if you turn on a very high level of debugging and a very high level of optimization at the same time the humans the debugger can handle it fine humans can't handle it too well when you see the instruction pointer jump backwards so it's a little weird uh it doesn't mean you can't debug it it just simply means that you have to be mentally prepared to see things go backwards uh it uh also if we were to turn on all the debugging options and we're running the debugger and we're actually interacting with the debugger then yes having on higher levels of the debugging flag turned on will in fact slow the processor process down a little bit more because it's starting to keep track of more things that does not necessarily mean that it's going to be like even three or four percent difference it's going to be relatively small so you're not going to see a whole lot of difference here because we really don't need to do anything to the target as far as being able to turn on the debug flags we just need to make sure that the debug information is available to the debugger so the text segment uh and the data segments and all the other uh important running segments of the application of the application on the target don't change when we turn on the debugger um it but it does change the size of the code so when you start turning on debug level three then the code's going to bloom up so if you are just if you're not really thinking in terms of being able to run the strip command and do all the things that you would normally do before you deployed the code if you're just in a quick debug a compile debug test kind of model then people don't like to have to go through the extra steps of doing the strip command and then doing the copy it's just a little bit easier for them to just simply do everything inside of one make file now personally i would then put the strip command inside the makefile but we really do need to have the fully debug enabled version of the code for the debugger we don't need it to be the run on the target but we do need it for the debugger so it does get a little bit complicated and oftentimes it's just easier to not mess around with it but fortunately it really just changes the size of the executable as it exists on the disk not so much the change in the runtime all right so if we wanted to run gdb in text ui mode running gdb in text ui mode the tui mode uses curses so obviously if you don't have cursors installed on your platform it's not going to work all that well but what it does is it then gives you the advantage of being able to actually see the code uh interact and operate almost like you had a full up gdb gui so for instance let's go to the screen share here and let me see if i can get the right screen selected uh so with any luck now you're seeing a screen that shows uh my command line here so let's go ahead and we'll run uh gdb first of all i had mentioned that we have the option for building gdb with different compilers so if we took a look here at this output for arm linux you'll see that the gdb was configured as the host is an x86 pc linux gnu so it's a x86 based host but the target is an arm processor running with hardware floating point turned on so that's the kind of thing i was trying to show you a couple of pages ago where we will configure a front end for gdb and a back-end for gdb now inside of gdb i can automatically load commands let me just go ahead and i'll quit out and show you here so we can do gdb and i have a command let's just go ahead and compile it just so that we've got it all there we'll do a gcc dash oh hello and uh dash g will turn on just level two that's okay we don't need to turn on more than that for most cases and we're going to compile hello c and then we will run gdb and we'll run it in qe mode um and we're going to look at hello and now we see what it looks like when you're running in the text based ui so we have the upper window here which is the source code and we can scroll around in the source code we have the lower window which is the command line and inside of this we actually have several different options we can use the layout command and if we just sue layout next it will then show me the next possible layout in this particular case i have the assembly language output i can do layout next again and now i see the source code on top and the assembly language and then let's see here if i can get it to do this again uh register values i'm not running it right now so there are no register values available and then uh let's see here i think it uh let's see i think it's got a couple of uh then it goes back to the original one here so if i wanted to just simply do a kind of a quick run of this i can just tell it to run and if i tell it to run it will run to completion because i don't have any breakpoints set yet but we see hello world and we see the value of i and now value i has been incremented notice one thing here it says inferior one has exited normally uh that is not a comment on the quality of your code that is a comment on the way gdb sees your code um whereas gdb is running it from outside of the code it sees your code as an inferior process it's something that is uh subject to the control of gdb so in this particular case we just ran it to completion and then it exited and that's the kind of message i would normally expect to see there are a few other things that we can actually take a look here we can do an info on the number of windows that are out here and this will show all the different windows and their respective heights i can then uh specify the height uh let's say wind height let's do source and we will subtract two from the source code there it just changed the amount of window displayed by the source by two and if i happen to then be looking at things like uh 2e let's do uh register um and uh let's do register let's take a look at the floating point registers and obviously it's not running so let's do this to uh break at line 14 and then run and now we see the floating point registers so we can also see the general registers as well uh tui reg uh gen i think uh will allow us to our general rather uh general and we can see the floating point register i mean we can see the general purpose registers here so we see ax bx cx etc uh we also see the magic uh additional eight registers that were added to the x86 instruction set uh some time ago um that uh you still don't see if you're in a 386 or 486 world but uh it kind of gives you an idea of the the relative flexibility associated with what you can see inside of just looking at it in the text ui mode now as we move forward we start looking at full-up gui's now there are a lot of standalone ide based front-ends for gdb the one that is the official supported g uh front end is the data display debugger or ddd uh you see a picture of that in the upper right hand corner there um it is very much like tui mode except that it is an actual window that floats there and you can move things around inside of it and you can resize it and it actually has quite a bit more flexibility for being able to display pieces of information like uh being able to see your watch variables and data structures and things of that sort so ddd is a really nice uh little interface considering its age uh it still holds up pretty well obviously you can also use front ends like eclipse you can also use microsoft visual studio code microsoft visual studio code is actually open source it is not visual studio it's the editor for visual studio but it also has quite a few plugins that are available for it including a gdb and an lldb plug-in so we can actually do debugging using either the clang compiler or using the gcc compiler there are other ones of course k develop slick edit code warrior many many others are out there so it really becomes a question of what your preference is in terms of which debugger interface you happen to like best with the ddd front end ddd supports jdb python perl tickle php and we can also specify a different back end so for instance if we um are getting the dash debugger option we can specify arm dash linux new ebi and my app and with that we'll be able to run a different back end um with the ddd front end that's running on the x86 the back end was running arm and will then be able to talk uh reach out and contact uh you know reach out and touch a different d a different application to run here and we'll show you how to do that when we're using things like gdb server and i'm getting some reports uh on the audio let me see what i can do here about uh trying to turn the audio down just a little bit uh maybe we can back it off a little bit hopefully that will help uh cool all right excellent okay so let's move on uh here's an example uh of the help output from gdb so gdb has a very complete help inside of it if there's any piece of information that you need to be able to get about how to run something within gdb the help is actually quite um complete so we can ask for for instance help on break points and it'll then tell us everything we need to know about break points trace points watch points it is very very complete it's like having the entire manual online and being able to pull it up at any point in time so that's really quite handy at being able to um to see all of this now um as far as commands and definitions are concerned um one of the things that a lot of people are not quite familiar with in gdb is it's the ability to create your own commands and your own scripts if you have a series of commands that you type frequently or if there is a long series of commands that you have to use in order to get started on a particular debugging session you can actually define those as a command sequence within the debugger itself and what we'll do with that is we will then define the name of the command that we want to define and then once we hit return on that it'll then prompt us for every single line that we want to type in when we're finished we'll type the single command end and once we have done that that will become an official command so we can also then turn around and document those commands uh and of course all of us are loath to do documentation but um as it turns out we can in fact document uh our commands so that somebody else comes along and we can then check these commands into git and then somebody else can check them out and have the same debugging tools and the same debugging scripts that you had used when you originally developed the code so that everybody kind of understands and they're all on the same um you know basically in all the same playing field we can also go in and define c and c plus pre-processor macros so these get into the macro define command these are going to be visible to all of the inferior sources files so if i'm trying to debug an application and it has a pound find inside of it someplace we can actually go in and manipulate that so let me show you an example of how that's done let me go back over here to my screen and we have an application sitting here uh we can define a new command we can see let's define a command called fred um and then it's going to ask me to type in a whole series of commands and then type in as the last one so let's just do a print of i that's our variable that we're messing around with in this particular program uh and then we'll type in and then from this point forward all i need to do is just type command fred and it will then tell me the value of i if i then specify that i want to step over so let's do it next and control l by the way automatically refreshes all of this i will then uh do next again there we go so now if i type in the word fred i have the value 1 because i just incremented it up here on line 16. so uh by being able to define your own commands by able to define the documentation for those commands then if somebody said help fred they would then be able to see whatever documentation you had provided for that particular command so it's kind of a clever sort of option here um now one of the questions came in can we set vim to be the editor of choice in tui mode i've not seen anything that allows you to do that but i wouldn't be surprised if there was some mode that you could put it in that would either be emacs or vi but i haven't been looking for that quite frankly because i don't use tui mode except when i'm communicating to a target and the target doesn't have any uh gui capabilities on it so if i have just an arm target sitting out there that just uses a serial port for instance or just uses ssh over the ethernet then tui mode is really handy to be able to do debugging on that platform when i know i don't have uh the the space for instance for having all the x windows uh libraries and things of that sort so that uh is there a way to do it there may be i don't know what it is right off hand however all right uh so let's go back to our code our back to our charts here we also have in many cases when we're trying to do a long debug session we'll we'll go home we've had dinner we come back we then want to sit and we want to pick up where we left off or we want to pick up and start everything over again but we want to be able to key in a whole sequence of commands to get us in the right place having loaded the code having set the breakpoints everything else that we need to have so this is where the gdb init command comes into play if you have a gdb init in the current directory then basically what it will do is it will execute all the commands that it finds inside of there before it gives you the gdb prompt so for instance uh commands like setting the history save on setting pretty printing on pagination confirmation turning those off these are things that you will normally do inside of a gdb session so rather than having to do this time after time after time or just copy and paste between your environments it's easy just to put this in a gdb init and every time you start gdb it will automatically load these commands and you're off and running at that point there is also a command the dash x command line option that allows you to run scripts at gdb load time so you can then specify if you don't want to use gdb init if you had your own script for instance then you could specify dash x name of the script and the application that you wanted to run and it would automatically start gdb load the application and then execute the scripts so that everything was all set you'd have your breakpoint set and everything else additionally inside of gdb if i need to be able to get out to the command line i can use the shell command and the shell command will then shell out to gdb out to the command line and then execute whatever command you decided to do in the shell so that's a really handy thing as well now one of the things that is kind of a surprise to a lot of people is that gdb actually has an embedded integrated python engine inside of it it doesn't actually just shell out what it does there's actually a python engine embedded inside of gdb so we can execute python expressions uh if we just simply preface them with the command python space and then whatever python expression we wanted to use we can actually then execute python commands we can also write python programs inside of gdb using the python interpreter now we see here a few examples python gdb.execute that's going to execute some gdb commands we can parse and evaluate things that's basically getting data into the getting data from the inferior we're basically going to reach out to the command line options if we wanted to just get all the possible things that python can do we can do python help gdb and that will allow us to see all of the commands that are possible inside of the python gdb package but let me jump out here and i'll show you another example and let's see if we can do this so here at the gdb command prompt uh what we can do is we can execute a command like python uh print hello there we go so we just ran the python that python command nothing particularly magic about that command obviously but uh we can then go into interactive mode and uh whoops let's not do that okay so let's type python but now i'm in python interactive mode i can import class libraries and then i can execute commands that require those path those class libraries and type end and there it just ran it and it said i am pid and it did the os.getped command so it's a way of being able to even get to the point of defining python shortcuts that we can define as commands inside of the debugger so just as we talked about the define command we can also define define commands that allow us to define python commands and then execute extensive python operations inside of the debugger very handy for us to be able to kind of mix and match and many of us are very familiar with python anyway so it really helps to be able to pull that information and be able to get access to the python interpreter without having to jump out of the debugger environment in order to get to the python commands so terribly handy then uh if we take a look at of course the bane of a lot of developers is the signal mechanism and uh gdb is built on top of p trace the pa the process trace command so when inferior gets a signal the inferior is then suspended and the tracer gets notified so what's going to happen if we are interested in what signals we have we can use the info signals command and that'll print a table of what signals are out there and how gdb will handle each one of them we can also then do an info handle and that will come back and tell us what those info signals what that actually meant so we can specify no stop which means don't stop the program but print that that that signal actually occurred um useful for things like sig user one sig user two uh we can tell it to stop the program when the signal occurs we can tell it to print a message when it incur when it occurs or don't print a message we can keep track of whether the program is going to pass it on so this becomes important when we're dealing with threads and the ability to deliver a signal to the parent which then gets replicated out to the individual threads from within the parent so pass and no pass that deals with being able to pass those signals on to threads that may be running in the same process address space and we can then change a particular signal handler we can do handle signal keywords we can then turn around and deliver a signal on demand from gdb so if we wanted to send the segmentation violation basically the bus error signal we could then signal sig seg v and that would then send the signal to the main application and then obviously if we had the pass turned on then it would turn around and pass that signal on to the threads itself so we can generate signals interactively from within gdb and test our applications that way if we happen to have signal handlers well let's assume that for whatever reason we decided not to load the application when we ran gdb there is a way of getting around that particular problem it's called the file command the file command we specify the name of the file that we want to load and it will then turn around and load that into gdb just as though you had invoked it from the command line that is an important feature when we talk about debugging kernel code if we're using kgdb kgdb uh when we run a kgdb of uh say the kernel the kernel may not necessarily have had your dynamically loaded module in it when the kernel was compiled obviously it's not going to have dynamically loaded modules so if we're debugging using kgdb then what we'll do is we'll use the file command to load the driver into the debugger so that we can then start setting breakpoints inside of the driver we won't get into the details of doing debugging in the kernel in this particular session we just don't have time to do that unfortunately but understand that this file command also has some additional options in there which tell me where to load the uh text segment the data segment uh read only data et cetera et cetera bss and those are all important things when we're trying to mess around with um either code that has to be loaded in a specific location in memory like for instance um if you're using u-boot if you're trying to debug u-boot u-boot has to have its text segments loaded at very specific locations in ram for the board so the file command here will then tell gdb where that code was actually loaded and that allows gdb to reach out generate the right addresses and be able to debug that code as it exists on the target so that's a very important command also we've seen the run command i did that a couple of times here but we can set the arguments to the run command so we can run the application we can pass arguments that way or we can use the set args command and set the arguments so that when we use the run command it automatically passes the arguments we're interested in if we did a show args command that'll let you see the argument so that you can then go oh well yeah that's correct or no that's not correct let me go ahead and change them and do another set command so you can run it and you can change the arguments and you can have all of that set up inside of your gdb init so that you don't have to type all that stuff all the time now one of the real powers of gdb is the ability to reach out and attach to an already running program so when we attach to an already running program that program may in fact not have been compiled with debugging turned on um this is where you compile you combine this gdb dash p option and the ability to use the file command so that we can then attach to a running application when we attach to it it will stop the running application at its current execution point so if the if it say it's a server it's running in background it's a demon we attach to it when we attach to it we will stop it it will then uh have a break point basically set at whatever place it was when we executed the gdb pass dash p command then we can use the file command to load the executable with the debugging turned on that is the executable that has the dash g option that was compiled with it so again this is usually targeted at applications where we have a very small memory footprint either a small storage footprint or stall small ram footprint on the target and uh we still want to be able to do debugging on that target now this is usually going to be focused on um cross debugging and not necessarily native debugging if we're in native debugging we typically have enough memory that we can work with it without having to go through all this trouble but uh the nice thing is that when we use the gdb-p option we can then attach to any running application and it will stop it and then we can start stepping through it now if we don't have the source code for that application then what we will see is everything in assembly language so when you're looking certainly you're doing debugging of u-boot or some of these low-level pieces of code it helps to know the assembly language for the application that you're working with or for the instruction set architecture of the application processor that you're working on top of so it's definitely handy to be able to have that kind of information and you know you don't necessarily have to speak assembly language but at least be cognizant of it so that when you step into a piece of code that you don't have the source code for you don't wig out when you see nothing but assembly language out there it's it's okay uh you can keep stepping and it'll eventually turn back into c or c plus or whatever language it was that you were actually using now when we get ready to examine code once the program gets loaded into gdb you can basically list any of the source files so if the code is made up of multiple dot os that are all linked together that's fine all you need to know is the name of the file and the line number or function name that you're interested in taking a look at so when we use the list command we can specify a line number a file at a particular line number a function name or a function inside of a file or a specific address so all of those things work when i'm using the list command now obviously if i'm doing a list out of an address i'm typically going to be looking at assembly language code at that point but that's okay again that's not at all unusual when you're starting to do low level debugging at this at this point so you can specify the number of lines to list as a second parameter so if i set the list size of let's say 15 then when i typed list and main it would show me 15 lines instead of 10 lines 10 lines is the default by the way you can also change things like the radix oftentimes we'll be working in hexadecimal but gdb defaults to decimal so if i put in my gdb init if i put something like set output dash radix 16 then all the output will be in hex terribly handy to be able to translate all this stuff into something that makes more sense from a computer's perspective maybe not necessarily from a human perspective but most of us who've been programming for a while we can equally think and hex as we do in decimal it's like how do you count in binary on your fingers you know that's kind of interesting you get a 31 on one hand it's really handy to be able to think in those terms so that when you're looking at output code you can do it in the radix that you need to have some things still use octal and of course you can also switch that over to binary as well if you want to know what options are available then we can um uh use the help set and help set we'll then show you all of the potential options that are out there um and uh that says the screen share is out of sync i'm not sharing the screen at this point so uh that would be why it's probably out of sync um the so i mean now i should be sharing the screen uh so let's do something like this let's do a show that shows me all the different options that are available to me here and of course i have to then do this layout oh let's uh there's another thing we can do we can actually specify the focus so we can specify focus and command and now the focus is set to the command window so now i can scroll around inside the command window so that's uh i mean those are the gdb commands so let's do uh just do a set output radix 16 and now it's set to uh hex so that would of course be something that we would typically want to be doing if we were trying to dump data structures and things of that sort that would all be done in hex all right so let's go ahead and stop that screen share and go back to the actual charts there's another thing you can do which is kind of interesting and that is once the code is loaded you can actually call program functions from within gdb and the function will be called and the return will be printed and saved in the value history so uh and it will use the same calling sequence that the language uses so let's uh just go back out here to the screen share i probably terminated that a little too soon um if we go here and let's uh just do a layout next and uh there we go all right so now we're back to just the um screen the the text itself so let's do a list and you'll notice i have a function up here called sub uh which is just a subtraction function it's nothing particularly magic but it's just a way of being able to show you how the um how the command works so hopefully we can you can see all of that so let's do this let's call sub and we will pass it two parameters let's do um we take the first and we mine it we subtract the second so let's pass it five uh uh comma three and it returns the value too uh so again nothing particularly magic about that but the nice thing is it's like well okay it just called this function what is this function's inputs what is this function's outputs you can call it interactively from the command line so that's a really handy thing to be able to do especially if the function that you're trying to call is in another file someplace that's been linked in you can then list the functions so we can do list sub and it would then show us the sub the subtraction function up there towards the top um and we can do that across any file that's been linked into this particular executable so we can find that as well all right so let me stop screen share there and that's the calling function uh setting variables uh if we want to change um the setting variables we can uh in any function for instance we can do uh set i equals five or whatever language you happen to be using um and um and it has uh let's see uh i just got a message here okay yeah so it seems to be good for some people uh some of you are seeing the screen share fine some of you are seeing it with a little uh bit of an issue um a lot of people are seeing it fine so i suspect that may be a local problem uh refresh rates and things of that sort depending on your individual data feeds and how much bandwidth you've got going out there so i'll try to make sure that these things are as clean as possible i'll just jump in and do a control l periodically to refresh the screen so that everybody has the latest and greatest and hopefully that will help um but we can set any variable to any expression and obviously we can use any syntax that's equivalent for whatever language you have to be using we can also let's say that i have a function called call a variable called call well that overlaps with the call function inside of gdb so how do i get to the call function how do i get how to distinguish between the variable and the function if i want the variable then i'll use the set variable call equals expression so the variable expression there if i use the variable designator in front of it then that says find the variable called call not the gdb function called call so if i happen to um pick on one side if i happen to pick a variable and obviously when we're writing our code we don't necessarily know all the reserved words in gdb we may actually pick a reserved word as a variable it's not a reserved word in our language but it just happens to be a reserved word in our debugger if that's the case then we just use this this variable designator here and it will find the variable in your code by that name rather than the gdb function by that name uh let's see here printing expressions uh use the print command obviously that will print a variable for me uh i can then use and this is a really interesting capability let's assume that i just updated the variable i and what i want to do is i want to look at the previous value of i i can then use dollar sign and the variable that i'm interested in and it will jump back one version uh i can also use uh dot multiple dollar signs and i can continue to go backwards in all of the different values that the variable has obviously there's a limit at some point but it does give me the ability to take a look at the value of a variable before it changed which is terribly handy it's not quite the same thing as running backwards which gdb does have the capability of doing in some cases but uh in this particular case we're just saying give me the value that this variable had before i changed it so we can also use the at sign symbol that's a binary operator for looking at consecutive data objects so let's say i'm dumping a fifo out of memory i can use foo at number some address for instance and then it will show me all the variables that are at that particular location everything that's adjacent to foo it's also very useful for being able to dump data structures things of that sort so definitely something of some use so if we have a known memory address we can also use basic casting here so we have the x command which allows me to show memory at a specific address we're going to display it as a byte it's a decimal byte and we're looking at the address of test so um that will then jump out show me the address of test and what it is as a byte uh definitely uh useful if i need to be able to cast it as a d word or a half word or a quad word something like that then very useful to be able to specify that from the gdp command line now break points of course one of the big issues with gdb is our ability to set break points we have to understand that there are several different types of break points inside of gdb we have the standard software breakpoint which is just the b command that will go into the code and substitute the trap instruction for the breakpoint at the location that you just specified and then it will store the original piece of code off in a buffer someplace so that when i reach out with the b command i'm going to actually reach into the executable and i'm going to change the location at that variable or at that line number and make it the trap instruction that traps to the debugger so for instance in the case of the x86 that's an int 3 which is the trap to the debugger but this requires you to be able to actually modify the code so what happens here if i'm running out of flash then the normal software breakpoints don't work because in order for me to set a breakpoint in flash i would have to read the flash uh change the variable and then write the flash um back out there but um you know this is one of these cases where that becomes very problematic because i'd be rewriting flash every time i wanted to step in instruction that's not going to work very well so in order for me to be able to debug things in flash i would then be using the hardware breakpoint that's the h-break option now depending on your processor architecture not all processor architectures have hardware breakpoints and not all of them have a lot of hardware break points for instance i think in the x86 i think there are three hardware break points uh in some cases a power pc there are five uh arm has uh three or four i don't remember which ones but in any case the number of hardware breakpoints is dependent on your processor architecture that's a useful thing in the sense that when i want to be able to set a breakpoint at a specific location in flash i can do that and what will happen is when the instruction pointer matches that hardware breakpoint mask it'll automatically stop the processor at that point and drop you back to the debugger so extremely useful being able to debug things like u-boot for instance or an application we'll show you here an example where um you know that some piece of code is stepping on a um a variable but you don't know which piece of code is doing it so you can set a watch point up and we'll talk about watch points in just a second but you can set a watch point up that will then automatically stop if a piece of code writes to that location um and then you'll know exactly which piece of code is doing the writing so if you've got some case where something's being stepped on you're not sure what it is then use a hardware break point and you'll be able to find out exactly who's doing it at what point in time and where that code is located very useful to have we also have temporary break points temporary break points they'll stop once and then they'll be removed so if you just want to stop it as it's coming into a particular function call but the function is a loop and you don't want to sit there and loop forever so we can absolutely then um take into account stop it once check to make sure that everything's good going into the function and then allow the function to continue to run and it won't hit that break point again there are also uh conditional break points now when we start dealing with conditional break points things can get a little wonky in the sense that you're basically after every instruction you're looking to see whether that break point has been triggered so this can substantially slow down the execution of code if you're trying to debug a race condition this is not the way to do it because by turning on this conditional break point you're going to slow the code down enough that the race condition may not happen so use this sparingly um and only if you need to have a particular uh if it's a short duration run and it's not going to cause you any specific timing related issues then obviously you can use conditional break points if it will if it is a timing related problem don't use conditional break points use hardware break points instead um they're a much better way of being able to do some matching you have to be a little clever because obviously you can't say break on line 55 if x is greater than 5. um yeah that's that's a very handy thing to be able to do just understand that that's going to change the execution speed of the code the more of those things that you have in there and active at any one point in time the slower the code will run so use conditional break points sparingly obviously use them when you have to but don't use them if you just because you want to use them only when you really need them we can also issue a series of commands to be hit when a particular breakpoint is set so if i do for instance here after uh breakpoint and main then execute the following commands and then we'll type all the commands in and we'll end that last command with an end statement and then every time it hits that break point it will automatically execute all of these commands um absolutely handy for being able to hit a breakpoint and displaying a a data structure for instance every time you hit this breakpoint saves you a lot of typing i mean that's that's really the the key thing here is to try and save people from having to do a lot of typing now uh if i'm using one of the gui front ends like ddd i have this little dialog box that pops up over here um the uh that comes up i see here the run command i have the interrupt command so if the application is running and i press the interrupt button it will stop the application wherever it was when i hit the interrupt button i have step next so step will step one instruction it will stay one c source line for instance one source code line but it steps into functions so if i'm calling print and i issue the command step it will then step into the print function itself that of course you probably don't have the source code to so you're looking at assembly language and that's a fairly common mistake um when we're just tinkering around with gdb uh and we're not necessarily used to all the functions uh people will use the step command because it does step from one instruction to another from one source code line to the next but it steps into functions so if you're stepping into a function that you know is working correctly then you'll want to use the finish command so the finish command says run till you get to the return next we'll call the next line but then step over it so if i was calling a function my function sub for instance then if i used step it would step into the sub function if i used next it would call the sub function but not step into it so we just simply say yes i know that works go ahead and execute it and just continue after you've called that function um we have others uh the continue command uh if we've hit a breakpoint and we go okay i've seen everything i need to see here press the continue button it will continue running until it hits the next breakpoint i can kill the function as it executes so i can kill it off it's doing something that i don't want it to do so just go ahead and kill it i can also use these up and downs these allow me to go up and down through stack frames so let's say i have main calls sub and i'm in sub stack frame i want to look at the value of a variable up in main so i would use the up button the up command that would go up into mains stack frame and i would see mains variable and then i could use the down command and it would go back into subs stack frame so this allows me to move up and down through stack frames especially if i happen to have a variable that has the same name but in different stacks not a good programming practice i would mind i would remind you that but sometimes it happens somebody defines a variable called debug and another team is also working in another portion of the program and they define a variable called debug well when i'm in a function and i call and i do print debug which am i looking at am i looking at the sub functions debug or the main functions debug this up and down give me the ability to control uh which of those stack frames i'm looking at and if you're a real glutton for punishment you can use the step i and next eye the steps instructions so one assembly language instruction at a time um either step or next so definitely uh if you're into assembly language instructions this is a great way of being able to see those uh one of the things that i talked about earlier is the hardware breakpoint and one of the basis that makes the hardware breakpoint what it does is this thing called a watchpoint a watchpoint allows me to uh watch either an address or a symbol name and stop the application when one of the several things is happening i can tell it to watch it if i watch it then if it gets written to it will stop if it's red it doesn't stop if i do an r watch address or symbol then it will stop even if the variable is red and then i have some other variants here that says stop watch if thread 3 is modifying it so if i have multiple threads inside the application i can be very specific i'm only interested in stopping if this variable is being modified by thread number three and then we can get into conditionals as well stops when the contents of a particular variable is greater than five so this would be another option to your conditional break point but in this case it uses hardware breakpoints and therefore doesn't have the same overhead that a conditional breakpoint would have if we were using standard software breakpoints so here is an example of this i have a break point at main i'm going to tell it to run and it hits the break point and i then tell it to watch the variable x and continue well when i modify x it's going to immediately hit the breakpoint and show me the old value of x and the new value of x so it shows me what it was before it got modified and what it was after it modified but i'm still setting now at this location where it got modified i can now uh do a little bit more debugging here in terms of figuring out okay what happened is everything okay why did it do this et cetera et cetera we can also debug threads we can do an info threads that'll show me all the active thread ids i can then select a thread by id and i can specify set a breakpoint in a particular thread so other applications other threads can re reach out and touch that same break point and it won't fire unless it is the thread that i specified the thread id for um and then if i have a case where i've hit a thread break point i can then also tell it to show me all of the back traces for the threads so when i hit the break point i can have it set up um the possibility of stopping the entire process and all of its sub threads that's the default by the way or i can specify using this set scheduler locking where i can then limit the execution to a particular thread so i can either stop when i can stop the entire application when a thread hits the break point i can stop just the thread that hit the break point i can do either of those things by messing around with a scheduler locking mechanism uh now also we have the ability to generate core dumps now core dumps are kind of a kind of a lost art if you will the idea behind a core dump is it's going to take a memory snapshot of everything the register sets the instruction pointer the stack pointer everything that was executing at the time of the malfunction by default this is turned off inside of linux we can use the u limit command to turn them back on and in ulimit we have to specify the maximum core file size in 512 byte blocks why 512 bytes well because that used to be the sector size back in the old days so um this is normally turned off because if you have core uh if if you have an application that terminates it'll leave a core dropping which is a big chunk of memory that's basically been written off to disk and people will forget about those things and they have a tendency to collect so the default case in linux is to turn off core dumps we can turn the core dump back on and then when we encounter an application it will that terminates it will then turn around dump the core i will then be able to use gdb to load the application and the core file back into memory and it will show me exactly where the application terminated and i will see the reason that it terminated and all of the memory and the register sets that were associated with the application at the time of termination will then be visible to me now understand this is post mortem debug this is not something that you're going to be able to then continue execution from that point it's going to stop the application the application is dead but it does give me the ability to then turn around and look at what was happening inside the application at the time of termination and this also works with most of the gdb front ends so whether it's ddd or eclipse or insight or any of those front ends it all works with all of them you can also use it in 2d mode if you happen to be you know limited in terms of your graphics capabilities so all of that just uh it works the way it should work now uh remote debugging with gdb and gdp server this is another uh thing that happens and this is a case where i don't necessarily want to be running the debugger on the target the reason i don't want to run the debugger on the target is because the debugger is very intrusive to the target what i want to be able to do is i want to be able to run a particular application under the auspices of the debugger but not run the debugger itself on the target that's where the gdb server comes in now in the case of the gdb server the gdp server is a very small executable i think it's like four six actually maybe six k bytes in size it's really really tiny but what it does is it allows me to attach to an executable piece of code i can attach to a running piece of code or i can run a piece of code under the offices of the gdb server when i run that code under the auspices of the gdb server i can then connect to it from the host via say tcp ip or an rs232 link it has several different mechanisms for being able to do this and then i can sit and debug the remote target so as long as i have a network connection somewhere to the remote target i can actually debug code on the remote target and here's how something like that would work i have gdb server so this is on the target itself gdb server the ip address of the host and a port number on the host i then have the application that i'm going to be debugging and in this case i put it in background mode just simply so i get my console back you don't really have to put it in background mode if you've got multiple ssh sessions going to the target or something along those lines then on the host i can do target remote and the ip address of the target and the port number that it's sitting on and these port numbers are just numbers that we made up um there 1929 i have a good friend of mine from the old days who always use the date of the stock market crash uh here in the united states back in 1929 because nobody else uses that particular um port number for any of their real applications so he would always just pick that one as so it kind of hangs over from old times but um then uh at that point in time as soon as i do the target remote i'm connected to the target and i start seeing source code i can also use the file command and from the file command i can then load the executable with all the debugging code in it into the debugger and then once i've loaded it into the debugger then i can start stepping and setting my break points and things of that sort i can attach to a running program uh so i'll specify gdb server the host ip whatever that is and a port number uh like two three four five just pick one uh dash dash attach and the process id that will then connect and wait for the target remote command to happen and then you'll be connected in the debugger if i wanted to do this from within ddd then i would do ddd dash debugger specify the debugger and the application that then tells the ddd front end that i'm using the arm back end and the application that i want it to load and then i would issue my target remote command and i would be connected and debugging the application on the target from the host so definitely a very handy thing to be able to do uh obviously now all that was related to debugging functions precisely um you know there are a ton of additional things that gdb can do we just don't have enough time to go through all of them so we're going to kind of switch gears a little bit here and we're going to take a look at some of the live tracing capabilities that are also useful for doing debugging now functions like s trace and ltrace there are a lot of tools that are available to us and s s trace and l trace are ones that i use frequently because they give me the ability to uh take a look at all the system calls or all the library calls that are coming out of a particular application there are no special compilation flags you do not have to compile the code with the dash g option to use s trace and l trace so what s trace does is it hooks into every system call so let's assume that i'm running an application that's doing something and when i click on this button the application dies but it doesn't give me any message doesn't give me a core dump doesn't give me any details nothing that i can debug against it was executing something when i pushed the button but i don't know what so what i can do is i can run s trace and attach to the application just before i push the button on the ui and as soon as i push the button i will then see all the interaction that application has with the system calls now i can also put a timestamp on this if i want to have kind of more information about timing and we see the example s trace output here this is every function call that's being executed and its return status so this of course very handy for being able to take a look at i sent this function what did i get back from it these are all calling into the system call now you can also use s trace to do things like where am i spending all of my time here we see the dash c option which counts the number of invocations and we see that in this particular application most of our time is being spent in the right call so if my application is slow for whatever reason then i know that this is probably the culprit that i need to look at and i need to be able to figure out why it's so slow we see the number of microseconds per call and the total number of calls now obviously in this case most of the time is consumed in the right call but there's also a fair amount of time being uh you know we're seeing the select call being called frequently and it's probably the next highest contributor to this overall execution time now l trace does exactly what s trace does except it does it for libraries and in the case of ltrace we can l trace uh specific libraries so let's assume that i have a third-party library that was provided to me and i don't have the source code to it but i want to look at the interaction between my application and that third party library well i can hook an l trace up to it and watch every single function call going between my application and the library the output looks just like s trace except that now it's at the library level rather than the system level i can limit the libraries that i'm interested in looking at and i can also limit the functions out of a particular library so maybe i'm only interested in the update me function in library xyz i can then specify an ltrace only show me accesses to update me function in library xyz so i don't have to see everything i just see a few things as i go along and i can limit what that output looks like now a proc file system is a representation of the kernel's information it's basically a dump of the system control block the uh the uh struct task struct that's associated with every application and each process id has its own unique directory information associated with it so uh for instance if i jump out here uh go back to my command line and hopefully it will update for all of you so let's do a clear here uh sudo dash i and then we'll cd into the proc file system every one of those numbers that you see is corresponding to a proc file system entry so if i did a psa x pipe to grep bash and that would show me all the bash applications that are sitting out there um let's take a look at uh uh proc 2219 149. so 22 149.
this then tells me all of the information that the kernel is keeping about this particular process id so for instance i can take a look at the memory map this shows me the executable that's the text segment there's the read-only data segment there's the read-write data segment i have heap memory here so i know exactly where that heat memory is being stored i have locations associated with libraries and again we have the executable and read only data read write data et cetera we also this p here indicates that this is private uh versus an s which would be shared so if i have shared memory segments then i would see them show up as an s these are all private i don't think i have any up there's an s right there so there's a shared one and that's with a modules cache file of some sort but we see the stack we see the virtual system calls so all that information this is the virtual address that it shows up at and this is the offset into uh this particular piece of code as to where this actually got mapped so that's a terribly useful thing i can also take a look at the status and this shows me things like it is currently sleeping there's its task id here are the number of file descriptors that it has the owner who is running this particular application this is the useful stuff down here how much data is in the virtual environment the virtual memory segment how much is stack how much is executable how much are libraries and how many page table entries how much is being taken up in page table entries so uh we can also see signals things of that sort again all very useful things when i'm trying to figure out exactly what's going on inside of an application one other thing that i will show you is if i go back out here to whoops i want to be in slash proc i can look at uh interrupts and this shows me all of the interrupts let me just do this i'll let me shrink it down just a little bit here it shows me all the interrupts across all the processor cores i have a hexa core in this platform it shows me how they're routed it shows me what kind of interrupt they are and what they're attached to so this is very useful i have uh fast eois these are level triggered interrupts these are edge triggered interrupts um these are message signaled interrupts so these are pci express interrupts uh so i can see exactly how my interrupts are happening and which processors are being used most often for servicing a particular interrupt uh let's see here so let's go ahead and close that one and see what we can do about uh wrapping this particular discussion up we have valgrind um and it's valgrind not val grind because it is the gate to valhalla there's helgren valgrind there's a whole bunch of these little tools we have cashgrind which basically looks at locality of reference inside of caches i have heap profilers and helgren deals with posix threads so if there are race conditions inside of threads helgren helps me find those race conditions valgrind is a complete suite of software um it is relatively complex but it does work on arm and it does work on x86 as well as power pc so if you're trying to get into real fine grain debugging to find out exactly what's going on inside of the application processor and how it's interacting with your code valgrind is the key to being able to do some things like that we have gproff which is a profiler in the case of gproff we just simply have to specify the dash pg flag in order to turn on the profiler and then we will run gproff and the executable file it will then produce an output that we can then take a look at uh in some detail it'll tell us little bits and pieces let me show you here an example um so here uh we're looking at code coverage which is also out of jeep cove uh the go the new coverage tool so gcov and gproff they're kind of old tools but they're still very effective things like this for instance if i'm trying to get 100 test coverage i now know that this particular line 13 is never being executed it's never executed at all so that says that my test case isn't exercising percent of the code and when you're doing safety critical types of applications you want to be able to handle all hundred percent of the code we can also take a look at branches which branches have been taken how often they've been taken which ones were never executed and how often those things were executed so definitely a very useful tool in being able to figure out how all of that works we have the linux trace tool kit next generation this is this has been around for a while but it's still a very useful tool because it gives us the ability to instrument the kernel and see the interaction between your host and the target and what's happening inside of the target is it executes a piece of code so it's useful for debugging not only user space code but also kernel space code now lttng has been around as i say for a long time it does have a user interface to it uh here's an example that user interface running inside of an eclipse plugin so i can then see individual applications and see what their execution time was i can then zoom in lots of very cool things for ltt and g o profile is kind of long in tooth these days it is a statistical profiler what it does is it allows me to sample the execution of the code and find out where it was running most of the time so again this is useful kind of like gproff and the s trace dash c option where i'm trying to figure out exactly how much time is being spent in what functions now f trace uh this is steven rosdette he is he and a group of other folks were responsible for creating f trace it's a function tracer inside of the kernel it was actually added way back in 2008 and it was one of the weird cases where the documentation was accepted into the kernel before the code was actually accepted into the kernel but with f trace we have the ability to set up static trace points for event tracing and we also have dynamic kernel function tracing so we can look at the interaction between user space and kernel space or between two individual elements inside of kernel space uh very much like o profile it has to be enabled in the kernel so you have to turn on f trace in the kernel before you can actually use f trace f ftrace has an output a gui front end now called kernel shark um which looks very similar to what we were just looking at with lttng uh it does give us the ability to kind of jump into a piece of code and i can zoom in so you see these little vertical bars here these are kind of like oscilloscope uh sampling areas so i can then say well i want to look at just this piece of the code and it will zoom in on you and then you can continue to zoom in and then you can zoom back out again to see exactly which pieces of code you're interested in so you see the execution here across all the cpu cores and you also see the individual events that were happening inside of this and this is a a nice little gui it is available uh from steven's um website it's also available in most of the major distributions like ubuntu for instance has this available you can just download it and install it using your app get now the problem as i mentioned here isn't that linux doesn't have enough tools it's that linux has too many tools debugging in user space at least is mostly done with gdb or its equivalent lldb if you're using the clang compiler um gproff and gcov s trace and ltrace they're really tools to provide you additional insight as to what's going on then tools like ftrace and lttng give you extremely detailed interactions between the kernel space and your user applications or between kernel space entities for kind of a system-wide view so there are a lot of execution information that's available to us uh one of the questions that came up here uh let's see here can we see the execution time using gdb uh i don't i don't remember anything in gdb that allows you to do that i would then probably pop out to s trace the reason i wouldn't do timing inside of gdb is because gdb because it uses the p trace functions it's going to affect the execution time of code so this is not something that you can you know if you're running something within gdb you can guarantee that the execution time is going to be perturbed because gdb is sitting in there at all so i don't think it would actually have a whole lot of meaning to you if you were to be able to see it inside of gdb um let's see here oh one other thing i'm just about out of time here so uh let me see if i can actually make this work we've been talking a little bit about uh f trace function so let me uh cd here to um uh i always go i always go a little bit long sorry about that um so let's cd to the tracing functions so i've got f trace turned on uh we see all the different options here inside of f trace let's take a look at the available tracers so i have block i o tracers i have wake up real time wake ups i have irq off time i have function calls so i can get into detailed function trees uh let's uh just do something real quick i'll turn on the irq off tracing uh i will take a look here at um some uh do a couple of things just to generate some interrupts and then um okay so let's take a look at the current tracer first so it's irq's off is what's turned on so let's go ahead and turn the tracing on and then i will do a couple of ls's and then i will turn the tracer off and then let's take a look at the trace and this shows me my interrupt off time uh and how long interrupts have been disabled so um there we go that kind of gives you some idea i wish i had a little more time i'd show you a f trace uh with kernel shark running it's kind of cool but uh unfortunately i've run over my time again so there we have it uh we will open it up for q a if there's any additional questions here let me just make sure i've answered most of the questions how does line editing work in tui mode um yes so if you've selected the command line then you can up arrow and it will allow you to scroll through the history so you can then edit the histories there you can just kind of type over them again uh let me see here anything else uh okay so we talked about execution time in gdb um any other questions i know that it was kind of fast here hopefully uh everybody has been able to find the um uh i see i'm doing still doing screen sharing here um everybody has been able to find the uh the charts i have here an application called a migrate let's go ahead and do a make on it i'll just show you real quick what happens when we run kernel shark uh this is going to run the application and it's going to keep it limited to just four different um uh uh cpu cores and then i'll run kernel shark and it helps me if i can actually click toast plus and now go back and run kernel shark and there is the application as it ran this is actually one of stephen's uh test cases where it actually deliberately kind of mashes the cpu to see how quickly things can migrate across so it kind of gives you an idea of what uh what it would look like if you were then trying to drill down into the actual execution of um something using something like kernel shark uh and you can get really really detailed values here i mean you can tell exactly how much time uh what time things took to execute uh how often they did context switches things of that sort very useful tool um and comparable to what you see with lttng but this one is a little bit easier to set up ltt and g requires some uh additional drivers be loaded to the kernel so it's fairly automatic these days but uh f trace is a much faster and easier to work with in my that's my personal opinion but uh and it's probably worth what you paid for it so all of 50 bucks right uh all right so i think uh there's no more questions and i don't want to run into anybody else's time so if you have any questions let me just go ahead and stop the screen share and let's go back just uh to my information in case you want to try and get a hold of me i'll get there up there we go so there's my mail mikey andersonptr gmail.com or i'm on twitter at hungar i don't pay as much attention to twitter as i should but you can definitely reach me there or you can reach me over at linkedin i'm on linkedin as well if there are no more questions then i will turn it back over to the powers that be thank you very much for your attention i hope you had a good time here and got something out of it see you later you
Up Next

13:42
Lead Contamination in Soil: A Scientific Analysis of a Boat Keel Pour
@AcornToArabella
124.2K views•2018-03-30

48:00
Clean Water, Green Concrete & Nickel from Plants: Sustainable Inventions Explained
@business
94.3K views•2025-11-06

54:16
Polymer Environmental Degradation: Mechanisms & Stabilization
@iit
1.8K views•2012-07-10

33:39
How a Student's Question Saved a NYC Skyscraper from Collapse
@veritasium
22.8M views•2025-04-26
Related Study Plans & Knowledge Roadmaps
Structured learning paths in Engineering
engineering
Building Acoustic Levitators: Physics & Arduino
01The Physics of Sound and Standing Waves
02Piezoelectric Transducers and H-Bridge Drivers
03Arduino Programming: Generating 40 kHz Signals
+ 2 more learning modules
14h5 modules
Explore Roadmap
engineering
Building Peltier Cloud Chambers: Particle Tracks
01Cosmic Rays & Cloud Chamber Physics
02Thermoelectric Cooling (TEC) Fundamentals
03Custom Liquid-Cooling Loop Design
+ 2 more learning modules
18h5 modules
Explore Roadmap
engineering
Yagi-Uda Antennas: Modeling, Build & VNA Test
01Introduction to RF and Antenna Fundamentals
02Yagi-Uda Antenna Design Principles
03Antenna Modeling and Simulation in 4NEC2
+ 2 more learning modules
18h5 modules
Explore Roadmap
engineering
ECG Monitor Design: Op-Amps, Filters & Noise
01Electronics & Breadboard Basics
02Op-Amps and Instrumentation Amplifiers
03Bioelectricity and ECG Fundamentals
+ 2 more learning modules
18h5 modules
Explore Roadmap