ECG Monitor Design: Op-Amps, Filters & Noise
Learning Goal: Design and construct a portable, single-lead ECG (electrocardiogram) cardiac monitor on a breadboard, implementing an instrumentation amplifier, active bandpass and notch filters to eliminate noise, and visualizing real-time heart signals on an oscilloscope.
- Prerequisites: High school-level physics (basic electrical charge and circuit concepts). No prior electronics fabrication experience is required.
- Estimated Study Time: 18 Hours
Module 1: Electronics & Breadboard Basics
This module establishes a baseline in electronic fundamentals. You will learn the relationship between voltage, current, and resistance (Ohm's Law), study how to translate abstract schematic symbols into actual hardware connections, and master solderless breadboarding techniques to build circuits quickly and safely.
Recommended Videos
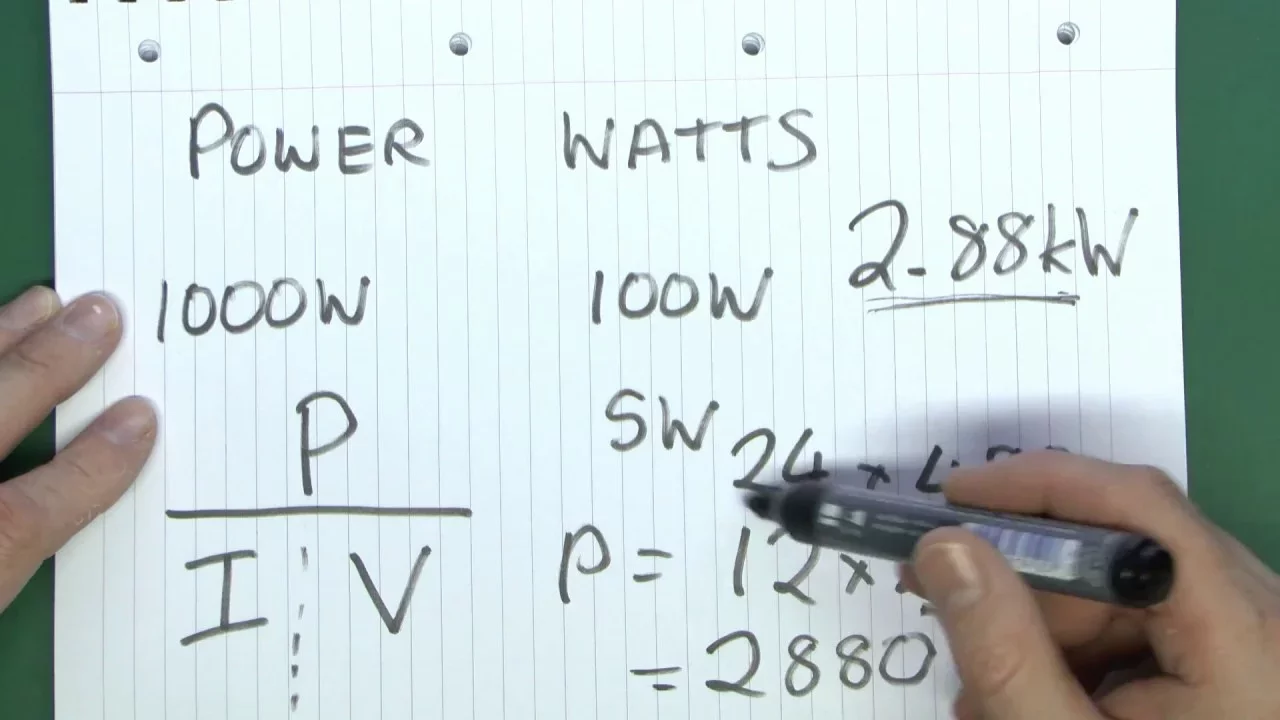
Why this video is valuable: This video provides an intuitive physical analogy for electrical units. It explains voltage as the driving pressure, current as the physical rate of charge flow, and resistance as the constriction restricting that flow. This baseline mental model is critical for understanding how bio-potential signals travel through skin-electrode interfaces.
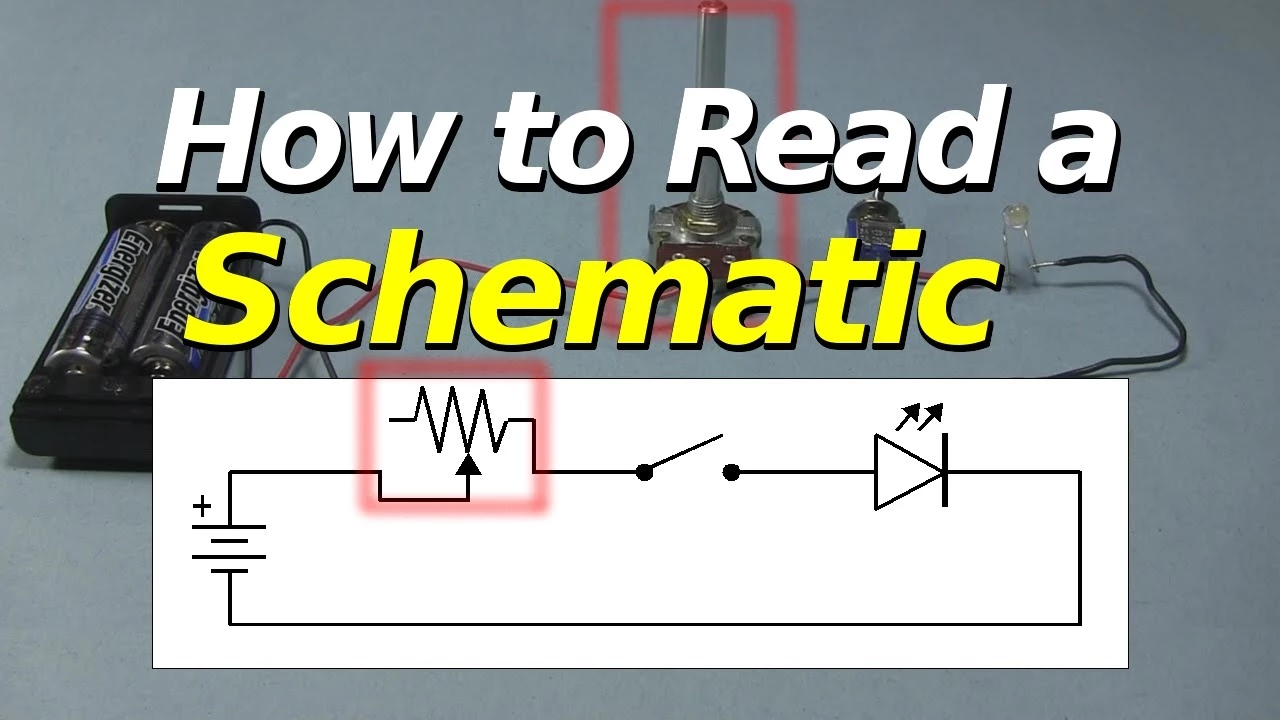
Why this video is valuable: An ECG front-end is composed of multiple operational amplifier stages. This video teaches you how to decipher standard electronic components (resistors, capacitors, power sources) and read schematic connections, specifically explaining how intersecting lines with or without dots correspond to physical junctions.

Why this video is valuable: Solderless breadboards are notorious for introducing stray capacitance and connection errors. This tutorial breaks down the internal structure of horizontal terminal strips and vertical power rails, ensuring you understand how electrical nodes are shared before you start placing sensitive integrated circuits.
Module 1 Knowledge Checkpoint
- State Ohm's Law and explain how increasing resistance in a circuit affects current flow under a constant voltage.
- Distinguish between a junction (dot) and a crossover (no dot) on an electrical schematic diagram.
- Identify which sections of a standard breadboard are connected horizontally (terminal rows) versus vertically (power rails/buses).
Module 2: Bioelectricity and ECG Fundamentals
Before designing amplifiers and filters, you must understand the signal source. This module explores the physiological origin of the cardiac electrical vector, how electrical impulses travel through the heart's conduction system, standard limb-lead placements (Einthoven's Triangle), and the stringent safety rules governing patient-connected electronics.
Recommended Videos
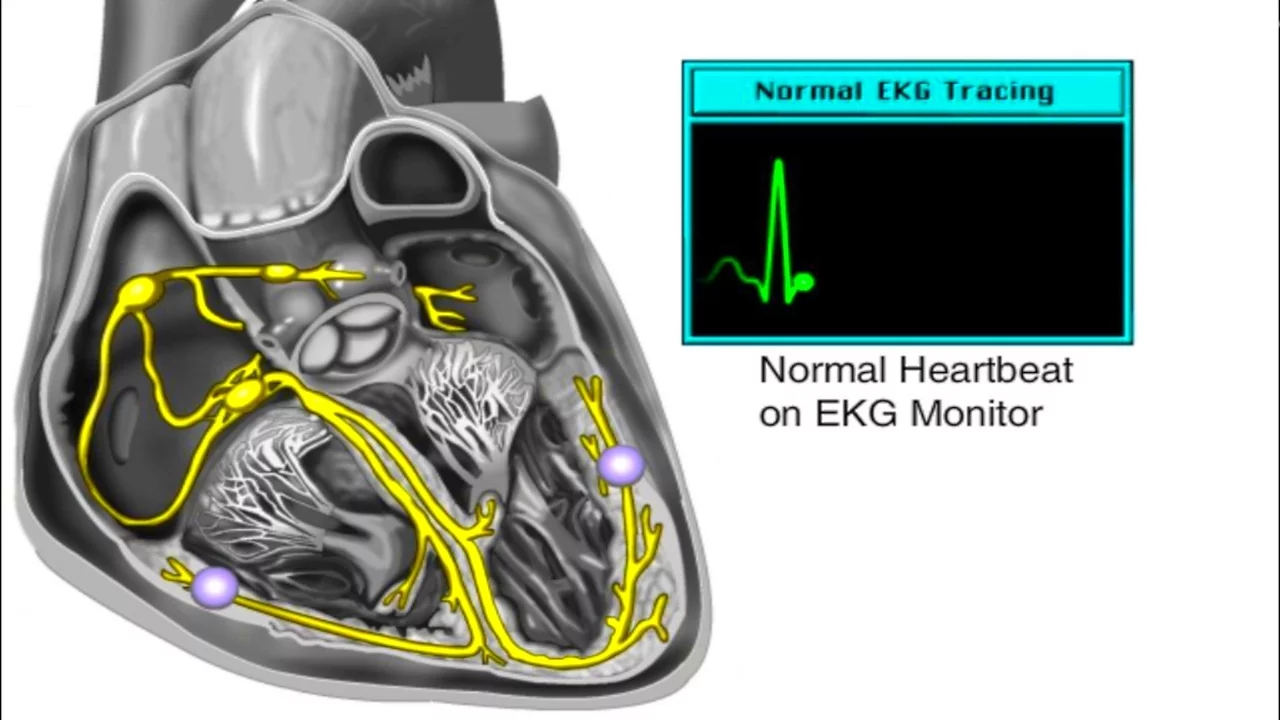
Why this video is valuable: To capture a clean PQRST waveform, you must know what physiological events generate it. This concise medical animation shows the depolarization sequence starting at the sinoatrial (SA) node, traveling to the atrioventricular (AV) node, and moving down the bundle branches to contract the ventricles.

Why this video is valuable: This tutorial breaks down the geometry of Einthoven's Triangle and how standard bipolar limb leads (Lead I, II, and III) measure the cardiac vector. This math is essential for deciding where to place electrodes on your body to maximize the amplitude of the signal fed to your differential amplifier.

Why this video is valuable: Applying electrodes to the body bypasses the skin's natural high-resistance dry layer, making you highly vulnerable to microshock. This video introduces international biomedical safety standards (like IEC 60601), showing why isolating a patient-connected device from AC mains power is mandatory.
Biomedical Safety Note & Independent Study Gap
⚠️ CRITICAL SAFETY WARNING: When building DIY biopotential monitors on a breadboard, never connect the circuit to any power supply plugged into an AC wall outlet (e.g., standard USB mains bricks or desktop power supplies). You must power your circuit entirely with batteries (such as two 9V batteries in series to create a dual rail).
Independent Search Recommendation: Because DIY optical isolation circuits are complex, search for "Optocoupler analog signal isolation circuit for biomedical amplifiers" to learn how to electrically isolate your output signal before connecting it to any wall-powered device like a desktop computer or USB-powered oscilloscope.
Module 2 Knowledge Checkpoint
- Draw Einthoven's Triangle, labeling the polarity of Lead I, Lead II, and Lead III, and point out where the positive/negative electrodes are placed.
- Explain which physiological cardiac events correspond to the P-wave, QRS-complex, and T-wave.
- Explain why powering a breadboard ECG circuit with a linear bench supply connected to mains voltage poses a lethal shock hazard, and list two ways to mitigate this risk.
Module 3: Op-Amps and Instrumentation Amplifiers
An ECG signal measured on the skin is extremely weak (typically to ) and is buried in massive common-mode noise. This module covers operational amplifiers (op-amps) and explores how instrumentation amplifiers (like the AD620) use differential inputs and high Common-Mode Rejection Ratios (CMRR) to isolate and amplify microvolt-level cardiac signals.
Recommended Videos

Why this video is valuable: This video provides a straightforward breakdown of the internal architecture and functional pins of a basic operational amplifier. It establishes key concepts like differential input terminals, open-loop gain, and basic feedback loops required to understand how active filters manipulate analog signals.
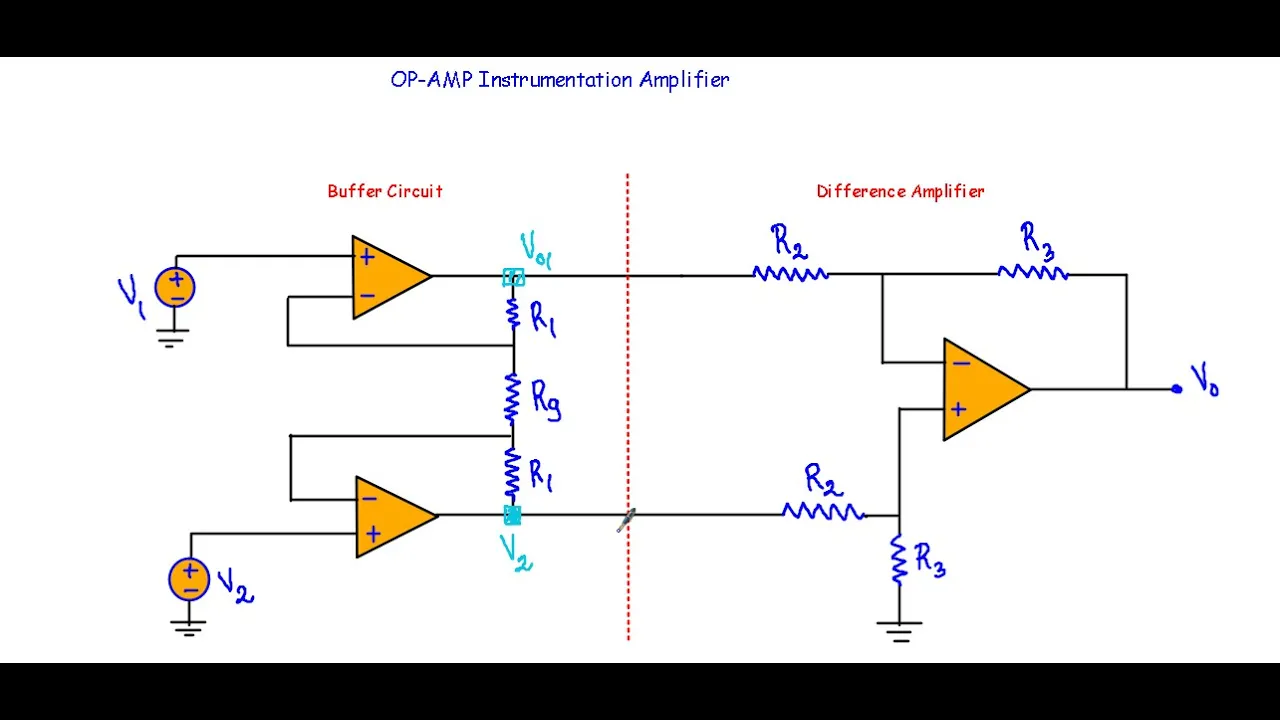
Why this video is valuable: This tutorial mathematically explains why a standard difference amplifier is insufficient for bio-sensing. It reviews the three-op-amp instrumentation amplifier design, showing how the high-impedance buffer stage prevents electrode loading while amplifying only the differential voltage ().

Why this video is valuable: A comprehensive design walkthrough of a physical ECG circuit. The presenter maps out the schematic implementation of the AD620 instrumentation amplifier, demonstrates how to calculate the gain resistor (), explains the function of the Right Leg Drive (RLD) circuit for noise cancellation, and details how to construct a dual rail supply.
Module 3 Knowledge Checkpoint
- State the Golden Rules of Ideal Op-Amps and explain how they relate to the high input impedance of an instrumentation amplifier.
- Calculate the gain resistor value for an AD620 instrumentation amplifier to achieve a gain of approximately 50, using the datasheet formula:
- Explain the purpose of a Right Leg Drive (RLD) circuit and how it improves common-mode rejection compared to simply grounding the patient's body.
Module 4: Active Bandpass and Notch Filter Design
Even with a high-CMRR instrumentation amplifier, your raw ECG signal will contain baseline wander (below ), high-frequency muscle noise (above ), and massive powerline hum ( or depending on your region). This module covers active analog filter design using op-amps, capacitors, and resistors to isolate the cardiac signal.
Recommended Videos
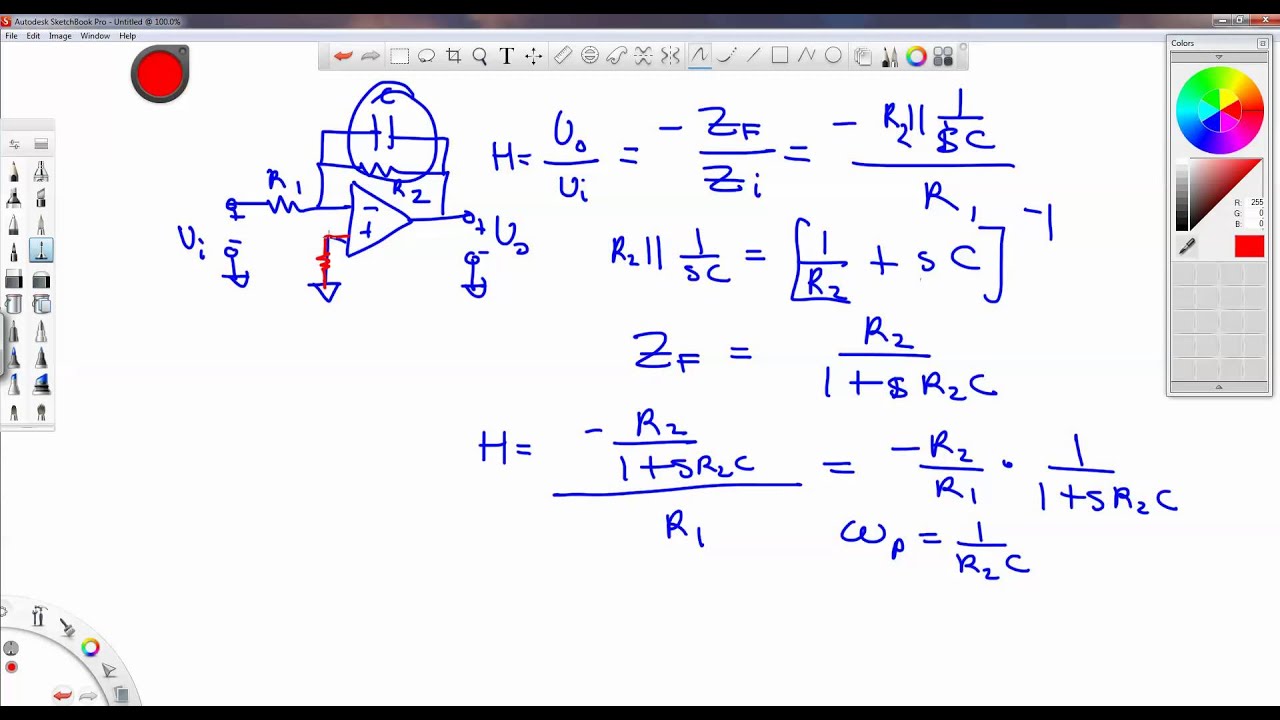
Why this video is valuable: This video teaches the design equations, circuit layout, and frequency response analysis for active low-pass filters. It covers the active op-amp configuration (Sallen-Key or basic first-order active filter), helping you select the appropriate resistor and capacitor values to set your low-pass cutoff at roughly .
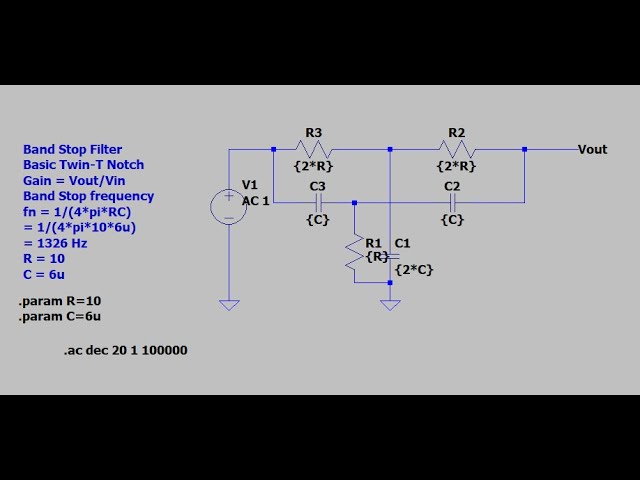
Why this video is valuable: Power lines radiate a strong magnetic and electric field that couples into electrode leads. This video uses LTSpice to simulate a Twin-T Band Stop (Notch) filter. It demonstrates how configuring the passive networks in a feedback loop allows you to target and reject a single narrow band of frequencies ( or ).

Why this video is valuable: An advanced, mathematically rigorous breakdown of multi-stage active filters. It explains how to combine a low-pass filter and a high-pass filter in series to create a bandpass filter (with a passband of to suitable for diagnostic ECGs), and discusses the Twin-T notch topology using op-amp buffers to sharpen the rejection curve.
Twin-T Component Matching Warning
💡 PRO-TIP FOR FABRICATION: A Twin-T notch filter relies on highly precise component symmetry. Standard resistors have a tolerance, and capacitors can vary by to . If your component values are off by even a tiny percentage, the notch frequency will shift away from and fail to eliminate the mains noise.
Action step: Use a digital multimeter to measure and hand-select resistors and capacitors as close to your calculated theoretical values as possible, or use high-precision () metal film resistors.
Module 4 Knowledge Checkpoint
- Calculate the cutoff frequency () of a first-order high-pass filter with and . Verify if this is suitable for removing baseline wander ().
- Draw the basic schematic diagram of a Twin-T Notch filter, noting the relative values of the three resistors (, , ) and three capacitors (, , ).
- Explain how cascading a high-pass filter with a low-pass filter creates a bandpass filter, and list the ideal low and high cutoff frequencies for a standard cardiac monitor.
Module 5: Breadboard Assembly & Oscilloscope Visualization
With your design finalized, it is time to build and verify the hardware. This module covers step-by-step assembly, oscilloscope operation, signal visualization, and systematic debugging strategies for isolating parasitic noise and circuit faults on a breadboard.
Recommended Videos
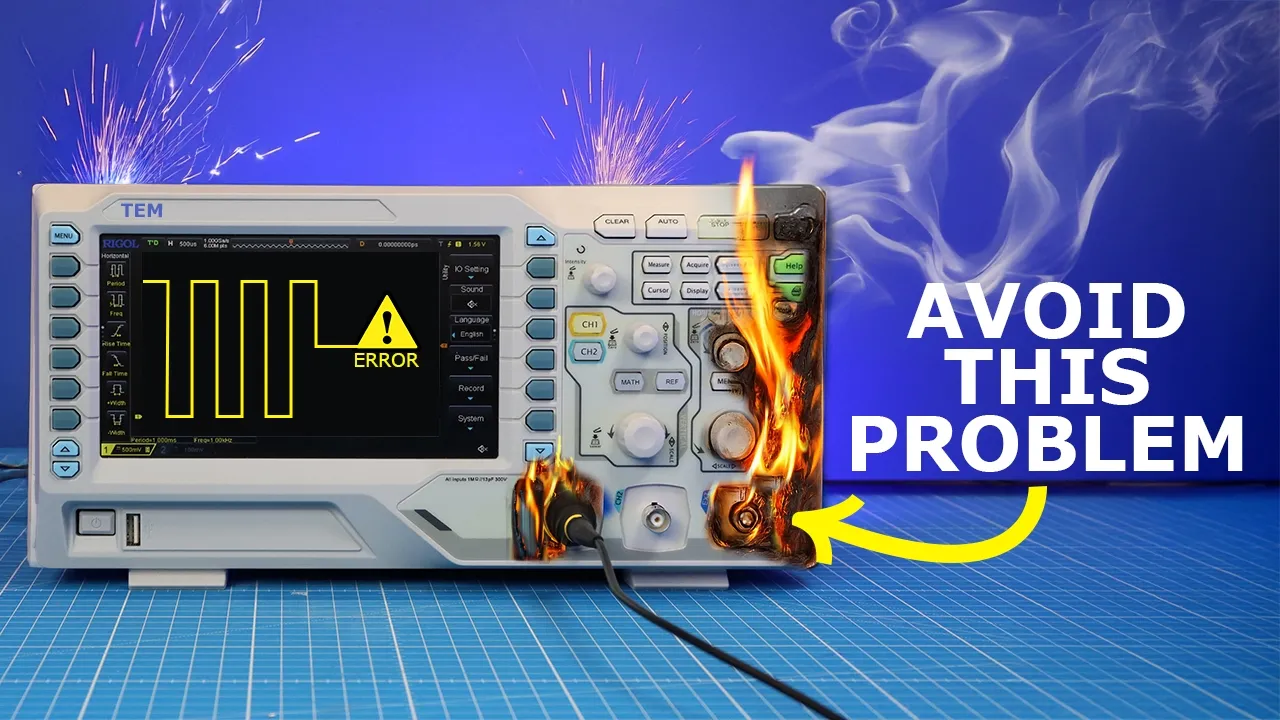
Why this video is valuable: You cannot verify your ECG circuit without visualizing the output. This beginner-friendly guide teaches you how to operate an oscilloscope, explaining how to set the vertical scale (volts/division), the horizontal timebase (seconds/division), and how to configure a stable trigger to capture a pulsing cardiac wave.
![Electrocardiography, Simple ECG Circuit Using OP-AMPS [DIY]](https://i.ytimg.com/vi/sIrTu5LuSZw/maxresdefault.jpg)
Why this video is valuable: This video acts as a complete physical reference build. It shows a step-by-step assembly of an ECG front-end on a standard breadboard using operational amplifiers, walking you through physical component placement, wiring, and electrode connection to help you verify your layout.

Why this video is valuable: Analog biopotential circuits rarely work perfectly on the first try. This video introduces a disciplined diagnostic methodology. Rather than guessing, you will learn to test your circuit sequentially: first verify power rail stability, then measure the input signal, and finally inject test signals to test each stage (amplification, notch filtering, bandpass filtering) individually.
Multi-Stage Analog Troubleshooting Guide
If you don't see a clear PQRST wave on your oscilloscope, follow this diagnostic checklist:
- Check DC Power Rails: Measure the voltage at the VCC and VEE pins of every single IC relative to virtual ground. You should see steady, equal positive and negative voltages (e.g., and ).
- Isolate the Instrumentation Amp: Disconnect the filters and measure the output of the AD620 directly (Pin 6). You should see an amplified, though noisy, cardiac signal riding on a DC offset. If this signal is flat or clipping at the rails, check your electrode connections and your resistor wiring.
- Trace Stage-by-Stage: Reconnect the active filters one by one. Probe the output of each op-amp stage. If the signal dies after passing through a filter stage, check for swapped resistor/capacitor pins or incorrect op-amp feedback loop wiring.
Module 5 Knowledge Checkpoint
- Demonstrate how to set the trigger level on an oscilloscope to capture a periodic signal without waveform drift.
- Explain how a "virtual ground" is created when powering a circuit with two 9V batteries, and explain why it is used as the reference potential for your electrode inputs.
- List three sequential diagnostic steps to execute if the output of your multi-stage ECG circuit shows only flatline noise or is stuck at the positive power supply rail.
Course Map
Key People Index
- Willem Einthoven (1860–1927): A Dutch physiologist who invented the first practical electrocardiogram (ECG) and described "Einthoven's Triangle," the mathematical and physiological basis of standard limb electrode configuration. He was awarded the Nobel Prize in Medicine in 1924.
- Harry Nyquist (1889–1976): An engineer who made fundamental contributions to signal processing and feedback amplifier theory, establishing the criteria for analog filter stability and the Nyquist sampling rate necessary to digitally capture analog signals without aliasing.
Final Self-Assessment
Complete this comprehensive checklist to verify that you have achieved the target learning goal and constructed a functional, safe cardiac monitor:
- Schematic Literacy: I can confidently read an analog circuit schematic, identifying differential amplifier inputs, active filter feedback paths, and dual-rail power symbols.
- Physiological Understanding: I can explain the physical origin of the cardiac vector and state why the PQRST waveform correlates to specific mechanical actions of the heart muscle.
- Strict Safety Compliance: My breadboard circuit is powered entirely by batteries, and I have confirmed there is no direct connection to AC wall outlets or mains power.
- Instrumentation Amp Operation: I have constructed an instrumentation amplifier stage (using an AD620 or equivalent) with the correct gain resistor () to amplify differential input signals while rejecting common-mode noise.
- Active Bandpass Filtering: I have constructed and calculated an active bandpass filter stage that successfully permits frequencies from to to pass while attenuating baseline drift and muscle tremors.
- Twin-T Notch Performance: I have designed and simulated (or verified with precision components) a Twin-T notch filter configured to eliminate or powerline noise.
- Breadboard Structural Integrity: My circuit layout is logical, uses decoupling capacitors near IC power pins, minimizes long loop areas that act as noise antennas, and establishes a stable virtual ground.
- Signal Visualization: I can operate an oscilloscope to set appropriate vertical voltage ranges ( at the filtered output), horizontal sweep rates (), and trigger parameters to display a stable, clear real-time heart rate waveform.