

![مراجعة شاملة على الفصل الأول | التيار الكهربى [ تالتة ثانوى ]](https://i.ytimg.com/vi_webp/I-IvfIGTLww/maxresdefault.webp)







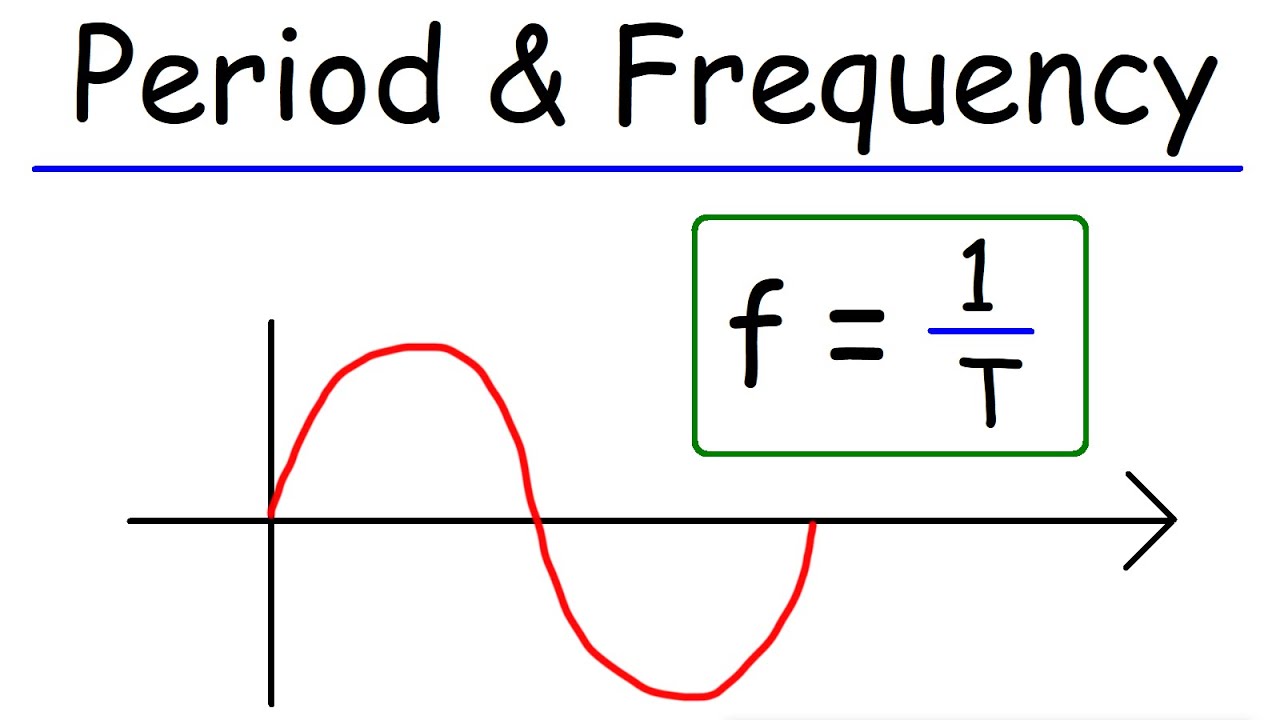


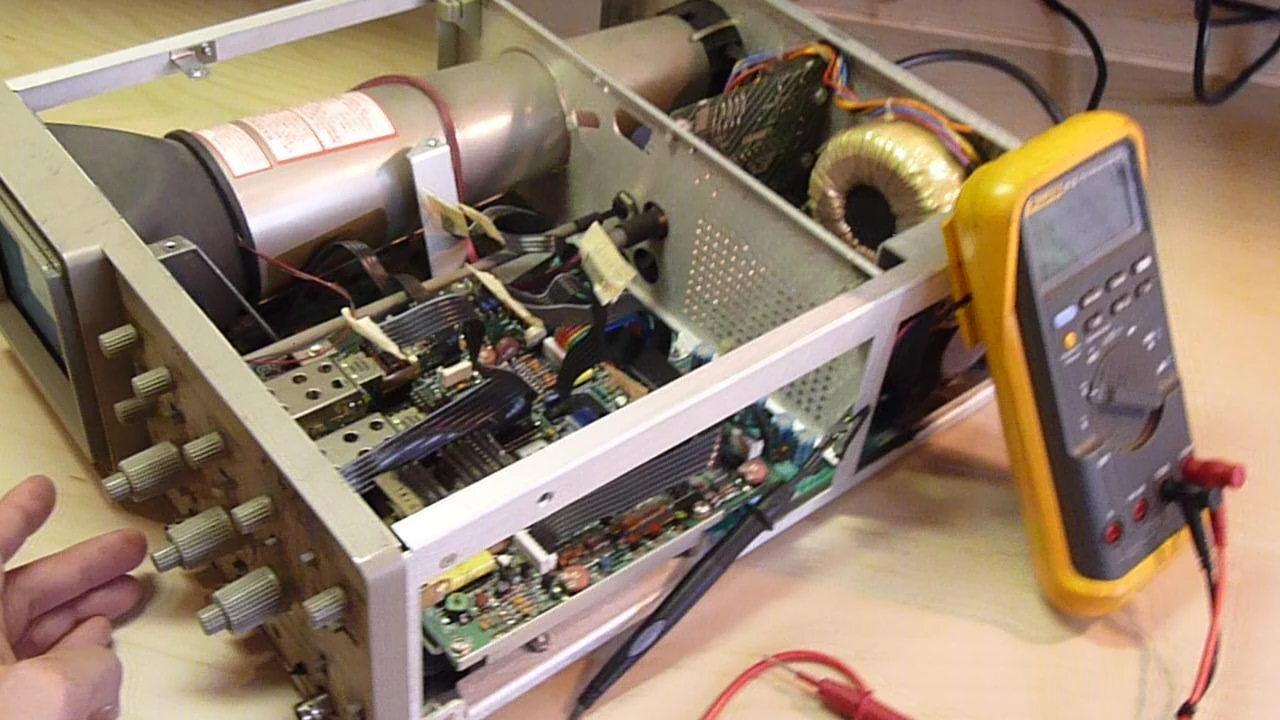


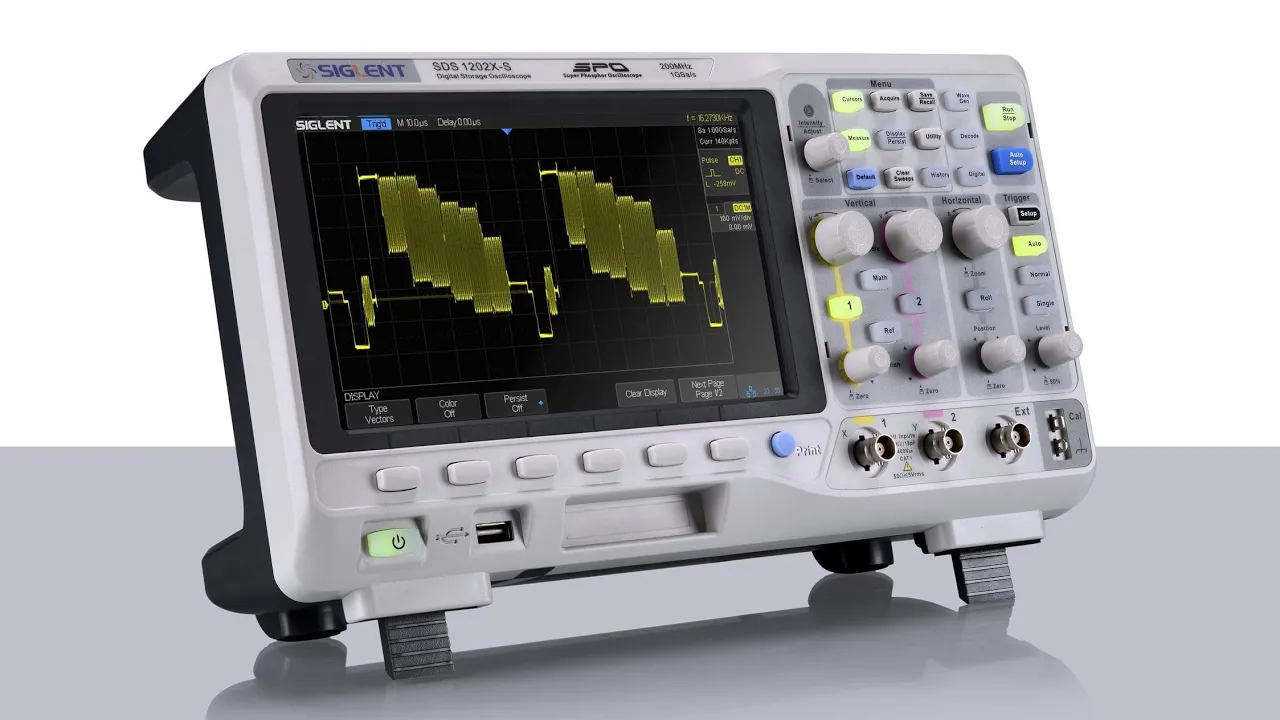









An oscilloscope visualizes voltage over time as waveforms, unlike multimeters that provide single numerical values; key specifications include bandwidth (maximum measurable frequency) and sample rate (measurements per second, ideally 5-20 times the signal frequency), with proper probe calibration, ground connection to common reference points, and trigger settings essential for accurate signal analysis; practical applications include measuring current using clamp probes or shunt resistors, analyzing capacitor behavior through time constant measurements, observing PWM signals, and characterizing components like LEDs and diodes through IV curve plotting.
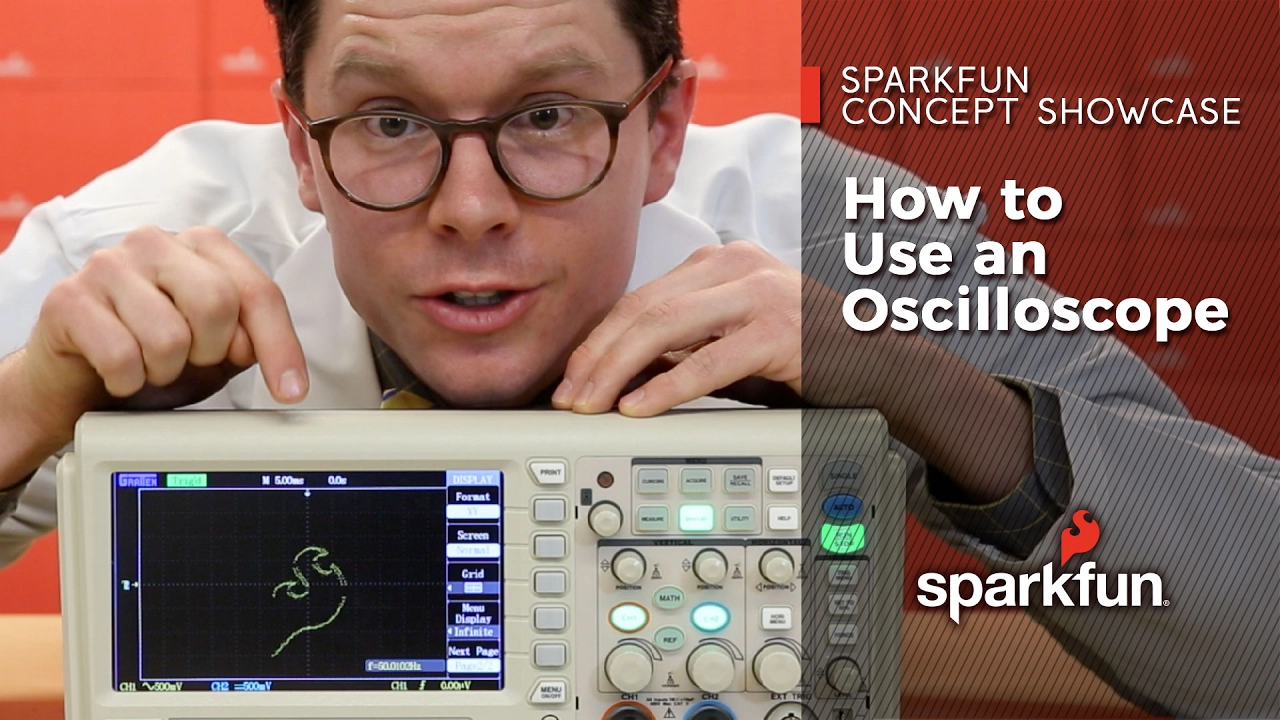
How to Use an Oscilloscope: A Beginner's Guide for Electronics
Added:Understanding basic electrical parameters such as Voltage (V), Current (I), and Resistance (R), including Ohm's Law.
Distinguishing between Direct Current (DC) and Alternating Current (AC) signals.
Familiarity with foundational wave properties such as amplitude, period, frequency, and phase.
Basic safety practices in electronics, specifically regarding grounding and handling live circuits.
Advanced triggering techniques (e.g., pulse width, runt, and video triggering) to isolate complex signal anomalies.
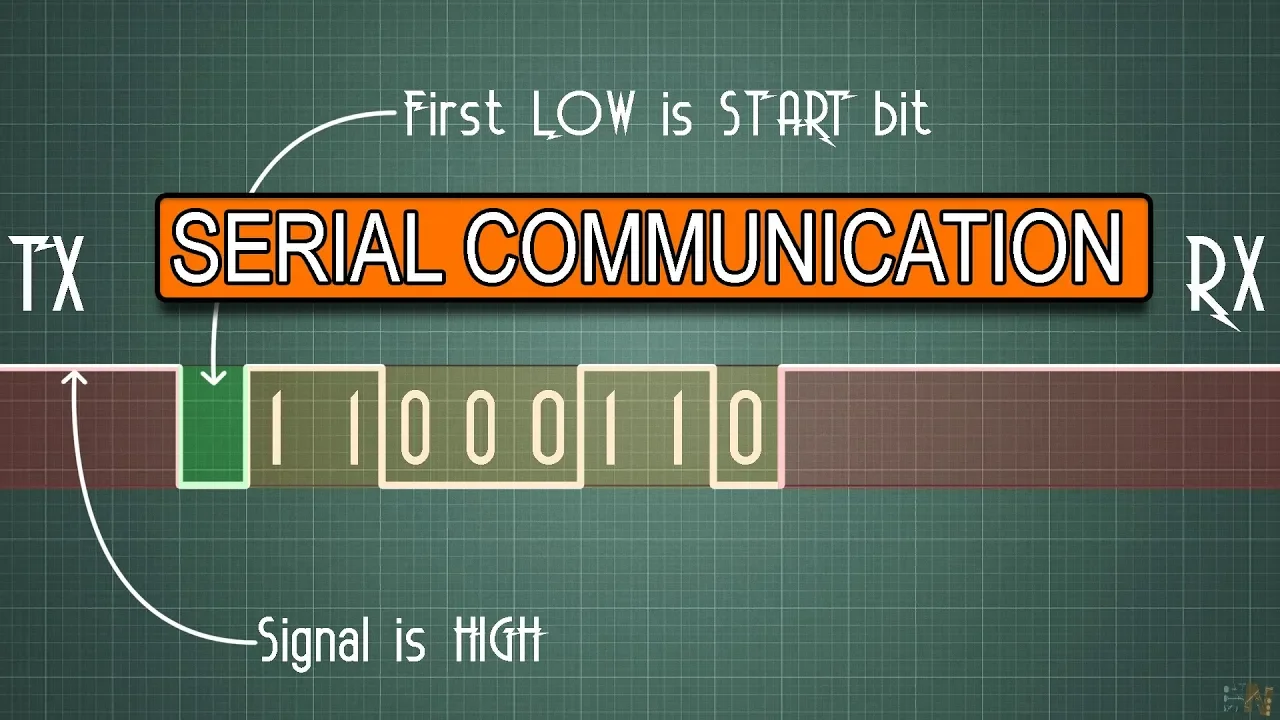
Using serial bus decoding features to analyze digital communication protocols like I2C, SPI, and UART.
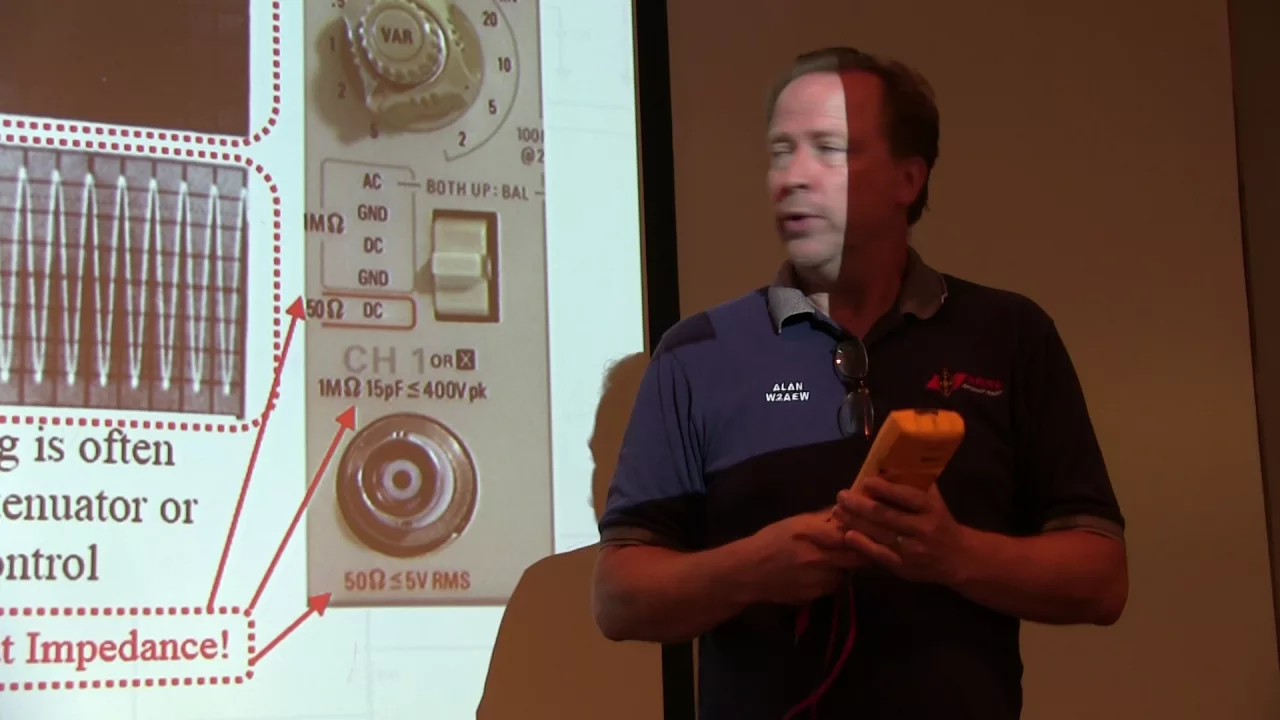
Understanding probe loading effects, attenuation settings (1x vs. 10x), and when to use active or differential probes.
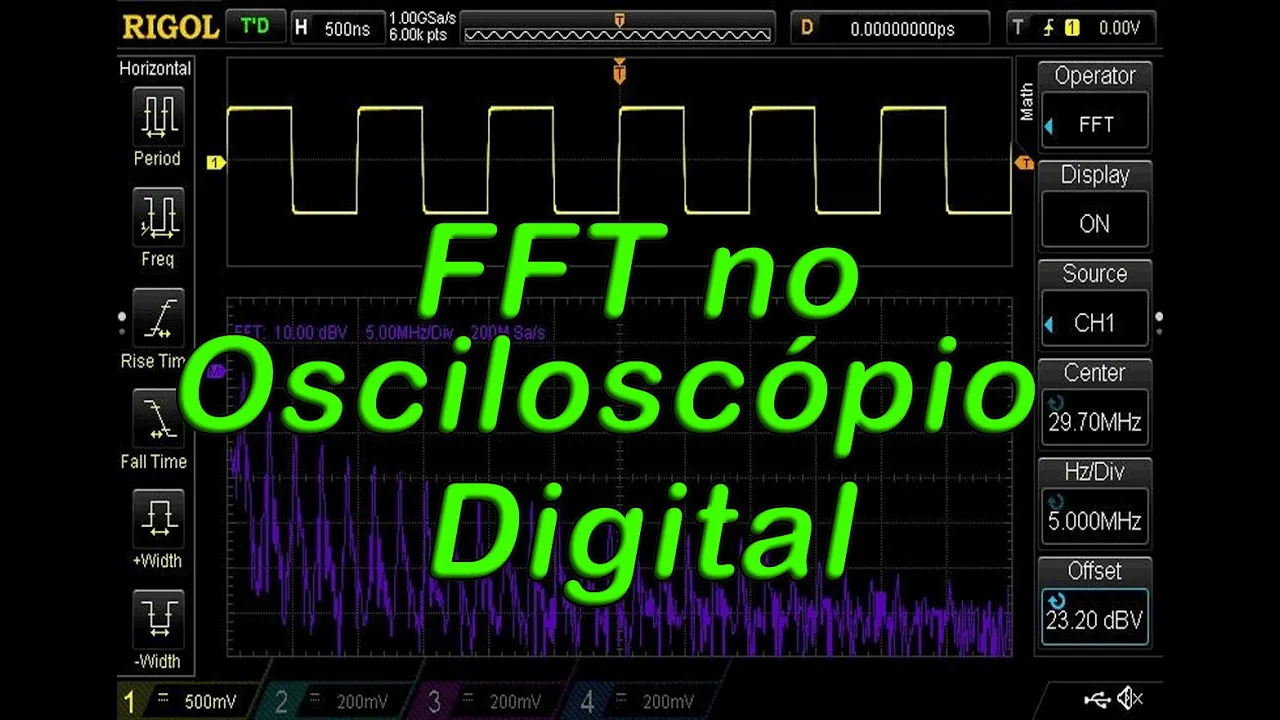
Applying Fast Fourier Transform (FFT) analysis on the oscilloscope to perform basic frequency-domain spectrum measurements.
488.3K views11.8Klikes35:07Original Release: 2025-04-14
This power supply says it's providing 3 Vs. This multimeter confirms that, but this oscilloscope shows that's not quite true. It's a terrible 3 V. For comparison, this 3V battery pack provides this clean, constant voltage signal, but it's also not 3 V. So, a multimeter will tell you a value, but the oscilloscope lets us visualize what is really happening. It can even show cool graphics like this. The problem is they look very complicated and they can be damaged if you use them incorrectly.
But I'm going to show you how to use one step by step in this video which is sponsored by Brilliant. A multimeter quickly tells us values for voltage, resistance, current, capacitance, etc. But the oscilloscope will only show us voltage and time which we call a signal.
That signal might be a flat line. It might be a sine wave. It might be a square wave, a pulse, or something more complex. We can also measure current with a few tricks, but I'll show you that later on in the video.
Oscilloscopes all look fairly similar.
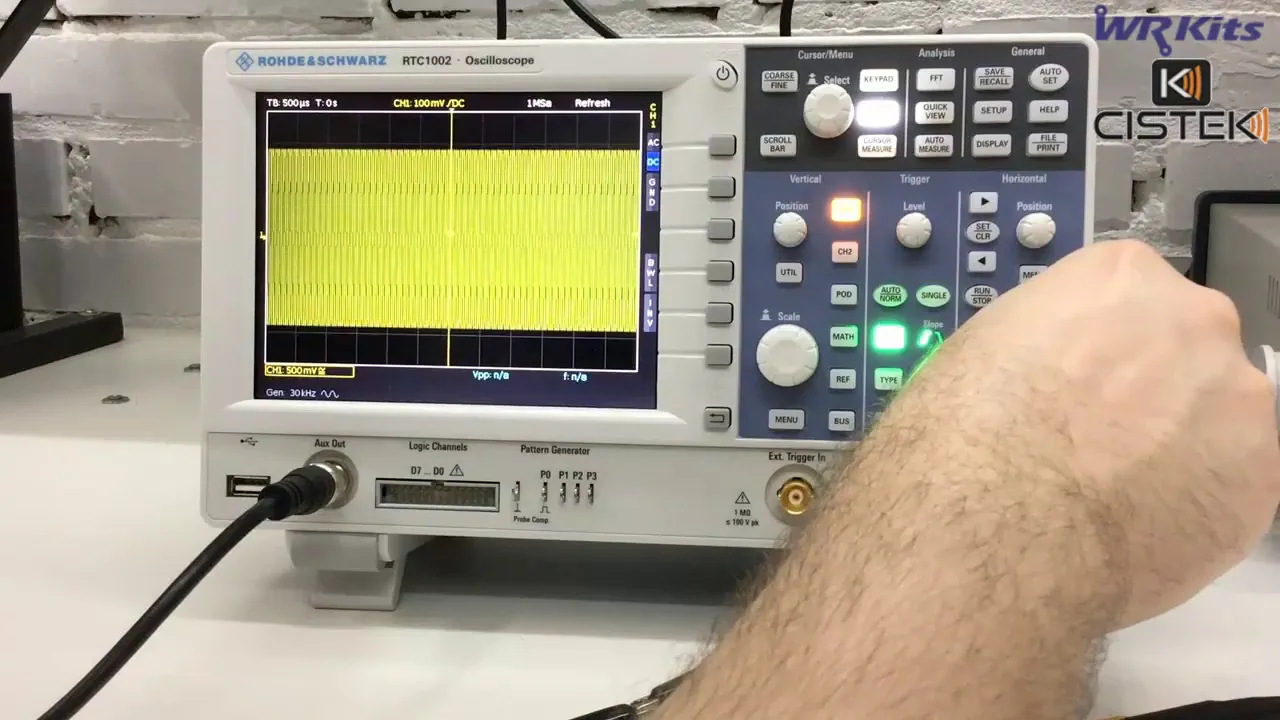
Notice they all have a horizontal section, a vertical section, a trigger section, and an area of additional functions. And then we have some signal inputs, which we call channels. These will all be in slightly different places, so get to know your oscilloscope. This is a typical entry-level version, perfect for beginners. Then these low to mid-range amateur versions give you more functions and usually more channels. This more high-end version has even more functions, but less buttons because it has a large touchcreen. Most of them will state their bandwidth and sample rate. The bandwidth is the maximum frequency the device can reliably read a voltage signal. For example, if we had a 50 and a 100 MHz oscilloscope and we try to measure this 10V peakto peak sine wave signal at 10 MHz they both read near the true value. But as the frequency increases the voltage reading becomes less accurate even though they can both still measure the frequency.
So, a higher bandwidth is better, but it's expensive and you might not need it. Most of these also state a maximum sample rate of 1 giga sample per second, meaning it takes a measurement of the waveform up to 1 billion times per second. This is fine for general electronics, but high frequency signals will need more to accurately reconstruct the signal on screen. The sample rate usually reduces when you add another channel. The general rule is to ensure that the sample rate is 5 to 20 times the signal frequency of interest. Okay, let's just use it. Plug in your device, press the power button, and in a few seconds, you should see just a blank screen with a grid. Your device will probably have two or four channels. This is how many signals you can view at once. For example, you'll need two channels to view the input and output signal of a circuit at the same time.
The channel terminals are usually colorcoded, which match the signal profile on the screen. And you can also clip corresponding color tags onto the probes. The channels use BNC sockets, and the probes use BNC connectors. For channel one, gently push and rotate the connector until it slides on. Then slowly rotate it to lock it into place.
At the other end, we have the probe tip and the ground clip. We always connect the ground clip to the common ground of our test circuit. The probe tip touches the point of interest. On the probe handle, we usually have an attenuation switch. For now, just select the 10x option. You might see a signal on screen like this. Your probe is just picking up ambient noise. Touch the probe and ground clip and this will disappear.
Your device should have some metal tag sticking out like this. Connect your ground clip to the one with a ground symbol. Then pull down on the probe tip to expose a small metal hook and attach this to the other pin which has a symbol or wording like this. We should now see something on screen. But first, press the channel one button and check that DC coupling is selected and that the probe setting shows 10X. Now, press the auto button and the scope will automatically adjust the scale to see the signal.
Congratulations, you have just displayed your first signal. It's a square wave.
However, we can see this one isn't quite square. That's because the probes are new. So, let's calibrate them. Press the auto button again and select the single period option. You can also use the vertical and horizontal scale to improve the display. Looking at the probe handle, there should be a small hidden compensation screw or it might be on the connector. Take the adjustment tool that came with your probe and slowly turn the screw until you achieve a square wave like this. You don't need to do this every time, but do check periodically.
If you are super proud of your first signal or any signal after that, just insert a USB device into the port. Then press the print button and it will save a screenshot to the device. If you want even more information, press the storage button to access the menu. Then select the CSV file type, then choose the location and the file name, and you can then view the details on a PC. If you have played around with all the settings and you want to undo these changes, just press storage, then find and press the default option and the device will reset back to factory defaults. But for now, press the auto button to bring the signal back. This grid on screen is plotting the voltage on the vertical axis and time on the horizontal axis.
Each square on this grid is called a division. In the bottom corner of this device, it tells us that each division is 500 molt. There are six squares. So, this is 3,000 ms, which is just 3 V. If we turn the vertical scale dial to the left, the time changes to 1 volt per division. The height of the signal reduces, but we can still count 3 volts using the grid. The scale dial jumps between voltage steps, but press channel one. change the setting to fine and we can make smaller adjustments if needed.
We can also move the vertical position dial to move the signal on screen. If we rotate the horizontal scale dial, it will increase or decrease the number of cycles displayed. The time per division will also change. Here we see it is 200 microsconds per division. The signal repeats every five squares. That's 1,000 microsconds, which is 1 millisecond per cycle. From that, we can easily calculate the frequency of this signal.
But if we press the measurement menu button to display the horizontal options, then select frequency, it will automatically display the value on screen. If you then press the cursor button and change the mode to auto, you can see the two lines it's using to measure the frequency automatically. If you change the mode to manual, you can move line one then line two and the difference between these is shown in the display as 1 millisecond. And from that we can calculate the frequency. We can also select the horizontal lines then move these lines to measure the voltage which in this example is 3 V. If we rotate the trigger dial, we see the trigger line and corresponding trigger voltage will change. If we go above the signal, the screen goes crazy.
Press the stop button at any time to freeze or unfreeze the screen. Here we can see the signal has refreshed at random places. That's because the oscilloscope doesn't know where to show them. Press run and then bring the trigger level down until the signal stabilizes. The signal is continuously refreshing. It will overlay the new measurement on top of the previous and it will align them between these two points. This lets us see the signal clearly instead of just a random mess.
The trigger menu shows it overlays when it detects a voltage increasing up to 1.5 volt. We could change that to a decrease and the screen changes. The single trigger option is great for capturing events, but I'll explain that in the inrush current section of this video. If you take a 9V battery and connect the ground clip to the negative and the probe to the positive, we see a positive voltage line. The ground provides the reference. So, we measure from 0 vol up to 9 V. If we reverse the probe connection, 9 volt becomes the reference point. So we effectively measure down to zero. But the oscilloscope shows a negative voltage because it measures the difference between these two points. Using the multimeter continuity function, we can see there is a direct connection between all of the channel grounds. There is also a connection between the ground clip and all other channel grounds. This has a very low resistance. So we always connect the ground clamp to the ground reference point. If you try to clamp this midcircuit, all of these points become that voltage. If you use two or more probes, they must all connect to the same ground reference point. If one of the probes is connected to a different point, you will create a short circuit and the current can bypass the circuit and flow straight through your oscilloscope to ground. There is also a direct connection between the probe ground and the power supply ground pin.
While the oscilloscope can measure main's AC voltage, you shouldn't try this with a standard probe set. That's because the ground and neutral are connected in your main electrical panel.
So, if you accidentally connect the ground clip to an energized part, you create a short circuit and a huge current will flow straight through your device and that might destroy it. Make sure you have ground fault protection on the circuit which can detect this and cut the power. If your test circuit is battery powered, then you should be fine, but not if it's USB charging, and that's because this can provide a direct path to ground. Sometimes people try to avoid the ground pin on the oscilloscope power cord. That is a bad idea. If you accidentally connect to an energized part, the circuit isn't complete. So the ground fault protection won't activate but all metal parts on the oscilloscope become electrified which is dangerous.
If you must connect to a main's AC circuit, you should use a differential probe set like this which isolates the circuit from your device. But remember, electricity is dangerous and can be fatal. You must be qualified and competent to carry out any electrical work. I'd like you to build this circuit. Just pause the video to see the diagram. Don't worry too much about how it works for now. Your circuit should look something like this and use a 9volt battery. Connect your ground clip to the ground rail and probe pin 3. Press the auto button and adjust the scales to see the signal which is a pulse. We can adjust the width of the pulse with the potentiometer. We can zoom in and see the pulse isn't perfect. We can add a capacitor between the positive and ground rail and notice it will improve this. Now connect your channel 2 probe and enable the channel. Ensure 10x is selected on the probe and the channel settings along with DC couple. I have channel one at 2 V per division, but I'll use 5 V for channel 2. Connect the ground to the same reference point. Then connect the probe to the positive rail.
Congratulations, we now have two signals displayed. Channel 2 is the input voltage and channel one is the output voltage. Notice on channel 2 there is a dip. If we remove the capacitor, it will get much worse. So, anything connected to this positive rail would receive this distortion. So, I'm going to put it back. See if you can improve this further and tell me what you tried in the comment section. Now zoom out to see the full cycle. The signals are not aligned so they aren't the same height.
I will adjust the position of channel 2 and then change the scale to 2 V. Then also change the position of channel 1 to align them. We can see there is a slight voltage difference because of the circuit components. We can enable the duty cycle measurement. This is the percent of each cycle where the pulse is high. This changes as we adjust the potentiometer. We can also turn on frequency measurement. The frequency is set by the timing capacitor. Different values cause different frequencies. Turn off channel 2 and disconnect the probe.
Disconnect the channel one probe also.
Then with a small force, push the top off the probe to reveal a pointed tip.
Place the insulating cap over the end.
Now we can probe points of the circuit.
This is very useful for SMD components.
Place your probe onto pin 2. You should see a sawtooth wave. This is the charging and discharging of the timing capacitor. We can also see that on the capacitor on pin 6 or on the potentiometer. Now from pin 3, connect a resistor and LED and connect this to ground. When powered, the LED will illuminate. Adjusting the potentiometer changes the brightness of the LED because the width of the pulse changes.
A longer pulse means it's on for longer each cycle and so it appears brighter.
On camera, the LED looks like it's flashing, but the human eye won't see this. It will appear as a constant light. But if we swap the timing capacitor for something much larger, the frequency decreases enough that we can see this with our own eyes. We can also use this circuit to control the speed of a DC motor. We need to modify the circuit with a few extra components. I'm also using a 3V supply for the motor, but the grounds are connected between the two power supplies. The MOSFET is voltage controlled. The pulses turn the MOSFET on and off and it drains through the resistor. The other resistor just limits any current flowing through the 555 timer. This lets us control the speed of the motor using the potentiometer. Connect the ground clip to the ground rail and then connect the probe using a wire to the MOSFET's center pin. We can see this very noisy signal with these large inductive spikes. You might need to adjust the scale, position, and trigger to see that clearly on screen. I'm going to switch to this larger oscilloscope to see that clearly. If I adjust the scale and position, we can see the spikes are enormous. I'll stop the measurements and then use the quick measure function to see the values of these spikes. This happens because the motor is an inductor which stores energy. The MOSFET keeps turning it on and off. So, the stored energy is released suddenly creating surges. This can be very damaging to electronic components. So we add a diode across the inductor to give it a path to dissipate its energy. If we connect a diode across the motor, we can instantly see a huge decrease. I'll adjust the signal and trigger level to see that clearly. We can try other diodes like this one, and we see it has further improved it and reduced the spikes even more. We could also add a capacitor in parallel, and we see that that will clear up some of the noise. But if we add too much capacitance, it will make the circuit worse. So, switch back to the smaller one. We can measure current using a resistor or a current probe. I'm using this entry-level clamp probe, and I'll leave a link for you in the description if you're interested.
Connect it to the oscilloscope, then select the 1 m per 10 milliamp setting.
Check the 10x is selected on the channel options. Then change the unit to amps.
For this example, I'm using two 10 ohm resistors in series. I'll supply the circuit with 5 Vs using a DC power supply. I'm also going to connect a multimeter in series with the circuit just so we can see the values a little easier. You don't have to do this last part. With the power off, clamp your probe around a point in the circuit. A signal will be displayed on screen. It might be a little noisy. I'm using a 100 milliamp and 2 milliseconds scale.
Notice the measurement isn't zero, but the circuit is off. Press the button a few times to correct this to zero. Now power the circuit and we should see the measurement. If your line goes downwards, just disconnect the device and flip it over. It will then be positive. We could count the divisions, but instead I will turn on the cursors, setting one line at zero and the other to the signal line. The difference between these is our current reading.
And we can easily convert this to amps.
We can see it's slightly different to the multimeter reading and also the power supply which we should expect. We can also connect to things like this DC motor to see the current profile and understand the behavior which could be very useful.
If we have a known resistor in the circuit, we can use that to measure current. For midcircuit, the easiest way is to use a differential probe set.
Ensure an appropriate range is selected and that this matches the channel settings on the oscilloscope. Adjust the scale to suit the circuit if needed.
Then probe across the component. The line displayed will be the voltage drop of the component. We can use the grid to measure this or use the horizontal cursor. We know the resistance so we can easily find the current. If you don't have a differential probe set, but you have two standard probes, connect them both to the same ground reference. Then connect channel one to the higher voltage side and channel two with the lower voltage side. Ensure both channels are on the same scale and that they are aligned. We could press the math button and select A minus B. Then select the correct channels. Turn the operation on and it will display the difference on screen as a signal. In this example, it's hidden behind channel 2. So I'll move that. We can then use the horizontal cursor lines to measure this.
Or we could just align the channel then align the cursor lines with the channel signal lines. And the BY ay value tells us the voltage drop. Again, if we know the resistance, we can easily calculate the current. If you only have one probe, you will need to connect to one side, measure and write down the voltage value, then connect to the other side and write down the value. Then calculate the difference between them and from that calculate the current. Another option is to insert a shunt resistor last in the circuit and use one probe.
For example, this lamp is rated for 12 V and 5 W, but I want to power it with 9 V. We can estimate the current from the rated values. Then use Ohm's law to estimate the resistance of the lamp. If we reduce the voltage to 9 V, we should see a lower current flowing. From that, we can estimate the power, which means our shunt resistor needs to be more than this power rating. I'll use a 1 ohm 5 W resistor and connect that into the circuit. Using channel one, connect across the resistor to ground. I'll adjust the scale to see the signal. Then using the horizontal cursors, we see the voltage drop. From that, we can find the current. The true value might be slightly different from our calculation.
But do consider that with the shunt resistor removed, the total resistance of the circuit is slightly different.
And this will change the applied voltage across the load. You might need to account for this. If we place a shunt resistor in series with a switch and motor, then connect the probe across the resistor. When we press the switch, we see there is a jump in current and then it flattens out. But if we change the scale, then press the single trigger button and then adjust the trigger level. Now when I press the switch, we can capture the large voltage spikes.
Using the cursors, we can see these are massive voltage spikes, but over a very short time period. You might need to adjust the scale position and trigger to see that clearly on screen. If we remove the sh resistor from the circuit and connect directly to the switch and then attach the clamp around the motor wire, setting channel one to amps. When I press the switch, we see there is a jump and that it averages out to around 900 milliamps. But if I adjust the scale and the trigger level and I use the single trigger function, now when I tap the switch, we capture a huge inrush current. Again, we can use the cursors to measure this. This capacitor is rated 100 microfarads, but I don't believe it.
Let's test it with a resistor and a signal generator. The charge time depends on the resistor, but the signal generator has an output impedance also.
This is usually around 50 ohms, but we can check this. If you have a multimeter, measure the actual resistance of the resistor and make a note of this. Set your signal generator to sine wave 2V peakto peak 1 kHz. Then connect this directly to your oscilloscope. In the measurement vertical options, select peakto peak to display the value on screen. To clear up the signal, press acquire and change the mode to average and then increase the number which will clean up the signal displayed. Write down this value. Then turn the mode back to normal. Now connect the signal generator across the resistor and then also connect the probe across the resistor. The signal is then shown on screen but the peakto peak voltage will have reduced again. Use the average mode. Write down the value and then turn back to normal. Use this formula and insert your values. Write down your answer which is likely around 50 ohms impedance. Then find the total resistance of the circuit. Then multiply the total resistance and capacitance in farads to find the time constant.
Whatever the applied voltage, the capacitor will be charged to 63.2% of that voltage in this amount of time. The capacitor will be nearly fully charged at five time constants. So multiply this by five. We want to see the full charge and discharge. So double this time. Then take the inverse of this time to find the maximum frequency required. The signal generator needs to be lower than this frequency. Insert the capacitor into the circuit. Connect the signal generator. Set your signal generator to square wave 6 Hz 10V peakto peak. Connect the ground clip to the ground and the probe to the capacitor's positive side. Press auto. But as this is a low frequency, the auto button might not work. So we might need to manually adjust the scale and position.
I'm using 2 V and 20 milliseconds per division. We can see the charge and discharge of the capacitor on the screen. If we use 7 Hz, it's not quite fully charging. If we use 5 Hz, we can see it is fully charged and saturated.
So, we will use this frequency. Adjust the position to center the profile.
Press acquire. Then change the mode to average and use a high number to get a clear reading. Using the horizontal cursors, move line A to the bottom, then line B to the top. There's a 10V difference here. One time constant is 63.2% of this voltage, which is 6.32 volt. So move line B until Y ay shows this value. Now change to vertical lines. Move line A to the very start of the profile. Then move line B until it intercepts the horizontal line and profile. The time constant is displayed in the BX AX value. Convert this value to seconds. Divide this by the total resistance and this will give you the capacitor value in farads which as I suspected is different. If we add a shunt resistor after the capacitor and connect a second probe across this, the oscilloscope shows the voltage drop proportional to the current flowing. We can see there are large spikes as the current rushes in during charging. Then the current rushes out while discharging giving a negative spike. If the signal picks up a lot of noise, you can turn on the filter on channel 2 to limit the bandwidth. Then use the high resolution mode on the acquire menu to clean up the signal. We can make these plots using the XY mode. Connect the oscilloscopes channel one and two probes with the signal generators channel one and two probes. In the horizontal menu, change the time base to XY and apply the split screen. Set both signals to 60 Hz sine waves 10 volts peakto peak. Align the two signals displayed. Then increase the scale and we should see a diagonal line.
As we increase the phase shift on channel two, the line will change and display a circle at 90°. If we adjust the frequency of phase 2, we see these patterns which change depending on the ratio and the phase shift of the frequencies. This is useful for identifying phase relationships and synchronization of signals, but I'll let you explore this topic further yourself.
We can also use these to plot voltage and current profiles of components. Connect the component, in this case an LED, in series with a 10 ohm resistor and connect the circuit to your signal generator, which will supply a 100Hz sinewave 10V peakto peak.
Connect oscilloscope channel one across the entire circuit. Connect channel 2 across the resistor. We should see a signal like this. If not, you might need to adjust the scale. We can see the LED is off up to this point where it just starts to conduct and begins emitting light. This is our threshold voltage. We can use the cursors setting ax to 0 volt and then move bx to this threshold point to find the voltage value. If you apply a low frequency, the LED will flash and you won't get a clear measurement. too high of a frequency and the results are too messy. So 100 htz works well. If we switch to a white LED, we can see the threshold voltage is a much higher value. This typical diode has a much lower threshold voltage compared with an LED. This xener diode shows the forward and reverse profile at the same time.
We explained earlier why you shouldn't connect your oscilloscope to a main's voltage using the standard probes and why you shouldn't remove the ground pip.
Remember, electricity is dangerous and can be fatal. You should be qualified and competent to carry out any electrical work. Here I have a cheap battery powered inverter. I'll connect to this using the differential probe set. Selecting the higher range on the probe and the oscilloscope channel. I'll then insert the probes into the device and we can see the signal. We can turn on the RMS voltage measurement and see around 220 volt. But look at the signal.
This is not a nice smooth sine wave like a power outlet provides. These sharp sudden edges can damage your electronics. So be careful what you connect to it. For the remaining examples, I'm going to use the signal generator which is safer. Connect channel one to the signal generator and apply a 10V peakto peak 1 herz sine wave. Press auto and notice the oscilloscope can't find the signal because it's too slow. Manually adjust the scale to 2 V and 200 milliseconds per division. Then change the position to see that signal clearly. Press the horizontal menu and change the time base to roll. We can then see the signal update in real time. This only works with slow signals. Anyway, change the time base back to YT. Notice by pressing the clear button, we can completely replace the signal on screen. Now, change your signal generator to 60 Hz.
Notice the screen will fill up because there's now more cycles being displayed per second. Adjust your scale to around 5 milliseconds to see it clearly. Now, increase the voltage to 12 V and see how that changes on screen. Disconnect your devices and connect the signal generator across a 1 koohm resistor. Then connect channel one across this resistor. We can see the time per division on screen. So we could count the number of divisions to estimate the time period. We can adjust the scale and position to help make that easier. Or we can use the vertical cursor lines. Move cursor A to the starting point of the cycle and move cursor B to the end point. The bx AX measurement tells us the time period. We can easily calculate the frequency from that or we press the measurement menu button. Then under the horizontal options, turn on period and frequency which are then displayed on screen. If you press the cursor button, then select the auto mode, the lines appear and show where the oscilloscope is taking its measurements from. On the vertical measurement menu, we can turn on the peakto peak voltage measurement. Notice it's slightly lower compared to the signal generator because of the resistor. If we remove it, we can see the change happen. Another common measurement is to turn on the RMS voltage, but we can calculate it manually. Our scale is set to 2 volts per division. So we have around 12 volts peakto peak. And from that we can calculate the RMS voltage using this formula. Or we could use the horizontal cursors moving line A to the lower peak and line B to the upper peak. The BY ay value shows the peakto peak voltage. We can then use this formula to calculate the RMS voltage using a 60 Hz 10V pto peak sine wave. If we insert a diode into the circuit like this, it will block the negative half of the cycle. If we reverse it, it will block the positive half. LEDs only work in forward bias. So if we add two LEDs in parallel and opposite polarities, only one LED illuminates depending on the diode's orientation. If we remove the diode from the circuit, they will both blink at different times. We can slow the frequency further to see that clearly.
If we arrange four diodes in this configuration and then we add a resistor across these two points and then we connect our oscilloscope across that resistor and then we connect the signal generator across these two points. We can see the negative half has been turned into a positive. We have therefore converted AC into DC. It's a terrible DC but it's DC. If we add a capacitor across the resistor, we can start to smooth out the ripples. Adding a larger capacitor will start to bring that into a straight DC line. This is a full-wave bridge rectifier, which is a very useful circuit. To design this circuit properly requires a lot of math, which can be difficult to understand.
But with Brilliant, you learn by doing.
Their newly updated math courses help you visualize and build your algebra and calculus skills. The graphics and interactions just bring it to life, making learning a fun and easy journey.
Brilliant helps you get smarter every day with thousands of interactive lessons in math, science, programming, data analysis, and AI. All the skills you need to become a brilliant engineer.
They even have an app for onthe-go learning, making it easy to build critical thinking skills through problem solving and not memorizing. Each lesson is filled with hands-on problem solving that lets you play with concepts. I think you'll enjoy this, too. So, you can try everything Brilliant has to offer for free for 30 days. Just visit brilliant.org/theengineering mindset or scan the QR code. You'll also get 20% off an annual premium subscription. Do check them out, links down below. Hey, I'd just like to give a huge shout out to our incredible Patreon and channel members. Thank you so much for supporting us. And if you'd like to see your name here along with priority access to our content and behind the scenes footage, links down below for how to join.
Up Next

20:55
Chainbase AVS Node Setup: Eigenlayer Operator Guide for AI Data Network
@cryptoconsole
1.4K views•2024-08-20

12:54
Triumph of Orthodoxy Icon: Byzantine Art & History Explained
@BenCallan
2.1K views•2024-08-06

9:49
FastAPI vs Flask vs Django: Choosing the Right Python Web Framework
@TechWithTim
302.5K views•2024-05-26

1:42
Game of Thrones Opening Credits: A Cinematic Analysis
@gameofthrones
46.3M views•2011-04-18
Related Study Plans & Knowledge Roadmaps
Structured learning paths in General & Interdisciplinary Studies
general-studies
Elevator Engineering: History, Physics & Cities
01From Hoists to Safety Brakes: The Dawn of Vertical Lift
02Hydraulic vs. Traction: The Engineering Physics of Elevators
03Modern Speed, Safety, and Algorithms
+ 2 more learning modules
12h5 modules
Explore Roadmap
general-studies
Rubber: Material Science, History & Geopolitics
01Origins of Natural Rubber & Mesoamerican History
02The Chemistry of Natural Rubber & Vulcanization
03The Geopolitics of the Rubber Boom & Colonization
+ 2 more learning modules
12h5 modules
Explore Roadmap
general-studies
Containerization: Evolution, Logistics & Trade
01Ancient Trade & Bulk Cargo: Amphorae to Barrels
02The Industrial Revolution & Cardboard Packaging
03The Containerization Revolution: Malcom McLean
+ 2 more learning modules
12h5 modules
Explore Roadmap
general-studies
Textile Tech: Evolution, Labor & Global Impact
01Pre-Industrial Textiles: Handloom & Cottage Industry
02Mechanization: The Spinning Jenny to the Power Loom
03The Factory System & Global Labor Transformation
+ 2 more learning modules
10h5 modules
Explore Roadmap