















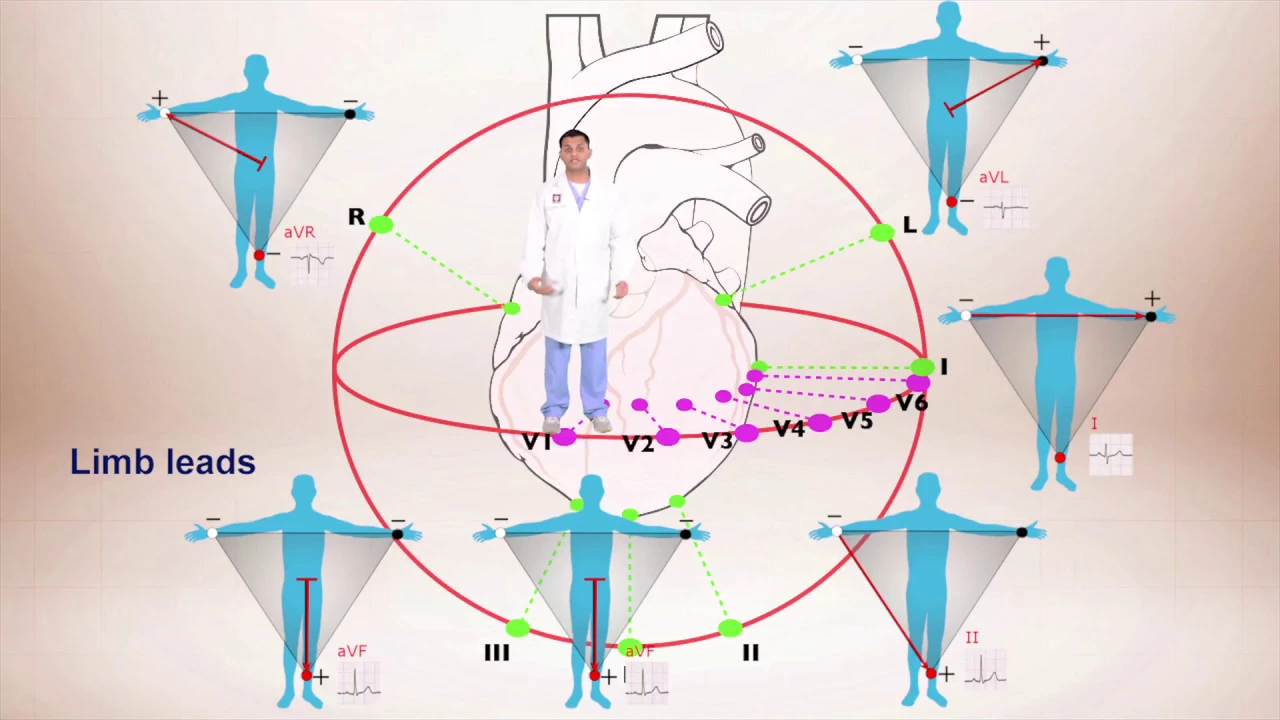


The ECG axis represents the overall direction of ventricular depolarization, calculated using the limb leads (I, II, III, aVR, aVL, aVF) to determine the electrical vector of the heart; normal axis ranges from 0° to +90°, while pathological deviations include extreme right axis deviation (90°-180°) and left axis deviation (-30° to -90°), with causes ranging from bundle branch blocks to hypertrophy and electrolyte imbalances; William Einthoven discovered the EKG and formulated Einthoven's Law, which states that Lead I + (-Lead II) + Lead III = 0, creating the geometric framework known as Einthoven's Triangle that forms the basis for axis determination.
ECG Axis Tutorial: Einthoven's Triangle and Law
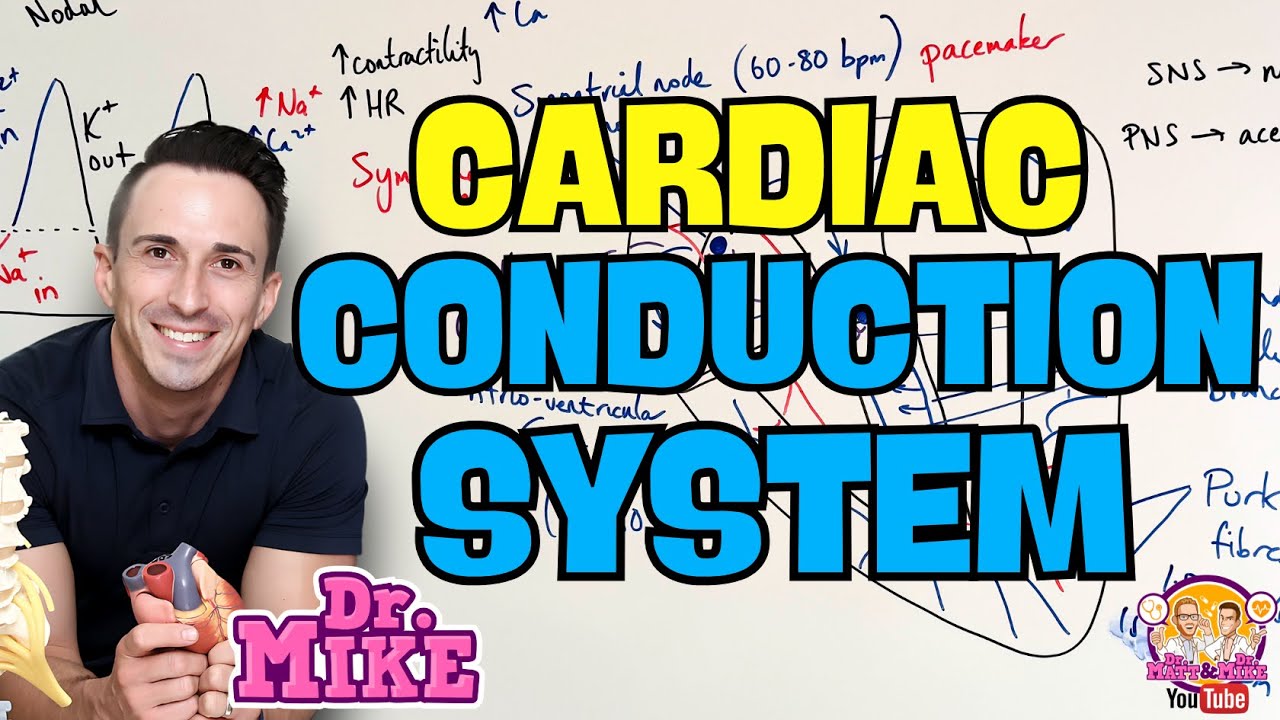
Added:Basic cardiac anatomy and the physiological electrical conduction system of the heart (SA node, AV node, and Purkinje fibers).
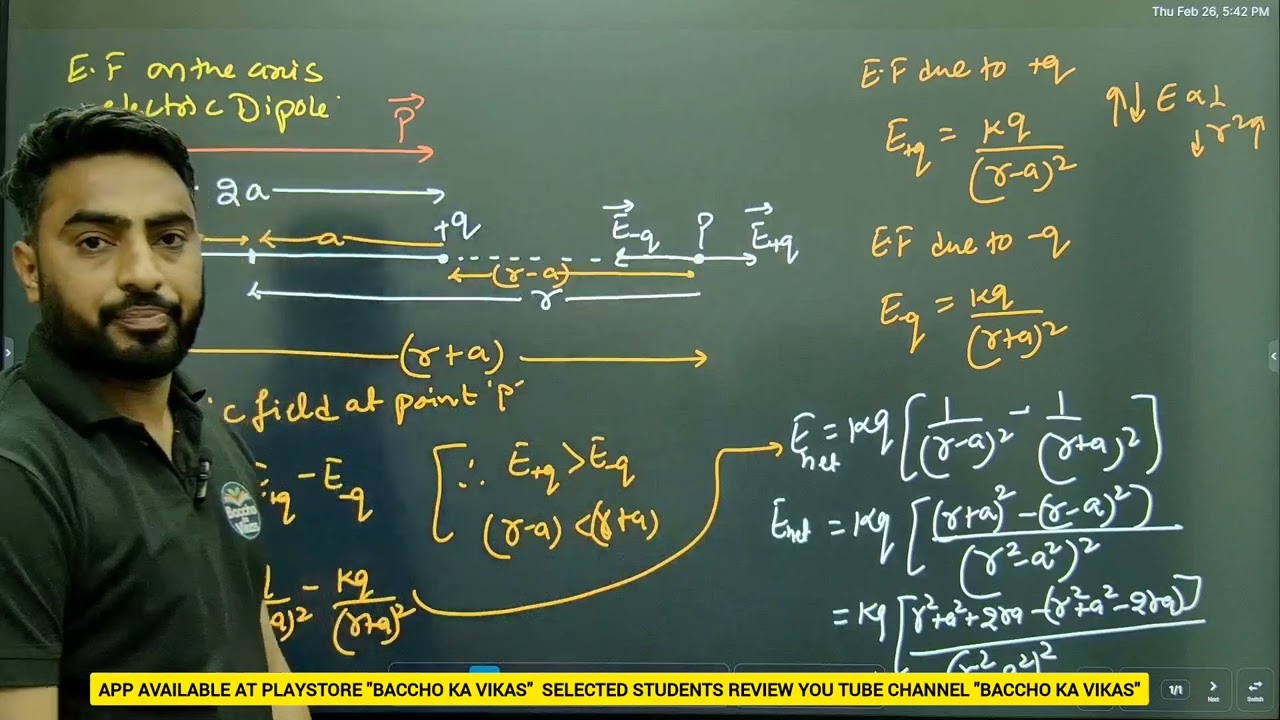
Fundamental concepts of vector mathematics and electric dipoles, including how electrical forces have both magnitude and direction.
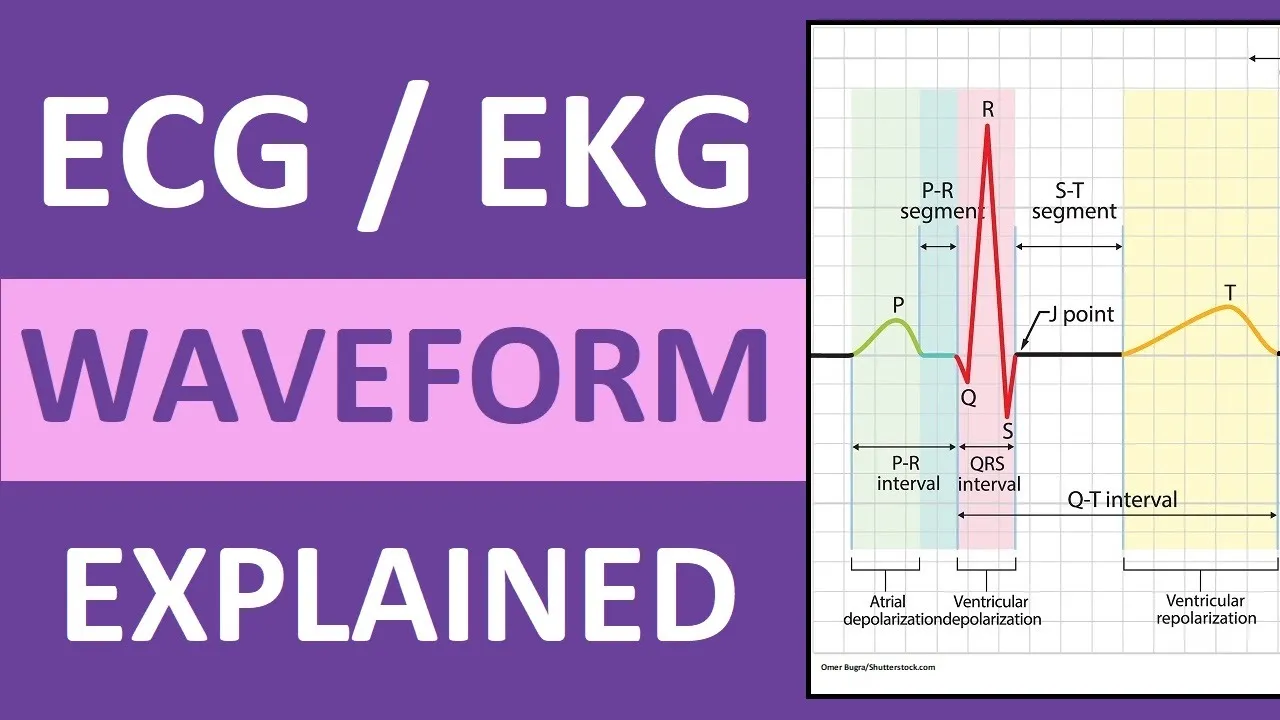
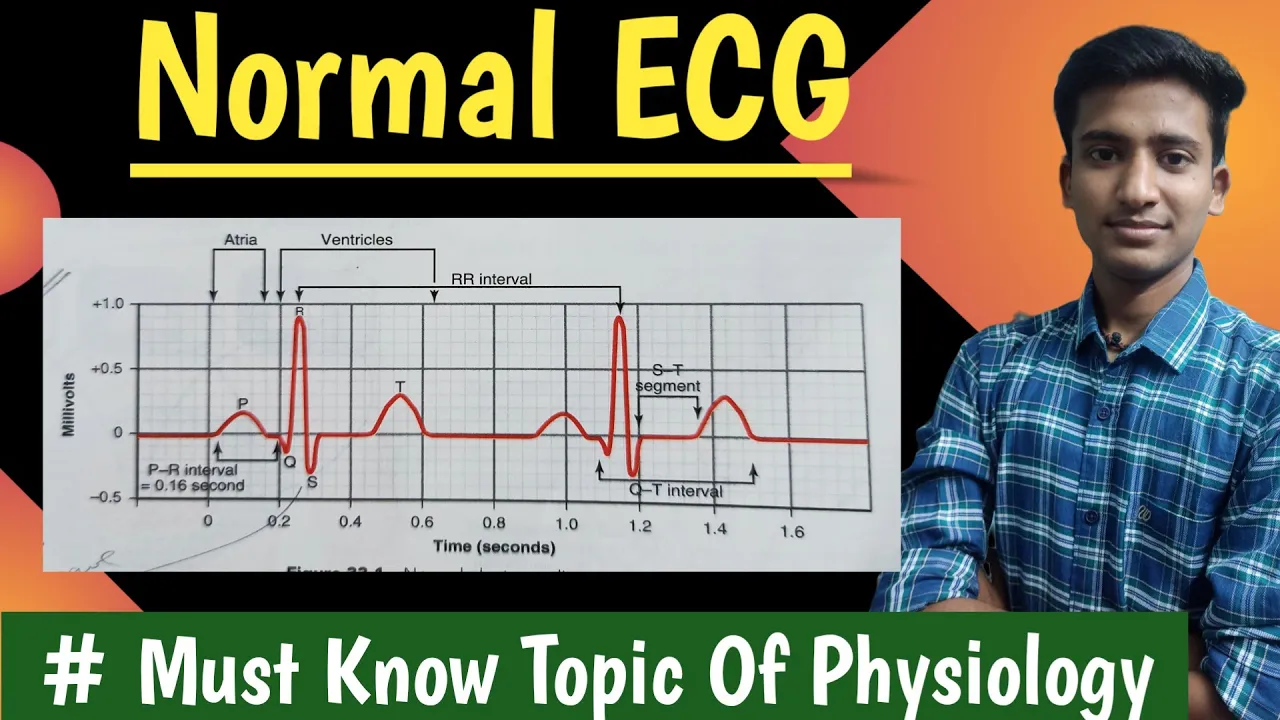
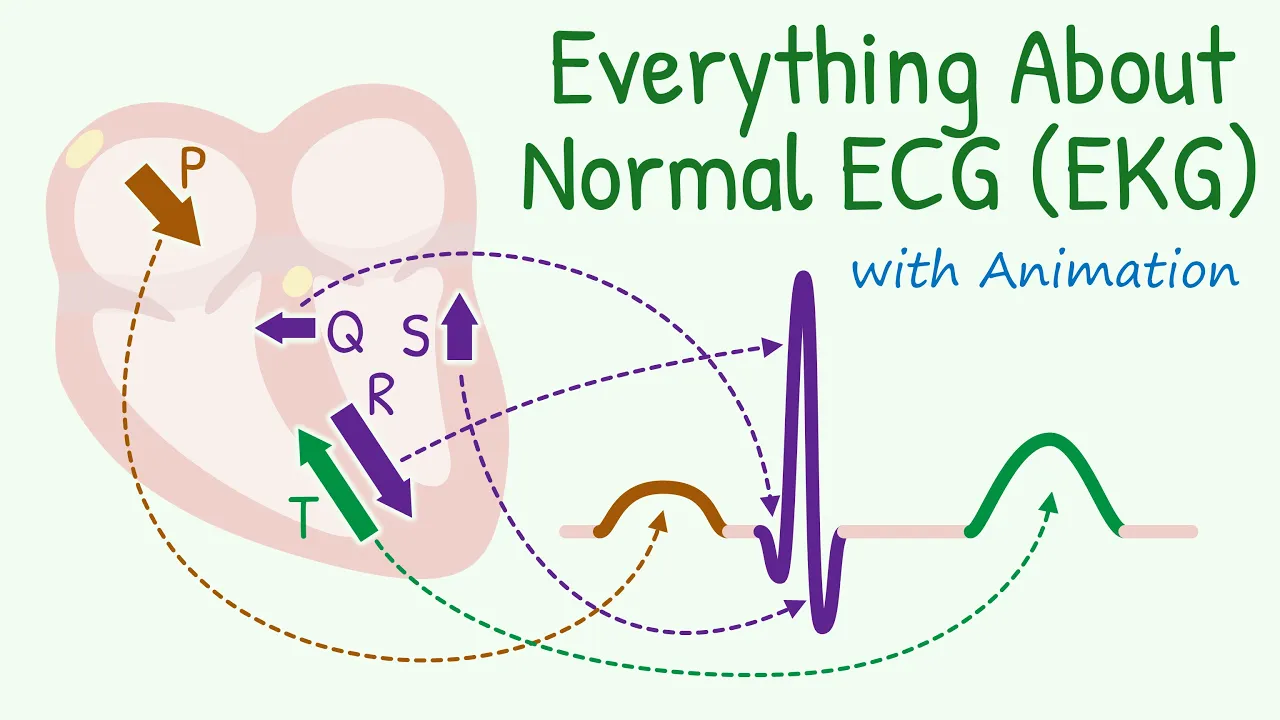
The basic components of a standard ECG waveform (P wave, QRS complex, T wave) and their association with cardiac depolarization/repolarization.
The standard electrode placement on the limbs (Right Arm, Left Arm, Left Leg) used to record bipolar limb leads.
The Hexaxial Reference System, which integrates augmented unipolar limb leads (aVR, aVL, aVF) with the bipolar limb leads to map the frontal plane in 360 degrees.
Practical methods for calculating the precise QRS electrical axis using the quadrant method and the isoelectric lead method.
How to recognize and define Left Axis Deviation (LAD), Right Axis Deviation (RAD), and Extreme Axis Deviation.
The clinical significance of axis deviations, including diagnosing ventricular hypertrophy, fascicular blocks (hemiblocks), and pulmonary embolisms.
99.4K views477likes11:22Original Release: 2012-10-30
Welcome to part one of the ECG access tutorial. Uh my name is Adam Thompson.
I'm a paramedic and uh EMS instructor out of Southwest Florida. this ECG access tutorial has come along because I I meet a lot of people and teach EKGs to a lot of people and they have a lot of questions about this EKG axis stuff because I'm always uh sort of using it to to interpret EKGs and I explain how the axis is sort of deviated and they're like what does that mean? And uh Tom Booth from ems12le.com actually has a great EKG access tutorial on his website. So, I figured I would sort of hijack his uh teaching style and some of his images and and give the same thing but in in video format and put it on here, you know, so my students can go on and check it out and so anybody on YouTube can uh enjoy it. I'm also the editor for the paramedic 101 blog. Uh, and if you go on parmesan 10101.com, you'll see we have all kinds of prehosp and emergency medicine education. and the parame medicine 101 Facebook site I think uh has a lot of good interesting stuff and including EKG cases pretty much weekly.
So this is this is Tom Booth's sixstep method for interpreting 12 EKGs. I don't know where he came up with it, but I'm not going to take credit for it. So uh I'm going to give him his credit and and this is his six-step method. And you'll see that step two is axis determination.
So the first thing we're going to do is is determine rate and rhythm. Then axis determination is is is up there. It's kind of important. Then of course intervals, morphology. We're going to look for mimics which uh there'll be another video about and eskeeia injury and infark. That's all your STEMI stuff. Take a look at this 12 EKG. It's from a 45-year-old male who is experiencing chest pain. Now, given what you know now about EKG interpretation, I want you to think about what you would do for this patient based on this 12 lead alone. What sort of actions would you take? And based on this EKG, you know, sort of what type of treatment you would provide. Well, you know, chest pain, we're probably going to follow some sort of chest pain protocol anyhow and then use aspirin and nitrates if indicated. But if many of you learned EKGs the way I learned, the first thing you learn is to make sure your leads are on appropriately, right? So, you look at lead one and lead one should have a QRS complex that's mostly positive and AVR should have a QRS complex that's mostly negative. But here we see that that is not true and in fact the limb leads are misplaced uh on this patient. You have just determined that the axis is deviated based upon looking at the 12 EKG and making sure that the QRS complex is deflected in a certain direction. So you've probably been doing it for a long time and may have never even realized that that is some sort of axis deviation.
This here is a list uh that I've kind of put together from a bunch of different uh resources and it includes the most common causes of axis deviation and the different types. So you have you when when you talk about EKG axis you have really two main types. You have your frontal plane and your precordial axis.
Frontal plane axises is taken from all your limb leads. So leads one, two and three AVR, AVL and AVF. uh using those will give you your frontal plane axis.
E-RAD, that's uh extreme right axis deviation. Sometimes that's called no man's land because that is the worst type of axis deviation to have. And basically the there's only a few things that can cause that. In fact, if you're if your leads are on appropriately, and that would be a ventricular arhythmia and a paste rhythm would be the most common causes. also very uncommon dextracardia which is when your your heart's kind of transpositioned and electrolyte derangement right axis deviation from 90 to 180 degrees and if you don't know what that means you're going to learn it in this tutorial so you're in the right place anyhow and all these different causes left posterior facicicular block I'll explain that right ventricular hypertrophy right bundle branch block wolf parkinson white syndrome uh ventricular arhythmias dextro cardia again and sometimes it's just a normal variant. If you can rule all these things out, uh pathological left axis deviation is from -30 to90°. And maybe you've noticed we haven't covered from 0 to -30° or from in fact uh a 90 to -30° because that would be normal or considered normal.
And there's a little caveat to that that I'll talk about later. But these are all the common causes of uh pathological left axis deviation. most common being left anterior facicicular block, left bundle branch block, wolf Parkinson white syndrome again, left ventricular hypertrophy, hypercalemia, Q- waves from an MI and pregnancy. Okay. And then you have your precordial axis, your precordial axis, and that comes from leads V1 through V6.
And the causes of different axis transitions, uh, I'm going to talk about later on. So I don't want to get too much into this list here, but I just want you to get an idea that it's sort of important to if you want to be good at EKG interpretation, you must learn how to identify the EKG axis and know what normal is and know what causes abnormal variances. So this is where we get our EKG axis from is our conduction system, right? Uh we know that this right here is your SA node, your sinoatrial node, SA node and that's our our normal physiologic pacemaker. That's where we get our impulse of life. it hopefully uh s sends out a signal from 60 to 100 times a minute for our entire life and and that sends conduction down here.
Okay, these are intraodal pathways. You go across Bachman's bundle to the left atrium and eventually your AV node where you pause and and you hopefully get a good pause there uh allowing your ventricles to fill and then your ventricle ventricular deolarization will take over uh AV junction and bundle branches and so on and so forth. So that's where you get your EKG axis from. And what we're going to talk about mainly, what we're going to focus on here is ventricular deolarization. When we talk about the EKG axis, we're talking about the QRS axis. And our QRS complex comes from ventricular deolarization. Okay? So from this image that we were just talking about, I we're only going to focus on the ventricles for this discussion. So what's normal? What is normal? Don't worry if you don't understand what this image is because I'm going to explain what it is and where it comes from. But the normal QRS axis is at about 60°. Okay? And that can that can vary anywhere sort of in this quadrant here from 0 to 90°. And even if it deviates a little bit to the left, this is left as you go this way. That's left. Uh even if it deviates a little bit to the left up to -30°, um that can be a normal variant as well.
So this can all be physiologically normal.
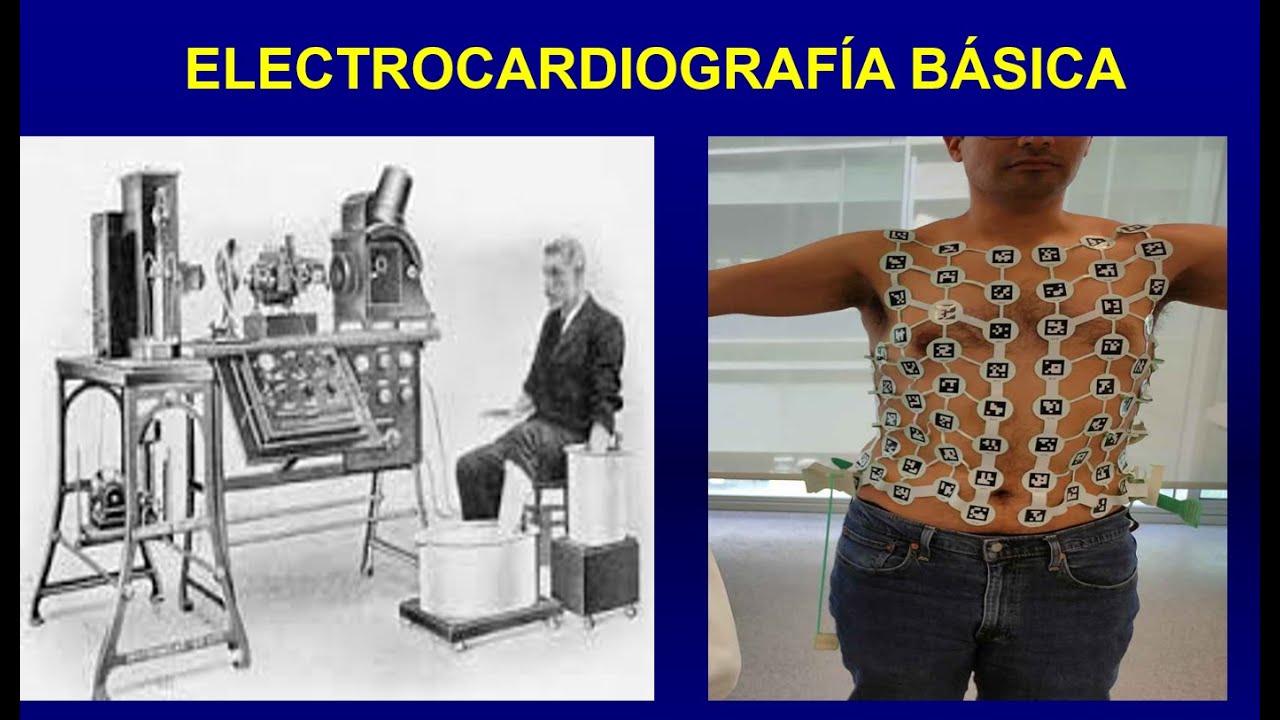
I want to talk a little bit about William Einthovven. William Einovven and he is actually the guy that we should all thank for discovering the EKG. He won the Nobel Prize in physiolog physiology or medicine in 1924 uh for inventing the string galvanometer which was the first EKG. And if you notice the picture here, you see his his hands here and and his foot are all immersed in water. And th that right there gave him leads one, two, and three, which we still call the limb leads to this day. Okay. So William Eintoven, he's kind of an important dude because he's going to be the guy that discovered something we're going to talk about now, the Eintoven's triangle. And Eintoven's triangle is considered a equilateral triangle. Equilateral. Now look at that picture and and this is where we get Einovven's triangle. This is lead one. This is lead two and this is lead three. That's how we get Einovven's triangle right there. And if you look at it, you know any if you know anything about geometry that is not equilateral, right? That is not equilateral at all. An equilateral triangle is more like something like that. It's uh equal on all sides. But I'm going to explain using Einovven's law right here how it's equilateral. And you don't have to memorize any of this.
It's just an intuition thing. You need to understand where it comes from. So, it kind of makes sense and sits with you a little bit. Okay. So, I'm not going to dive too much into this. I just want to give a quick example of what Eintoven's law is. Eintoven's law states if you take lead one, you add that to negative lead 2. So, whatever lead two is, you need you need to change its symbol. If it's positive, you make it negative. If it's negative, make it positive. And then add that to lead three. And that will always equal zero.
And that kind of creates our equilateral triangle. And here, let's explain what that formula means here. If you look at this uh this EKG example that I've taken from Tom Booth's blog, ems12le.com, again, another plug for him. Uh lead one in this EKG, the Rwave is about 7 1/2 millime tall. Don't worry about, you know, squinting and counting it out. I promise you it's 7 1/2 millime tall. And the S-wave is about 2 1/2 millime deep.
So since the S-wave is negative, uh you're going to take that from the Rwave height and you end up with about 5 mm.
So 7 1/2 minus 2 1/2 equals 5, right? So that's about 5 mm. You can do the same thing with lead 2. It's essentially a monophasic QS wave, meaning it's all negative at about -10 mm. All right. Same thing with lead 3.
Lead 3 uh has a Rwave that's about 1 millimeter high. I know it's hard to see, but there's a little Rwave in there. It's about 1 millm. And the S-wave is about 16 mm deep. About 16 mm there. So 1 - 16 gives us -15 mm. You didn't know you're going to get a quick little elementary math lesson with this, did you? So you just plug those numbers into this law. We already talked about this formula. So five from lead one, uh, since it was - 10 in lead two, and we know that we have to change the symbol, you just add 10. And then since uh lead 3 ended up being -15, we're going to put that right here at negative minus 15.
And if you add that up, 5 + 10 is 15 - 15 equals zero. Any EKG you look at 12 EDKG you look at if the leads are on appropriately should be able to do this and it will and because of that because every lead is sort of dependent on the other equally it gives us that equilateral Einovven's triangle. So this becomes this electrically. Okay, so that this is how you need to picture the leads looking at the heart. All right, and it kind of gives you a better idea of where our angles come from as we get into the hexaxial reference diagram. That's pretty much it for this lesson one. I don't want to get too much into it and confuse you too much. So go back through it if you don't understand completely. uh this image specifically uh Eintoven's triangle and how Eintoven discovered this triangle is super important um in in these limb leads and how we use them is going to is going to come up real soon here in the next part of the access determination tutorial.
Up Next
5:28
Syncing Circadian Clocks: Light vs. Meal Timing and Health
@NutritionFactsOrg
190.4K views•2020-02-10

48:47
Graphic Medicine: Comics for Collaborative Healthcare Communication
@nationalpatientadvocate
189 views•2023-12-04

8:16
ECG Axis Tutorial Part 2: Hexaxial Reference System Explained
@Meducator01
46.9K views•2012-10-30
3:05
Stages of Labor and Vaginal Birth | Childbirth Animation
@nucleusmedicalmedia
52.1M views•2017-08-18
Related Study Plans & Knowledge Roadmaps
Structured learning paths in Medicine
medicine
Abnormal LFTs: Diagnostic Workup & Pathology
01Liver Anatomy and Basic Physiology
02Introduction to Liver Function Tests (LFTs)
03Hepatocellular vs. Cholestatic Patterns
+ 3 more learning modules
12h6 modules
Explore Roadmap
medicine
Analyzing Blood Smears: RBC, WBC & Platelets
01Introduction to Blood Components & Smear Preparation
02Normal Morphology of Blood Cells
03Erythrocyte Pathologies & Morphological Variants
+ 2 more learning modules
12h5 modules
Explore Roadmap
medicine
Mechanical Ventilation: Waveforms & Alarms
01Anatomy and Physiology of Breathing
02Introduction to Mechanical Ventilation & Core Modes
03Ventilator Settings and Waveform Interpretation
+ 2 more learning modules
12h5 modules
Explore Roadmap
medicine
Neuro Exam: Localization & Stroke Syndromes
01Foundations of Neuroanatomy and Vascular Supply
02The Neurological Examination: Step-by-Step
03Principles of Neurological Localization
+ 3 more learning modules
18h6 modules
Explore Roadmap