


















This presentation covers advanced debugging tools and techniques for Linux C++ development, including GDB features like Python integration, dynamic printf, watchpoints, and reversible debugging with process record and rr; memory error detection tools such as valgrind and compiler sanitizers; and system tracing utilities including ftrace, strace, ltrace, and perf trace. The talk emphasizes that debugging is the limiting factor in program quality and that experienced programmers develop valuable skills through understanding these tools.
Advanced Linux C++ Debugging Techniques with GDB Tools
Added:Fundamental C++ memory management concepts, including stack versus heap allocation, pointers, and undefined behavior.
Basic proficiency with GDB, including setting breakpoints, stepping through code, and examining backtraces.
Familiarity with the Linux terminal, compilation processes using GCC/Clang, and the purpose of debugging symbols (-g flag).
A basic understanding of operating system concepts such as system calls, processes, and threads.
Post-mortem debugging and core dump analysis of production applications using GDB and Python-scripted automation.
Advanced kernel-level tracing and monitoring using eBPF (Extended Berkeley Packet Filter) and bpftrace.
Performance profiling and micro-architectural bottleneck analysis using Linux 'perf' and Intel VTune.
Integrating sanitizers (ASan, TSan, UBSan) into continuous integration (CI/CD) pipelines for automated memory and concurrency safety verification.
38.7K views715likes58:25Original Release: 2018-10-18
- So, welcome everyone.
Hope it was a good lunch.
So we're gonna talk about lots of cool debugging stuff.
All right, saw some people coming in.
This is a big room and these lights are kind of scary, but anyway, I'll try, I'll try my best.
Okay, so just to start off and just to set the scene, the scope, of what I wanted to talk about today, so gonna just show a bunch of specific tools, some of them freely available, some of them, some of them commercial.
Gonna either show or talk about just a random set.
There's no particular rhyme or reason why I chose what I chose.
If your favorite thing isn't here, then, well, deal with it.
And it's really about detecting.
It's about root causing bugs.
It's debugging.
So often, these things, scopes are best set, I think, by saying what they're not.
So I'm gonna steer away from generic advice.
I mean, there's some really useful stuff we can do, and I think a lot of what makes experienced programmers valuable is the tips and tricks they learn themselves for how to debug stuff, not necessarily using tools, but anyway, this talk isn't about that.
It's not about testing or testing tools, right?
There are loads of great testing tools, there's loads of great testing talks, that's already important stuff, just, that's not what I want to talk about today.
It's not about how to avoid writing bugs.
I'm gonna assume that nobody in the audience is perfect.
And it's not about performance profiling.
Well, not per se.
In a sense, looking at a performance anomaly is a bug, right?
If the program doesn't comply with the spec, and the spec might be that this thing needs to respond within so many milliseconds, then if it's not, it's a bug.
So there's clearly overlap between performance profiling and debugging, and sometimes, the two are the same.
But I'm looking at this from a point of view of debugging, not performance profiling.
Certainly not exhaustive, as I kind of said at the beginning.
So, oh yeah, and also it's not a workshop, right?
So all the tools I show, nobody's gonna come away expert in those tools who wasn't already an expert when they walked in.
And the point of it is, hopefully, you'll see some stuff that you just haven't really seen before, or you might have heard of, but weren't quite sure what it was, and then this gives you enough to maybe, then you can Google it and you can read the man page or whatever, and you'll never become an expert without actually using stuff.
But I do want to talk a little bit about why I care, and give it a little bit of context.
And I'm gonna start at the beginning.
So this chap, chap called Maurice Wilkes, who I think had as good a claim as anybody in the world to being the world's first programmer.
He's the first person to write code on a computer to do a real job, to do something other than just test this experimental machine that people were building lots of just after the Second World War to test that they work.
He was actually, I can't remember what it was.
It was some biological problem that was (mumbles) very complicated mathematics behind it, so he wrote a program on one of the first computers.
And he said in his memoirs that he remembers that the realization came over him in full force, that a good part of the remainder of my life was going to be spent finding errors in my own programs.
I kind of remember that feeling as well, when I first started to program, and I think we've all been there, we've all had that realization that it's just really not as easy as you might think.
I mean no one thinks, people who've not seen programming before, I don't think they think it's easy.
I don't think you realize just quite how impossible it is to get a program right.
I mean, I like to think of myself as a reasonable programmer, at least, perhaps, I was before I got out of practice.
What's the longest program I can write, and it will just work first time?
20 lines, 30 maybe if I try really hard.
And I think that programming is dominated by debugging.
I think there's been studies that show most programmers spend more than half their time debugging.
That might not be debugging some in-production failure, might not be what we think of debugging, but again, just ask yourself that question, how often does it work first time?
I remember a couple of years ago when my daughter started programming in Scratch, and she said, "Dad, it's lots of fun, "but I have to try lots of times to get it "to do the right thing," and I was like, yup, there's that feeling still happening.
And it's kind of cool 'cause then she could understand a little bit more about what this company with a funny name that Dad started actually does.
So anyway, that's kind of why I think debugging is really, underrated's not the word, no one could rate it, but it's underappreciated.
I guess, so there's the obvious thing, well, it's better not to write the bugs in the first place.
Yeah, well, duh, of course it is.
But none of us is perfect.
I think a nice test to the statement as whether it's worth making is would the opposite of that statement be in any way sensible?
And clearly this one, so obviously better to avoid the bugs, writing the bugs in the first place, and prevention is always better than cure.
But whatever prevention you do, you're going to need cure, and when it comes to programming, you're gonna need quite a lot of it.
And here's a nice quote from a splendid chap, Brian Kernighan, that probably many of you know.
It's quite well known that everyone knows that debugging is twice as hard as writing the program in the first place, so if you're as clever as you can be when you write it, how will you ever debug it?
Good quote, makes you think.
And I think that's another of the differences with experienced programmers.
Someone likened it to learning to ride motorcycles, and when, like these 18-year-old guys go on their first motorbikes, they tear around at 100 miles an hour, and the ones that survive, sort of the ones that don't get selected out of the gene pool, go on to be kind of middle-aged men riding around on motorcycles, nice and slow, well within their kind of margin.
They've got lots of margin for error 'cause they know they're gonna make mistakes, and I think programmers, as programmers, we learn this as well.
I think it's an interesting, if you think about what that statement implies, it's that debuggability is the limiting factor in how good our programs can be.
So whatever metric for good you have, whether it's how fast it goes, whether it's how extensible and maintainable it is, whether it's how small it is, whether how many features it has, whatever the metric for good is, if you could make debugging twice as easy or half as hard, then you could make those metrics twice as good.
It's the bottleneck, it's the limiting factor in how good our programs are.
Yet it gets remarkably little attention.
You look at the ecosystem out there, the number of talks available, the number of tools, the number of books, the meetups and conferences on things like performance profiling or testing, is huge.
There's loads of it, but there's comparatively hardly any on debugging.
Now, I appreciate, to some extent, I am preaching to the choir, 'cause you guys all turned up today, but still, that's my little soapbox bit.
So, and if you just think for a moment, the magnitude of the task, we do this every day, this debugging bit, and just kind of normal practice.
Modern computers issuing billions of instructions every second, and that's if you have one thread in one process, so that's kind of as simple as it gets.
And you're looking for that one bad instruction often.
And it is the ultimate needle in a haystack challenge.
But here's another quote from that same chap, Brian Kernighan, says that the most effective debugging tool is careful thought with judiciously placed print statements.
Now, splendid chap, he did say that in 1979, and the world has moved on, I think, a bit.
In fact, when he said that in 1979, interactive terminals were kind of new.
Print statements, more often than not, meant printing things out on a dot matrix printer or a line printer or something.
So I think the world has moved on since 1979, and we do have much better tools at our disposal.
There are times, we all know there are times, when good old printf debugging just is the tool for the job, so like all these tools, you have to choose the right tool at the right time.
But yeah, world has moved on, so where are we now?
I think there are really two kinds of debugging tool.
You can categorize things how you like, but I categorize them like this.
So you've got the kind of checkers, so dynamic and static analysis, and mostly what you're doing there is trying to look for did my code do a particular instance of a bad thing, a buffer overrun, for example?
And then the other kinds of more general purpose debuggers, which are really about code exploration and trying to work out what did my code do, and think actually a good debugger, you can spend time in a good debugger not actually debugging, just trying to work out what some piece of code that you've inherited does.
Perhaps somebody has been very clever, and you need to find out just how clever they've been.
Perhaps it was you, a few months ago.
But it's just a general, what did the code do, kind of debuggers.
I'm gonna cover both types a little bit today.
They definitely both have their place.
It's usually, if you can catch it in a checker, if you can catch it, I mean static analysis probably falls into that prevention thing, the isn't prevention better than cure, but it's still kind of, it's about root causing and extracting bugs from your code.
So running a, I'd say this is roughly what I'm gonna try and touch on today.
Lots of stuff.
I'm not gonna cut exactly to schedule, but as I say, the point is that hopefully we'll see enough of these things that you'll say, oh yeah, okay, that's cool, I see how that could be useful for me, and maybe not too intimidating as well.
I think a lot of these things, you hear about them somewhere, probably one of the smartest people you know talks about using it, and you think, gee, that sounds complicated.
Actually, lots of these things really aren't that complicated, but as per the title of this talk, there's going to be a bit of GDB wizardry focusing on GDB, just touching some of the stuff.
I gave a talk last year, two years ago, on some advanced GDB stuff.
I'm gonna cover some different, little bit of overlap, little bit different stuff.
I'm certainly not assuming that you saw any of my previous talks already.
And all the rest of the stuff is new, is new, live demos to go wrong in all sorts of kinds of new and exciting ways.
Okay, let's start then with GDB.
So I think, it was in the abstract anyway, this is all Linux-specific, obviously C, C++ specific, 'cause we're here.
It's not really about C++, obviously, but it's about how you debug binary code, compiled code.
So yeah, for GDB, it's certainly not intuitive.
It can be very intimidating.
It's perhaps, of all the tools, and having said that some of these tools sound complicated but easy to use or easy to learn, I think GDB probably is a good example of one that isn't.
I think it is easy to use, just not to easy to learn.
But once you've got the hang of it, it is pretty powerful.
So the first thing I'm gonna talk about, and I find I'm always amazed by this, it's the one feature of GDB that I think is least, (mumbles) combination, least known and most useful.
So here is a program, Hello, World with just a tiny little bit of extra stuff, and so I'm gonna compile it.
Now, I need you to compile gcc you (mumbles) with -g.
Actually, it's better to say that.
That will generate, -ggdb3 will generate more, richer debugging information can be, and GDB can do much better job of in-lined functions, optimize the way data templates and all that kind of good stuff.
So that's, and actually, using a very ancient debugger.
That's probably a better argument to give it.
Sorry?
(man mumbling) Can I increase the font?
Yeah, like that? Good.
Okay, so made my little program, so now I'm gonna run it in GDB, and I'm gonna type start, which is basically the temporary breakpoint on main, and then continue, and here we are.
So this is definitely better than Kernighan's 1979 world bit but then really not that much, so I can look at my program, I'll type list.
Yeah, this is feeling an awful lot like 1979 actually.
So let's bring GDB forward into the, screaming forward into the 80s by Control X + A, and I get my nice cursors interface, and now this is much more useful, and now I can next and it's much more like being in a debugger.
So that's a very, very useful feature.
It does kind of, is a bit temperamental, to be honest.
It's like most cursors applications.
It's worse than most cursors applications if you're running your program inside it like I'm doing here.
I think it behaves better when you attach to a running process because here, it's kind of fighting for the terminal with the process that you're debugging, with what GDB calls the inferior.
But nonetheless, we can get some multiple windows, so here I can step through the disassembly as well as the source code, for example, so all cool stuff.
I'm not gonna spend too long on that.
Control + L is very useful in TUI mode because it refreshes the screen and you need to do that more often than you might hope.
Sometimes there's no way around it.
You just have to start again.
Yeah, terminals are messed up.
Very, very briefly, my good friend Jeff Turow is gonna be talking about Python and GDB later on on Thursday, is that right?
I say good friend, only met him about half an hour ago, but we're a conference, so that counts.
But just very, very briefly then, to introduce the Python built into GDB.
It's really powerful.
You can do all kinds of cool stuff with it.
So go like that.
Or I can... I can import print I am pid.
It's pretty, pretty, pretty complete.
So it's not just shelling off the Python process and running that, and if I look at the processes here, so I can, if I want to shell off the process and do that, I can do that from the prompt with shell, and now I can see there are the pids that GDB is pid to 3905 and sure enough, that's what it printed up there.
Now there's a lot of, they've bound the Python interface to what's being debugged really quite tightly.
There's all kinds of things you can do with breakpoints and exploring the data, and I'm gonna leave that to Jeff's talk to go into that into more detail, but those are just some of the commands you can just kind of get started.
You can do, I'll just say heck of a lot with that scripting.
It's very powerful.
So I'm not gonna go into any of the details, as pretty-print is for STL.
The only thing I will say, just one little note of advice that I've seen before is, generally, you can, generally, GDB will debug arbitrary binaries that you've made anywhere, and it works well for that.
If you start trying to debug things like the STL using it's pretty-printers, you need to have used a similar, probably the same or similar distro to have compiled your program on which you are now debugging it.
Otherwise, it gets, it all gets very confused with the pretty-printers that live on the machine on which you're debugging.
So you can actually take a copy of the GDB binary and move that around quite easily.
But then, yeah, that's the other thing I see quite a bit is the GDB, Python, if you're just using your nice Ubuntu or Fedora or whatever, and it's all packaged and it all works really well, if you start trying to take a GDB, for example, and run that GDB binary on another distro, it will kind of work, and even the Python integration will appear to work, but then it will try to use some of the Python libraries, and find that there's version mismatch between the GDB binary and the Python library, the Python interpreter that's inside the GDB and the libraries on the system that it's trying to use, so that's kind of some of the more commonly, just messed up configs that I've seen that cause all kinds of issues.
My one advice, I think I said this wasn't gonna be any general advice.
This is perhaps straying dangerously close to it, but the one bit of advice, again, this is just kind of pitfalls that I've seen before, keep your GDB in it nice and simple.
I remember years ago, we had to help a customer who had some really weird behavior and all sorts of mad stuff was happening, and it turned out that they had a run command inside their.gdbinit, which was something we didn't think to test of ahead of time and we didn't quite handle properly.
It's quite, I mean it's quite a good, if you can put your, a nice GDB in it, there's all kinds of functions and things in your source control and then source that from the GDB command line, that works.
That works quite well.
And the history save is good because that means your nice up arrow, get my commands from before, that saves then across sessions, so history save has nothing to do with reversible debugging or anything like that, but it just saves the commands but often, it's much nicer to type up arrow + Enter than actually have to type the thing in again.
And yeah, pagination off and confirm off because if you're not living life, if you're not living life on the edge, then you're taking up too much space.
Okay, little bit just about how GDB is implemented, because I think this is useful to really get the most out of it.
You kind of have to, it's like old stuff.
You can understand kind of the layer at the top and you can go so far, but if you do more layers down, you can understand, the more you shouldn't get out of it, and particularly, the way that GDB interacts with signals is, I think, kind of surprising at first.
It really makes sense when you understand it but it's surprising at first.
So the thing you need to know is that GDB is built on top of ptrace, which is like a really horrible API in the Linux kernel.
I think it was inherited from releasing Solaris, possibly from longer ago than that.
And yeah, it's an awful API but it works and so that's what, there's been a couple of attempts to replace it over the years, but none of them have really got traction.
But so when GDP is running, when you're running the inferior, whether you've attached to a running process or whether you run it from the GDB command prompt, it's doing that under the control of ptrace, and the way ptrace works is when the inferior process, as GDB called it, when the tracee process receives a signal, it doesn't actually receive that signal.
It stops at that point.
Control is returned to the tracing process, which is GDB in this case, which will pick it up through a waitpid return, and then GDB can decide what to do and it can decide to just continue the program, throw that signal away, feed the signal in.
So let's have a look.
Oh, I'm gonna set (mumbles).
So most of the signals, we've got Stop, Print, Pass to program.
Most of the signals that, it'll do all those things, so when the inferior gets a SIGHUP, it'll stop, control returns to GDB prompt, and it will say, got a SIGHUP, and you can press continue, and if you do, that SIGHUP will then be passed into the program and if it has a handler, that handler will run, or if it doesn't, then it will do whatever the default action for that signal is, usually terminate, sometimes ignore, whatever, but some of them don't, so SIGINT, for example, that we treat specially, so when you're in your debuggee, your inferior process are inside GDB, and you hit Control + C to get control back.
Well, at least if you've launched, if you've run the program from GDB prompt itself.
GDB isn't doing anything special with that.
It's just that when you type Control + C at the terminal, it will generate a SIGINT and deliver that to the program that's being run.
Actually, every process inside the process group of which the terminal is the controlling terminal, I think, and so the normal thing happens, the process stops, GDB gets the notification that SIGINT has arrived and it returns to the prompt, and you type continue, and you'll notice the pass to program there for SIGINT is no, so that if you type continue, then that SIGINT will not be delivered to your program.
So if your program you're debugging has a handler for SIGINT and relies on SIGINT being called, then you'll need to change that inside what you do with, you'd need to say handle SIGINT, and then you have print, stop print pass.
I think if I want to go back to the original behavior, I'll do that.
Okay, so I think that's, oh, SIGTRAP likewise, so when you hit a breakpoint, it'll just generate a SIGTRAP, and what GDB will do when it's a breakpoint is it'll change the code.
I think it's architecture-specific, but certainly on x86, and probably most architectures, it will change the code.
It will write the opcode to generate a trap.
In the case of x86, it's the 0xCC opcode, which is a single byte opcode that generates a trap.
Other architectures, it might generate different instructions, and it will just literally plonk that in the text section so when the program gets to it, the programmer receives a SIGTRAP, GDB stops, and returns to prompt, and again, I think if we go, we'll see SIGTRAP, which is here.
Again, does not get passed to the program when you continue.
Okay.
So yeah, they'll actually, SIGINT SIGTRAP are used when you're normally debugging, but GDB doesn't actually hand, doesn't do anything particularly special with them other than responding to the SIGTRAP in the right way when it hits what it knows is a breakpoint.
Watchpoints are, watchpoints are super cool.
Really cool with reversible debugging which we'll show in a bit.
So watch foo, so I'm sure most people will have had experience with this.
And so yeah, you've watched and you continue and then when foo is not a foo, is a variable in this, assume leave a variable here, when foo is modified, it will stop and so you can run forward to the next time, and the foo is modified.
It tries to be quite clever, and so foo is a local variable when it goes out of scope.
GDB will actually set a breakpoint internally at that function.
That's the end of that scope and then also, okay, that's no longer being watched because it's out of scope.
Actually, if you're debugging compiled code, usually, what you care about is I want to watch that address 'cause I've got some other stray pointer somewhere that's stamping on this or something.
So watch -l, which is new-ish.
I don't know (mumbles), anything new within a few years old will watch -location, and that won't try and do the clever when it goes out of scope, stop watching it thing, so if you've got some local variable that's being trashed, it'll just watch that address.
Read watchpoints, so generally, actually, if the variable foo is written to, let's say foo gets an integer and it contained 42, if foo is written to and it's updated with the same value as before with 42, then it won't stop.
That's not considered, the variable beta hasn't changed even though you actually physically wrote to that piece of memory.
Just waiting for it to change, and rwatch is a read watchpoint, and if the architecture supports it, x86 does, then it can stop whenever that variable's being read, which is useful.
And we can have thread-specific watchpoints and we can apply conditions and we can combine these in all kinds of useful ways.
So thread apply, I think, is another useful command.
Most commonly used, I think, with backtrace.
So, often, especially if you're debugging some, someone else sends you an error report or some sort of bug report, and you just want to say, yeah, thread apply all backtrace full.
That's nice, that will give you, let me show you that.
That will give you a backtrace of, we're at a multi-threaded program now, so I've got, here's one I made earlier, so that's, that program, and if I run that, it's just got these 10 threads which were just up, just running around updating those values.
So if I run that... All good.
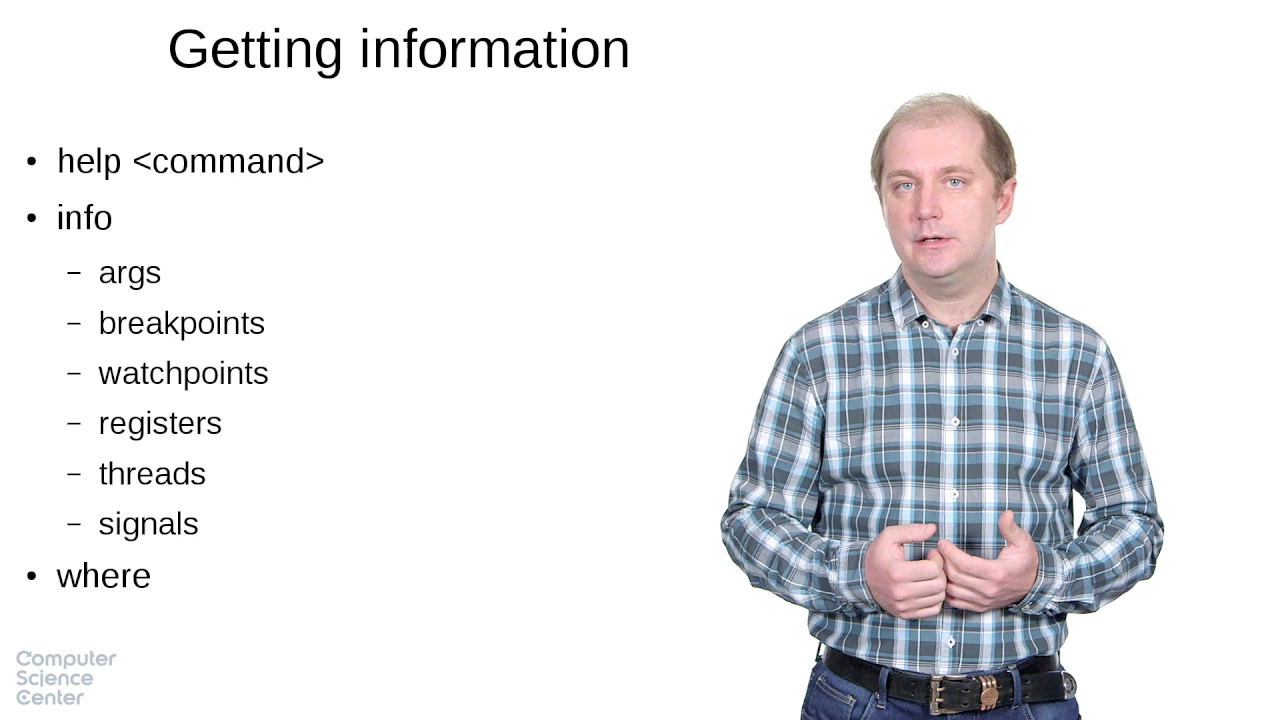
So as you probably know, info threads tells me all of the threads in my process and where they are, and yeah, thread apply or backtrace gives me a backtrace for all of my threads.
Thread apply all backtrace full, including all the local variables, so that's kind of useful.
I've only ever seen thread apply used with those options but you can do other things, so I can say thread apply 1-4 print, and $sp is a convenience variable for the stack pointer.
And so thread apple. (chuckles) There we go.
Dynamic printf, so much maligned printf.
Printf is the worse debugging tool in the world except, of course, it's quite useful, but obviously, the worst thing about printf is that you have to think in advance where to put the printf, and you have to put the right one in with the right date, print out the right arguments.
Otherwise, you need to recompile your program and deploy it again and run it again with the printf that you wish you'd put in the first place.
Now, dynamic printf is halfway to solving that problem.
So it's kind of neat, so we can go, so let's do, so dprintf, and it's, the syntax is a little bit arcane.
I think it's, here it goes, right, yeah, so mutex_lock is my function.
And so that's where I would put a breakpoint.
I've got a feeling you have to do this without spaces, I can't remember, so I've got these mutex things that I have got in my little threaded program I just showed, and I've got a magic (mumbles) and... Okay so kinda crummy, but my program exited.
But that's okay because I can just start it again and run, and there we are.
Okay, so I've... That's... I wonder how many times that particular bug is made in the world every second.
All right, there we go.
Cool, so don't print, it's cool.
It's a bit slow, I mean it's fast enough in this kind of case that we don't care at all.
Particularly if you're remote debugging, which we'll probably won't get time to look at, but we'll touch on, if you're remote debugging, then it's very slow because what's happening internally is GDB is hitting a breakpoint on mutex_lock, control is returning to GDB, it's then running printf commands, like calling those inside the inferior to do the printing that it needs to do.
Getting control back, removing that breakpoint and continuing, all of which is very slow, and all of which is really slow if you are remote debugging, so you can do this dprintf style agent.
I'm sorry, the first, sorry, I lied.
The first one, GDB.
GDB will just figure out what the printf would have been.
Call will call printf inside your program.
An agent, if you're running, if you're doing remote debugging, so you've got a GDB server on some kind of target, it will do the printing inside that agent and it can save a lot of time.
And it's reasonably configurable, as you can see, so dynamic printf is cool.
I mean you still need to put the dprintf in before the actual bug has happened.
You still need to catch it in the act, but at least you don't have to change your code and recompile your code to get that, get more printf info out.
So I just touched on calling inferior functions, and so this is very useful.
You can just type call foo from the command line and it will call the function foo.
It can be surprising.
Print foo+bar, if you're in C++ might, we might have overloaded the plus operator and so GDB is smart enough to figure that out.
Well, smart enough, and so sometimes, that can be surprising that that might call.
Print errno will call a function in your inferior because errno is a thread local and it's actually defined as a function called get errno address or Something, and GDB will just call that when you call print, when you type printer errno.
And this one caught me out.
Does my little pointer thing work?
Good, I think it does.
This one caught me out.
Passing literal strings, so from the GDB prompt, I type call strcpy( buffer, "Hello, world!
The first thing it will do is call malloc inside my program.
So malloc a buffer into which it can put Hello world, and so if you're debugging your own malloc implementation, then yeah, that can get interesting.
Catchpoints are very cool.
I'm not gonna go into them in detail.
They're kinda like breakpoints but they stop on a nominated system call.
If you say catch syscall or you can catch exceptions, which also is useful.
So yeah, kind of like breakpoints but rather than giving a line of code on which to stop, they give some kind of condition, something your program might do on which to stop.
Remote debugging, I touched on.
I think I'm gonna just put that up there so you can, I mean it's quite, very simple to use on the same machine, so here we're debugging over a socket, so you need to run this gdbserver, which is this little, little stub application that GDB will connect over a socket or whatever, which itself will then, then GDB server will debug the inferior using ptrace.
Yeah, you can do multiprocess debugging, which is good, but we're kind of running out of time, but very quickly, so I can actually get multiple, I can debug multiple processes at same time, and it looks very like debugging a multi-threaded application.
So if I just, I have to set the set follow-fork-mode child parent, and set, actually, so the key one is set detach-on-fork, so by default, GDB will detach on a fork from one of the parent or the child process, depending on what you set the follow fork mode to, but if you say detach-on-fork off, then it will continue to debug both the parent and the child process after a fork, and you can list, just like you say info threads to see all the running threads, you can go info inferiors and see all the running processes and switch between them, like you say thread one to switch to thread one, thread two, say inferior one or two.
So that can be kind of handy if we've got lots of processes to debug and to keep in your head all at once, or you could just start to copy to GDB, whatever floats your boat.
You can create your own commands in Python.
I think Jeff is going to talk about this in more detail, and so won't go into that.
You can have little stop handlers, so (mumbles) it's a Python that get called when certain things happen.
Also very useful.
You can do temporary breakpoints, you can have breakpoints on a regular expression, which is really neat if you want to stop on every, and if you've got some library that starts mylib underscore, though you can go mylib underscore dot star, and it will put a breakpoint on every function in your library's API.
One little note, because people often get confused about this.
Typically, we have debug builds and release builds, and in debug builds, we run them with low optimization, and debug to find not, not find, sorry, and so you got all your assertions in and everything else, and it can go a lot slower, depending on, I've heard of applications going like 10 times slower when they're running the debug build and a release build, and so people go, oh, I can't run GDB on my program because debug builds are too slow, and that life is, the world is more complicated than simply having the debug or release.
They're just sort of conventions, and whatever optimization level you have and what debug info you're generating are completely orthogonal, and so you can have minus 09 and minus GDB3, and lots of debug info very optimized code.
It'll be kind of weird when you debug it because you think you're stepping forwards a line and the compile has laid out code which you didn't expect, so you need to kind of, to be aware of that, but it will work, and there will be absolutely no runtime performance impact.
In fact, the only thing you'll use is a bit more disk.
You won't even, if you're not debugging it, you won't page in the debug info sections from disk, so just to correct that common misunderstanding.
All right, enough GDB.
Let's move on to other things.
So valgrind, everyone calls it valgrind, but actually, it's called valgrind.
I think, so I'm told.
Anyway, actually, so the most common one is memch-- It's a platform, you have all these tools, different tools.
The most common one is memcheck.
So they're kind of synonymous, valgrind and memcheck.
When people say run valgrind on it, they often mean run valgrind with memcheck, which is fine.
Then you've got these, actually so it does strike me, it's definitely called valgrind, not valgrind.
I don't know how you say cachegrind 'cause that doesn't sound right.
Cachegrind and callgrind, but anyway, there are the other, these other tools that you can run within valgrind.
It can be rather slow, but it just works, which is really neat.
So you don't need to recompile your program, you don't need to link against any libraries.
It's in most distros, so you can just apt install valgrind or whatever, and then just use it.
I'm reminded of a real-world story of using this when I worked at my last proper job before I started doing Undo was, we had an LD_PRELOAD library which was doing kernel bypass kind of before that became a common thing, and very often, we get this one thing that became consistent in my old life and working in Undo is customers would often say, well, your stuff's broken, it's definitely broken 'cause I run my program without your kernel bypass library or without live recorder and it worked just fine, and I run it with your kernel bypass in set or, and it's broken.
And like a lot, like most, certainly a good chunk of the time, in both cases, they're right.
It is our stuff that's broken 'cause as I said, programming is hard.
But some of the time, actually, is their program's broken and they just didn't notice, and so the guy I was working with at the time, very smart guys which couldn't believe, couldn't understand why our stuff was broken, so he just got a copy of their program and ran it with valgrind, and sure enough, there was some uninitialized data that was being accessed, and we could kind of point them at that, so let's show, let's show that in practice.
So here's my little canned version of that bug.
So here's a nice simple program.
Of course, I compile it as normal.
Run it, there's nothing wrong, that's legal.
Just is undefined.
So, let's run that inside valgrind, and see what happens.
And so, oh yeah, look.
Now you'll see it's saying, it's an instruction level thing, so what it's doing, actually, I asked if Undo works a bit like this.
What it's doing is it's translating the machine code as it runs in a sort of JIT fashion and doing analysis on that code, so it's not simulated, but it is (mumbles).
And of course, if you printf an undefined value, the first thing you notice is there's a jump, a conditional jump, based on the uninitialized data 'cause printf is trying to turn your number, the number in this case, into a string.
So it's kind of useful like that, but even more useful is you can combine it with GDB, and if I, now, the thing you got to remember that I just said, I said so valgrind is doing this translation, this binary translation of the code, so the code that you're executing is under valgrind.
The code the CPU is executing is functionally identical to the original program, but it's got extra stuff in it, this different code, and so if you try to debug it through GDB in the normal way, you'll just see nonsense, because once it tries to, once GDB tries to look through ptrace, what it'll see is what the CPU sees, which is not what it was expecting to see.
But valgrind has built into it, a GDB server, which you can connect to, and then you can start to do all the GDBs, and then the other thing we want to say here is if we do it like that, it'll just run to the end, so you can give it an error count like that.
I think (mumbles), I don't think it matters but anyway, so this thing stopped after zero errors.
I could say stop after 10 errors, and they stop after zero errors, which is gonna stop at the beginning.
Sorry, there are different vgdb modes.
Full is, I'm gonna use that 'cause it doesn't have any surprising.
There is on as well, on or full on, just so trades off performance for being, it's not incorrect but it just gets a bit weird at times, especially with, it can miss watchpoints and things.
So now, I start valgrind like this, and now it's nicely telling me what I need, tells me exactly what I need to type somewhere else to get GDB to connect to this, the server inside valgrind.
So it says I'm gonna run GDB a.out, so I can run that without, here I can run that without copy/paste.
But the next bit, I can't run without copy/paste 'cause it's more than nine characters, so, that line there.
Okay, so here I am at the beginning of time, and then I can continue.
As you can see, it's a little bit slow but it works just fine, and here I am inside this printf and I can get a backtrace, and I can see, what's wrong with my program frame 2, and here we are, accessing this uninitialized memory, so I can do all the all the GDB stuff to walk around and explore and try and get a bit more information.
Now you can't combine, unfortunately, you can't combine valgrind with any kind of reversible debugging.
That would be super cool.
Can do it with AddressSanitizer and stuff, which we'll get to in a minute.
Okay.
Kind of getting on for time so let me try and speed on through.
So yeah, a whole bunch of different tools.
The default is memtool, which I think most people think of, as I say, all different things you can do with valgrind.
Right, on sanitizers, which are kind of like valgrind but different, so unlike valgrind which will work on an unmodified program, the sanitizer's built into the compiler.
Originally came in clang, and has been available in GCC for some time now as well.
Slightly more arcane typing needed for GCC than in clang.
I don't quite know why but that's what Google told me I had to do so that's what I did and it seems to work.
Anyway, it's quite, it's much faster than valgrind.
Valgrind will slow down by, can't be anything up like 100x.
Can be more like 10 but it can be 100x, can be, yeah, can be very slow.
The AddressSanitizers, and the other kind of sanitizers are much quicker, typically, 2x.
So there's still, there's still an overhead because it's (mumbles), the compiler, basically, is instrumenting all your memory accesses, but it's doing it at the compiled time, so pros and cons.
Also they do find different types of errors.
There are some that's sort of an overlapping set of bugs that they'll find.
So let's see, so I have, so I've got this out of bounds function, which is nicely written, so if I give it a number to (mumbles), it'll use that directly to indirect this, to reference this array here.
So what did I say?
Fsanitizer, it calls address and (groans) what's the, static-libasan out_bounds.
Fsanitized, not sanitizer.
Okay, so if I run this like this, it's fine 'cause that's, there's enough elements in my array to access.
If I do it like this, it's a right activity array out of bound, and now my program has told me.
Now, because this is actually running, this isn't doing the JIT binary translation stuff, this is really running on the hardware.
You can combine this with other debugging tools just fine, so particularly, with reversible debugging, which is something close to my heart, just works.
So let's first show some reversible debugging for those of you who've not seen it.
So this is a program.
Bubble sort of program which contains a bug.
Which is one of those... Non-deterministic bugs so if I run it in a loop like that, it runs just fine until eventually, it doesn't.
Now I've got, now I'm running with, I wanted to actually do this a different way.
Anyway, let me, this has got the stacks motion detection but it actually slightly messes up this demo, so I'm gonna... I think that failed first time that time.
No, it failed every time, okay, 'cause it's the wrong (mumbles).
So... Non-deterministic bug, it will fail.
Eventually, that will fail and I'll try to look at a core file and I find out the core file is useful.
You'll have to trust me.
So, but I'm (mumbles), so gdb bubble sort.
So I quite like this little trick.
So I'm gonna run it with process record which is the inbuilt GDB reversible debugging stuff.
So now I need to run it a whole bunch times.
It doesn't usually, as we've seen, doesn't usually fail.
So I'm gonna do, put a breakpoint on main.
I'm gonna put a breakpoint on exit.
I'm gonna put a condition commands one which is gonna run a bunch of commands every time it hits breakpoint one, and I'm gonna go continue, and I'm gonna, sorry, I'm gonna type record to start turn on process record, which is the bit that we need for reversible debugging, and I'm going to continue, and I'm gonna put a break, I'm gonna put my breakpoint on dash it on score exit, so commmand 2 and just gonna rerun.
That's it, all set.
I think I probably would've done this because of my, but I need set confirm off for that to work, and off we go.
And this will keep running it with print, and you can see it's slow.
It's a very, very simple program and it takes, now the slowdown of GDB process record is kinda bit like tens of thousands of times slowdown.
What it's doing is single-stepping every single instruction, and recording what changed, so it uses lots of memory and it goes very slowly, but come on.
It definitely will crash.
And when it does, we can step back.
You know I'm gonna leave that... Oh, damn (mumbles).
Let me try something in parallel, see if we can't, let's also try it with the rr which is record and replay, so let's do the same so, so rr record, my bubble_sort program.
Does this saves the trace, that I can subsequently go and debug.
So let's just keep doing it.
Oh no.
What the (groan) it's crashed.
Right, so both crashed, so here we are inside the process record, so backtrace is garbage.
Just like, I'm in hyperspace.
I can look at the program counter.
That doesn't even look like a sensible address.
X to examine the contents.
No, there's no memory there, but I can reverse-stepi, or rsi, and that will just go back one instruction and now I'm back in insane land.
I can kind of see where I am.
Okay, so I'm at the end of the function.
Let's have a look, so this little arrow here tells me yeah, I'm at the end here.
There's return instructions.
A return on x86 will pop what is ever on the stack and jump to that, so that's the stack pointer.
If I examine that, whoop.
Sure enough, that's that garbage address, isn't it?
So I've got garbage on my stack.
So I'm gonna set a watchpoint.
I'm gonna watch that address like that, and then I'm gonna reverse continue, and sure enough, we've gone back in time.
Unsurprisingly, to when this array is being written, and the array SI is 35, and if I go show type info, oh no (mumbles) ptype array.
I can see the array is actually only 32 elements long, and obviously, my bug is the rand P (mumbles) module or size of array, which is the size in bytes rather than the size of elements.
I ran it concurrently with rr.
Considerably quicker, and non-interactive.
Kind of works, look more like strace, which we'll cover in just a minute if we get time.
So rr replay.
Now this was the one, the last one that it ran, and so this is gonna look kind of similar.
Now I'm at the beginning of time.
Continue to the end.
Here we are, we've got this (mumbles) at this random point and I can do all the stuff that I just do.
So reverse step.
I should think for some reason actually two reverse, so anyway, so reverse step there, and so I can watch.
So the stack is now that.
And so I can watch just like I did before.
To reverse continue, and there we go.
Right, so it's come down the same thing, only it's much quicker, and it's got this separate record and replay step.
It is quite, it's a little bit, it needs to be running on the right system, so it must be x86, must be a relatively new Intel CPU that has the right support.
Doesn't work on AMD, doesn't work on ARM or anything else.
I need to be running not in a virtual light, not in a cloud environment like AWS or something, because they don't have the performance counters exported that it needs, but if it's got all the bits it needs, it's very cool, it's very fast and works well.
So I want to go quickly.
Kinda gonna run out of time but so quickly on to ftrace, which is a different thing, so it's a function tracer.
It's kind of part, this is one of those part profiler, part debugger tools.
And I'm going to talk through a little case study that we did it at Undo just a little while ago, so we have this thing that's kind of like rr but works in different way, and so it doesn't have some of the restrictions, and we had a customer who's integrating it into their test suite.
It's very useful in that, so you run, when you've got those failures that just happen one in thousand times, and they're not, they're intermittent, not reproducible failures.
You've got a recording and you can just debug that.
Very, very useful, and so we're trying to integrate it, helping our customer integrate it into their test suite, and we got to kind of, we've got an exchange where a customer came to us and says, yeah, Live Recorder keeps dying, keeps getting SIGKILL.
Think actually in the process I'm recording was getting SIGKILL (mumbles) things are dying with SIGKILL.
So we said okay, well, you got this quite complex test suite.
You sure you don't have some kind of process killer running around, killing stuff, and said, yeah, no, definitely not doing that.
Said okay, so we take a look.
So we had a look around, and after a while, we came back to them, we said, you're really sure you don't have some kind of process killer?
And they said, yeah, 100%.
Said, okay, so we said, can you run this script which was an ftrace script and have a look, and they ran that, and then we said, oh, we've seen a process called watchdog that's sending SIGKILL.
What's that?
And they went, hmm, have a look around.
Oh yeah, that's this process killer we have in our test suite.
So the script we sent them was this, and (mumbles) the whole script, but the point, the interesting stuff with this was here, so ftrace is controlled.
There are some, there's a wrapper tool you can use that's quite cool but the low level, it's controlled by this sys kernel debug file system, and then you sort of poke different things into that, so let me show you essentially what we did here.
So this is the, so you can just look at the trace.
If I want to clear that trace, I can just... Sys/kernel/debug/tracing it's just echo, something at it, and it resets to trace, and so what we did here was told it to, first of all, tell it to enable signal tracing, and then, say, we're in, this is the filter.
They're interesting in any signal, any signal, basically, and then you go echo 1 into tracing on, and that starts tracing, and now if I look at my trace file, there we go.
Started to see some signals.
So everything looking quite normal here.
Just some sig-17, sorry I was just SIGCHILD, but yeah, you can see these two events are the generation of the signal and this is the process that generated the signal.
Oh look, cat and bash, so this is me.
So I think I'm only tracing.
I said last time I did this, I did it for the whole system and somehow I've set this to only trace.
I think for this process creep or something, oh no, no, no, no, no, there are other things happening as well here Xorg and the like.
So, yeah, here you are, sig-14.
That is SIGALARM, I think, and so you can see these two events, generations (mumbles) on the delivery of the signal.
Typically, you'll see the two paired, not necessarily always.
Depends if the, maybe the process has masked the signal or something like that.
By the way, it's another thing, if your program masks SIGINT and you're in GDB and you try to Control + C, it won't.
That's why when interrupted, but the program doesn't receive the SIGINT from the kernel.
Cool, so that is, that is ftrace.
Oh no, now we have to go through this whole story again.
Strace is probably better known than ftrace, and you can trace all the system calls, so, but obviously, you did a little bit more like, then strace also is built on top of ptrace.
So ptrace is the process, gets interrupted every time there's a signal.
You can also configure ptrace to interrupt, to return when there's a system call, and it will output all the system calls being issued by the command.
You can do all kinds of neat things.
You can follow fork, you can write the output to a command file, to an output file, et cetera.
Ltrace is like strace but rather than for the system calls, it's for library calls.
And actually can be system calls as well if you want, and you can configure it to print out sort of certain useful things.
Oh, I forgot the really cool thing in strace.
- k, strace -k command gives you a little backtrace for each system call that's issued, which is super useful because usually, the system call is not directly what you want.
Anyway, sorry.
So yeah, that's ltrace, so should we simply... Show it to you one of these.
Can't remember what program did I?
Okay, let's do date, ltrace date, and you can see all the library calls and the system calls, and obviously, you can be more selective if you want.
Perf trace is a new one to me.
I would find this, it's like strace but better and worse, so better because it's a lot faster.
So strace will slow down the program being traced quite a lot, particularly, if it's making lots of system calls, because every time the process makes a system call, it stops, and strace gets control, and it does some stuff, and it prints out, the system call has happened, and then it continues, and that takes time.
This is built on perf, so it works kind of like ptrace, like strace.
It's so much, much faster.
It's quite flexible as well.
You can actually get it to perf all the perf events, so all kinds of events like cache misses and all kinds of stuff.
You do need to be root, and it also doesn't, it's also, I mean I think this will probably change over time but right now, so strace, if you've got a string argument, so if you're saying right, string to file descriptor, strace will follow the point and tell you the string, whereas perf trace will just show you the raw pointer.
That's me running out of time.
Fortify is very useful, so that would get the compiler to check certain things that it can.
Reversible debugging, we've done.
Oh, look at that.
Just a bit quick at the end but I got there at the end, so thank you very much for that.
Whizzed through all the things.
Could have taken a bit more time.
I don't think I have time for questions in this session but I'm happy to answer any questions at the end.
How strict are we on time?
Can we do questions?
Just couple.
No one's saying no.
By just seeing everybody, and just suddenly thinking do I want questions in front of everybody.
Probably, I don't, because I probably won't know the answer.
I think that'll be it.
All right, thank you very much, everyone.
(audience applauding)
Up Next
74:10
Intel x86 Architecture, Assembly, and Applications Part 1 of 2
@OpenSecurityTraining
21.6K views•2012-04-14

11:23
Solving the Heat Equation with DeepXDE and PINNs
@Dr.Mohammad_Samara
8.5K views•2023-07-17
60:59
How C++ Debuggers Work: Breakpoints, Stepping, and More
@CppCon
30.9K views•2018-10-20

19:25
Enigma Machine Mechanics: WWII Encryption Explained
@JaredOwen
13.2M views•2021-12-11
Related Study Plans & Knowledge Roadmaps
Structured learning paths in Computer Science
computer-science
Building a Rust Debugger: ptrace, ELF & DWARF
01Systems Programming Foundations & Rust
02Process Control and the Linux Ptrace API
03ELF Layout: Inside Linux Executables
+ 3 more learning modules
38h6 modules
Explore Roadmap
computer-science
Container Runtimes: Namespaces, Cgroups & Go
01Linux Systems & Go Programming Foundations
02The Core of Isolation: Chroot and Filesystems
03Linux Namespaces: Process Isolation
+ 3 more learning modules
32h6 modules
Explore Roadmap
computer-science
Building a CHIP-8 Emulator: Rust & CPU Basics
01Computer Architecture Foundations (Bits & Bytes)
02Rust Programming for Systems Development
03CHIP-8 Virtual Hardware Specifications
+ 2 more learning modules
32h5 modules
Explore Roadmap
computer-science
Building BitTorrent: Go, P2P & Concurrency
01Go Fundamentals & Concurrency
02Networking Foundations & P2P Architecture
03Bencode Parsing & Torrent Metadata
+ 3 more learning modules
26h6 modules
Explore Roadmap