

























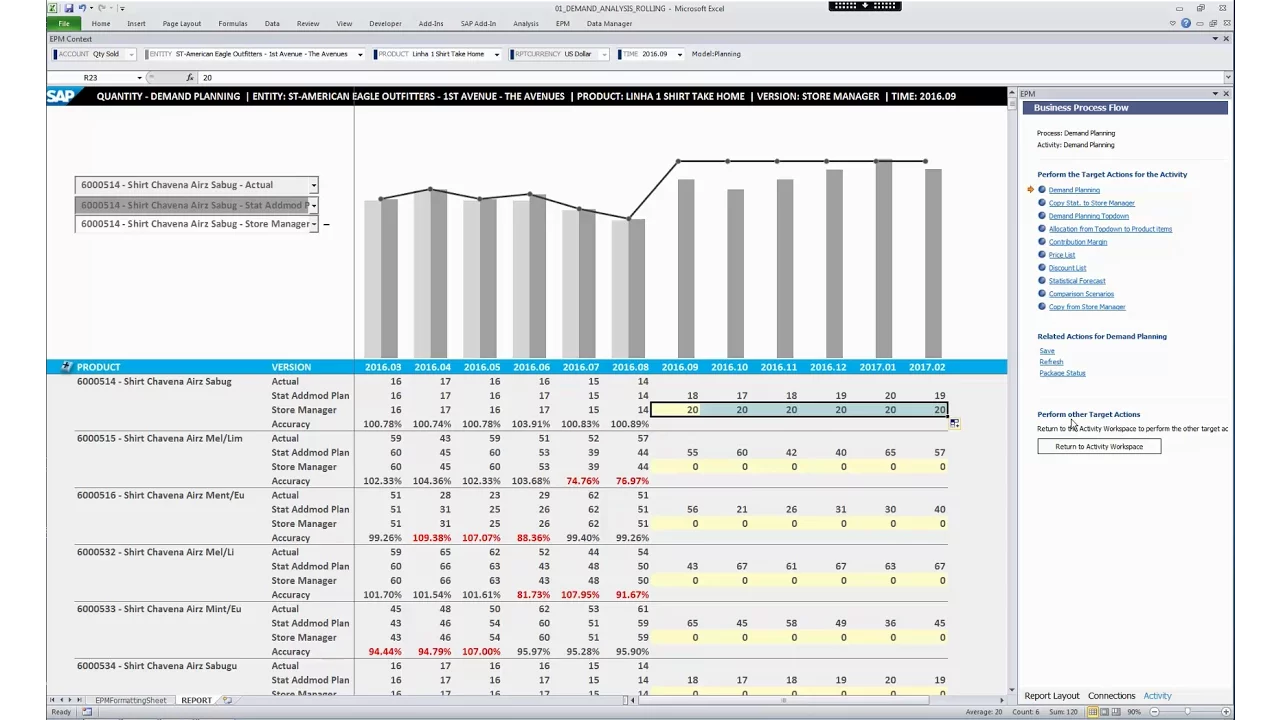



A basic FMCG product P&L is calculated by combining three key components: everyday shelf pricing (regular price sales), promotional pricing (discounted price sales), and unit calculations (units sold at each price point). The calculation involves determining the list price per unit, applying trade discounts (volume and settlement discounts) to find the retailer's purchase price, calculating the retailer's margin, and then computing the manufacturer's contribution margin by subtracting product costs and trade spend from gross sales value. Promotional pricing typically requires additional manufacturer support to maintain retailer margins, which significantly impacts overall profitability. The final P&L combines these elements to determine net sales value, product contribution, and sales and marketing contribution.
FMCG Product P&L Calculation: A Step-by-Step Guide for Beginners
Added:hello and uh welcome to this microt trainining video from fmcg Academy simply pause on the screen if you want to read through the material here today's topic is a basic product pnl and I'm going to quickly run through the components before we get into the detail of uh working working out a full pnl um key component is the everyday shelf pricing uh that's the first key component uh we need to understand the profit and contribution level uh profit and contribution per unit uh when the retailer not the fmcg manufacturer when the retailer sells at the everyday uh or regular shelf price the next key component is promotional pricing uh this is becoming more and more important in most markets around the world and a good understanding of profit and contribution per unit uh and how that's calculated when the retailer sells at a lower or promotional price and more importantly uh this pricing is funded by the supplier or the fmcg manufacturer you might have situations where the retailer funds the discount but that is more the ex exeption than the norm um then understanding how the units uh calculations uh and the units sold and the sales split between the everyday price sales and the promotional price sales uh because the profitabilities are going to be quite different and then we essentially just combine all these three and reach a full pnl uh and what I call a marketing in sales pnl which every marketer category management or sales professional should know how to make uh assumptions one retailer um doing this for one retailer and you can replicate this with multiple retailers uh in your Market or average them out into one grid uh one product or group uh you will have multiple products if you are managing a larger portfolio but that's just this is just to keep Simplicity and pricing structures and a single promotional price uh you can add multiple promotional prices H you're more likely to have one or two or possibly three promotional prices uh but in this case we're using a single promotional price let's have a look at how the everyday regular pricing uh pnl is calculated uh on this column here you're going to see descriptions and simply pause out here if you want to uh read through the descriptions uh we're going to capture the key facets and measures here and detail all the stuff on the right let's get into it straight away we are assuming this is a product called a and u there is H sorry that's not very good drawing drawing is not that good um as is clearly evident uh but what we've got is a product called a and a retailer called x uh and we'll calculate percentage of gross sales value on the extreme right column here and I'll explain that concept as we go along now in the fmcg business uh while consumers Buy in a buy single single in single units you know as a jar or a packet of blades or a jar of sauce and what have you uh manufacturers sell to retailers in cartons or cases or shippers so you can call them a case or carton or shipper depending on which part of the world you are in uh and customers and retailers Buy in uh these units it's called a selling unit in a lot of markets uh in this case I've assumed there are 10 consumer units in one carton case or shipper uh next we need to look at the list or the wholesale price per carton so this is a standard price which is uh been worked out by marketing at some point uh based on the pricing analysis they do that that should be the list price uh or wholesale price per carton which can be offered to most customers uh this is is uh normally a price list there with customer services and if someone calls with a big order and they are not they've not agreed a discounted uh structure with the manufacturer then they'll be offered it at this price so the price I put here is $40 and that's $40 for that uh for the full carton uh or shipper or case uh we need to convert that into per unit and here on we'll talk only on a on a per unit basis a consumer buying unit basis um so this is list price per unit simply dividing uh 40 by by 10 and you will get the number here called for uh and that's $4 per unit then this product is at and that's what we've kept as 100% And from and this is also called your gross sales value uh and that's important to understand and we'll track the whole pnl how it works through from 100% and where we lose money and how that money goes out to arrive at uh final profitability now all most uh major retailers in developed markets will have discount structures agreed with manufacturers and it'll vary by brand or category uh I've just you can have multiple layers of these discounts and sometimes they are meaninglessly complex but I've just kept two two levels uh done one at 10% so we've taken 10% out of $4 to arrive at $360 and then we've taken out 6% again of uh $360 to arrive at $338 um you might have more layers and more discounts uh but I've assume two in this case the Third thing a lot of uh lot of markets and um environments have a settlement or a prompt payment discount this is normally to uh payment if the if the retailer pays within 30 days or 60 days or 90 days whatever it may be so I've assume 2% this is normally 2 to 3% uh we've taken that number of $360 to arrive at $331 so that then becomes the final price which we are selling at to this retailer and we've already discounted ourselves by Min -7% as you can see so 177% has gone off to the retailer and we're going to sell to the retailer at $3.31 these discounts are specific to uh specific to this retailer and this product group or brand uh this may be more common across uh multiple product categories and Brands um now let's look at how the retailer is functioning so the retailer is going to sell this product obviously to make money uh the retailer will sell it at $5 we call this the everyday shelf price or RRP the RRP stands for so RRP is equal to recommended retail price it's a recommended retail price uh remember you cannot force the retailer to sell at a certain price you can recommend that this should be the shell price um next we take off tax so the retailer sells this product let's say at $5 uh to the consumer or the Shopper we remove the tax impact which is 15% and that is calculated uh on the four on $435 so it is 15% on top of $435 uh so the formula essentially is 5 divided 1 plus 15% so that gets you down to $435 um once that is done that's what the retailer gets in hand uh and then the retailer gets an everyday margin so the retailer makes A14 in this calculation now the dollar and four is coming out of uh so that's what the retailer was making in hand uh after selling to the consumer or the Shopper and deduct what the retailer is buying at which is a131 here you can see and uh you deduct that and you will get A1 and4 and the the retailer then makes 23.8% margin now that 23.8% margin is arrived at as it's basically A1 and4 divided by doll 435 uh to arrive at 23.8% that's the margin the retailers making on an everyday shelf price basis so keep keep your eye on those two numbers 23.8% and a dollar four in terms of margin next let's take a look at uh the fixed rat spend a lot of organizations have this and uh what we call the sum of everyday terms and rebates so this is every time this retailer buys they will get this discount structure uh whether they whatever price they sell at and whatever they do is a separate issue but that's the minimum they're going to get every time they will buy the product at $331 every time they choose to buy uh the product and you might have a volume layer discount but in this case we've assumed this is the standard discount they're going to uh they're going to buy at coming back to R pnl how is we that is 69 cents or 177% so it's that same 177% which we took off from here that is calculated essentially $4 less $331 to arrive at 69 so um just so you get that number that was uh $14 minus 1331 = do 0.69 that becomes the fixed trate spend again keep your eye on that number so 177% is the fixed trate spend uh let's now take a look at the cost of manufacturing now I've assumed one number here for Simplicity it is the cost of making the product the inward Freight outbound Freight and you might have different components depending on the organization you're in uh and I've kept that at125 that is 31% of our gross sales value of $4 so the gross sales value is $4 uh 31% so good chunks so 31 + 17 is4 48 that takes us to 52% in terms of regular or everyday contribution so what we've done is basically $26 was arrived that by taking $4 uh minus $169 which we were giving as the trade spend and minus dollar three sorry that's uh what's this one here let me just rub this off uh and then was doar 1.25 to give you uh the dollar 2.06 so $26 and that is 52% let's keep an eye on this number too 52% is the profitability uh on an everyday basis and we make $26 because we've given a194 which is these two numbers combined uh to to is is gone with product cost as well as to the uh retailer now let's take a look at the promotional pricing uh same sort of structure um we're going to sell the product at $3.99 remember the we were selling this product at $5 originally and now we're going to sell this product at $3.99 same calculation for taking off tax of uh the higher numbers so we arrive at a net realization of $347 um so the retailer will get $347 uh remember from the earlier Slide the retailer was buying the product for $331 so if we don't support the retailer give them any more any more discounts or uh support or scan backs as we call the retailer is going to make 16 cents so that's $347 minus $331 uh and that takes you to 16 cents which is 4.5% the 4.5% again 16 divided by $347 now we need need to give them a additional so most retailers will not work on that level of margin of 4.5% they will expect support uh in terms from the manufacturer to fund the discounts and that in this case I've assumed 23.8% so the same margin the retailer was making every day on a percentage basis remember the percentage is 23.8 and the absolute is $14 here uh I mean not expecting to give them a dollar four uh and that's a different negotiation altogether uh we're going to give them 23.8% uh to take them to 83 cents and give them an additional 67 cents now that calculation is also pretty straightforward so the number the way it works is all you say is fine uh we want to give them 23.8% uh let's multiply by that by the $347 they were realizing uh and that is $347 and that is equal to 83 um so we need to give them 83 cents um let me just drop this off here an eror there um so we need to give them 83 cents uh so we're giving them uh to reach that we already giving them already giving them 16 cents remember they were going to make only 16 if we didn't support them any further so because they're making 16 cents already uh all I need to give them more is 67 um there you go that is a simple calculation but remember that is now 177% of the gross sales value in your p&l so it's a fairly large chunk next we've got fixed retailer costs now a lot of retailers will have promotion participation cost there could be mailer or catalog cost off location display and stuff like that which is not directly linked to units uh but if you want want to play in the promotion then you got to uh got to fund that and I've kept that at 5% only when we are promoting so that's 20 cents of $4 uh so that is 5% as it's not units linked or volume sales linked uh and we're going to support that we we'll need to spend that amount of money when we are on promotion as a manufacturer this comes uh this totals up now to the discretionary trade spend now that's uh when on promotion so this is discretionary because it's controlled by the manufacturer uh and is used to drive sales and market share Etc and that is sitting at 22% uh in this case so that was the sum of 67 cents plus 20 cents to arrive at 87 cents so we're giving 87 cents support when the retailer is discounting down from $5 to3 $39 remember the retailer was originally selling the product at 5 they're coming down to$ 3.99 uh and we are going to support them with 87 cents 20 cents is roughly the fixed cost and 67 cents for a total of 22% 17 + 5 there uh so the promotional contribution per unit again straightforward uh we basically go back to the earlier slide and just show you you were we were making $26 and we had 52% profitability we've given away 22% uh so we left with u so let's have a look here yeah so every day and promo so we were making 52% there and then we've knocked off discretionary trade spend at -22% and now on promotion the business is going to make 30% contribution um similar with the uh profitability uh we were making uh $26 there you see that number so let me just come back so $2 and6 and we've deducted dollar 0.87 so that's 87 cents gone to arrive at $1.9 does that kind of make it clear in terms of where how the profitability gets impacted so the retailer still makes 23.8% uh they don't make the same dollar margin which was about a16 uh previously uh but as a manufacturer on promotion the impact is quite dramatic you know knocked off a good chunk of our margin and lost 22% of our profitability from 52 to 30 but that is the reality of the retail space and the promotional uh World in fmcg moving next to uh unit calculations um again this is more straightforward so we have the Shelf price at $5 we're doing an annual pnl so we're going to have weeks when we're going to promote and we weeks when we're not going to promote so assume 34 weeks we are not promoting um average unit sales per store per week important concept uh that is the a it's exactly what it says it's the uh per store per week sales of the product or the group so we've assume 10 in this case number of stores that retailer has 1,000 stores the retailer has remember this is an average some stores will sell more some stores will sell less not all not not all thousand stores are going to be equal uh average units per week of promotion simply multiplying 1,000 by 10 and you reach 10,000 nonpromoted units ignore the 49% for the time being so that $340,000 uh units comes out of 10,000 multiplied by 34 weeks uh and we are there at 340,000 now let's look at the promotional price what happens there again some assumptions so we were at$ 3.99 on the promotional price we weeks on promo is going to be 18 because there are 52 weeks a year so 18 on promo therefore 34 off promo um I've assumed the average unit sales doubles up here so the can happen in some segments of categories uh so it was 10 units per store per week that's gone to 20 uh it's a big jump uh that's an assumption so the units per week on Pro promotion moves to 20,000 because there are still th000 stores uh and then uh we've got 360,000 as the total units simply multiplying 20,000 by 18 and you can see that leads to 360,000 units so the total units comes to 700,000 that's 360,000 that was the 360,000 + 340,000 and then uh what we've got here is the percentage so 51% of the units are promoted that is 360,000 divided by 700,000 keep your eye on that 700,000 number uh as we'll refer to that later uh when we make the full pnl uh and then another thing which a lot of uh organizations like to calculate is the retail sales value and you can add more um uh rows here but that's coming in at 3.13 million that calculation is simply the retail sales value of the total units so it is going to be sorry I'll just go back there so that is going to be dollar just going make a bracket here $5 was the regular shelf price and at the regular shelf price we selling 340,000 units and then add on uh the units we selling at 3.99 which was 360,000 units and that takes you to 3136 million so I'm going to assume that is 3.1 million for Simplicity and you might be in a category which is let's say category equal equal do 50 million um and you could say fine 3.1 / 50 gets me to 6.2% you need to multiply that by 100 uh market share so that gives you an idea how that number can be used uh is and it's also a sense check when you're putting a new plan together is that share relevant is that share based on last year or if it's a new product is it too ambitious or is it not ambitious enough and gives you a sense check definitely when you're looking at uh doing all the uh crunching the numbers through and arriving at a market share because that's what marketers really U strive for and hope for putting together the full pnl uh gross sales value is of uh $2.8 million that was calculated remember the $700,000 units and we've just multiplied that by doll4 to arrive at 2.8 million remember the fixed trade spend if you see on the first slide was 17% so we multiplied 17% by 2.8 million and we arrive at [Music] 4816006 of gross sales there it is 87 cents and more importantly the promoted units were 51% they were 51% of the total units uh keep those two numbers in mind as we calculate uh the discretionary trade spend and that was 22% multiplied by 51% because it's only applicable when we are promoting um multiplying that further by 2.8 million to get us 312,000 so the discretionary trade spin drops to 11% on the overall p&l because it's applicable only on 51 % of the units uh you can imagine what happens when those 51% go to goes to 70 or 80% and you can see how the profitability will get impacted uh deducting the fixed and the discretionary tra spend we arrive at a net sales value which in this case is 72% it is low in some low it could be low or could be high depending on which category or segment you in but I've seen that number fair enough early '70s or even late 60s um and we arrive at $2 million product cost was uh again 700,000 units uh multiplied by11 1225 um and that takes you to 875,000 so that was another 31% of the cost uh uh impact on your pnl net product contribution 2 million minus 875 takes you there to 1.13 million so we left at 40% net product contribution remember the everyday was at 52 um and the uh promotional was at 22 uh at 30% uh when we lost 222% uh with through promotional pricing support so this is coming somewhere in the middle at 40% uh then I've assumed a few marketing expenses uh which will be there and we'll get into the marketing side later in more detail advertising at 8% uh and that includes media production sampling PR and sponsorship uh below the line expenses uh you know consumer promotions point of sale at 4% and research and brand track in which is attri which you can attribute to this uh this brand or product group at 3% that is a total of 15% we knock all that off and we reach a sales and marketing contribution of 710,000 which is 25% uh it's not a company pnl it's a sales and marketing pnl as I said in the next video you'll see me using the Excel spreadsheet uh through which this was constructed to show how things change and impact as we change different uh numbers I hope you enjoyed that thing
Up Next

Gross Revenue vs Net Revenue: The Trade Spend Waterfall Explained
@diacovone
3.4K views•2026-03-23
Retention Habits of Top DTC Ecommerce Brands Revealed
@SendItPodcast
44K views•2026-03-03

Decoy Effect: How Pricing Psychology Influences Consumer Spending
@bobinvestsUS
90K views•2026-01-05

The Planned Obsolescence of Light Bulbs and Tech
@veritasium
25.3M views•2021-03-26
Related Study Plans & Knowledge Roadmaps
Structured learning paths in Business