





















![Lecture #03 - Concurrency Control (Part I) [CMU Database Systems Spring 2016]](https://i.ytimg.com/vi_webp/x8ZoOfvVlwE/maxresdefault.webp)







A three-statement financial model in Excel consists of interconnected income statement, balance sheet, and cash flow statement driven by assumptions and supporting schedules; the model is built by first establishing assumptions, then calculating revenue and variable costs using year-over-year growth rates, followed by fixed costs, depreciation based on opening PPE balance, and interest based on average debt; working capital items like accounts receivable, inventory, and accounts payable are calculated using days outstanding ratios relative to revenue or COGS; the cash flow statement reconciles net income with changes in working capital and capital expenditures, while the balance sheet balances assets against liabilities plus equity; finally, charts and graphs visualize the model outputs, and scenario analysis tests how changes in assumptions affect financial outcomes.
Financial Modeling Tutorial: Build a Three-Statement Model in Excel
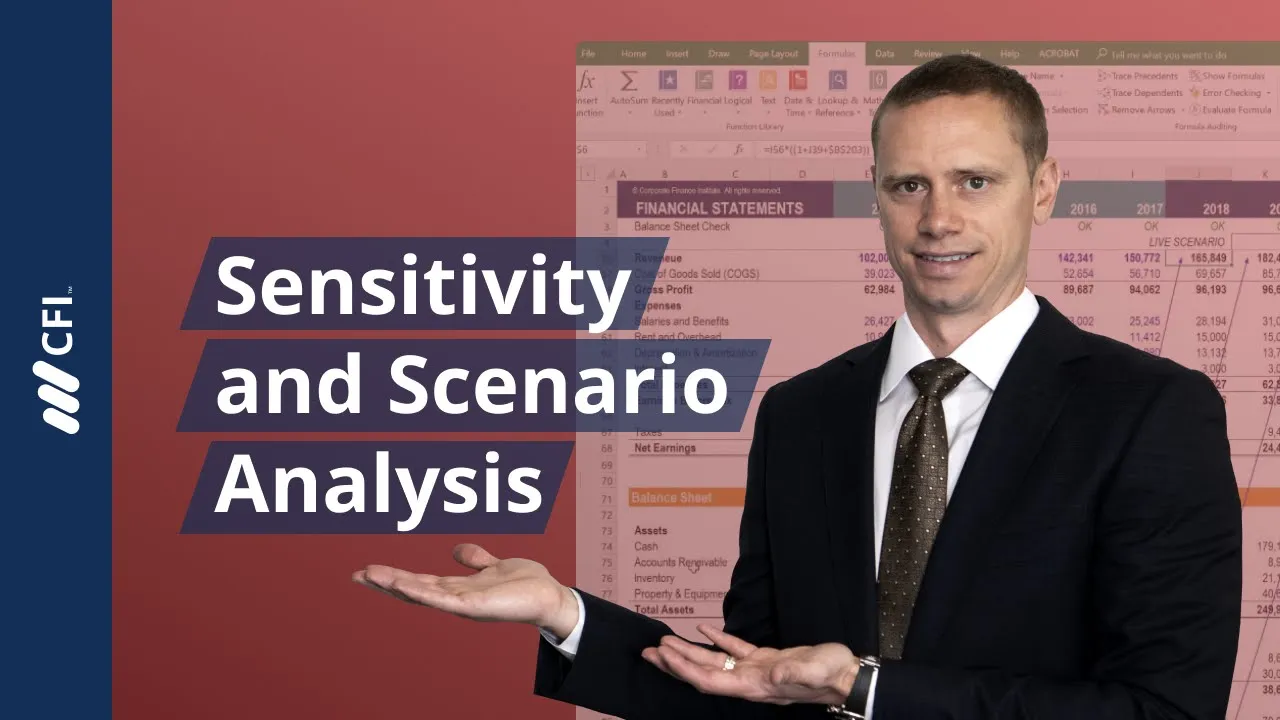
Added:Hi everyone, Tim Bipbond here. I'm going to walk you through a free three-statement financial modeling course. Let's take a look at the screen right now where we're going to walk through this model from CFI. And if I open up all the sections in this model, you probably won't be surprised to see that we've got some assumptions that are going to drive an income statement, a balance sheet, a cash flow statement, and then that's all built upon some supporting schedules. And finally, some nice outputs like charts and graphs to illustrate the outcome of the financial model. So, this is a preview of the completed product that we're going to build together in this course. It's only going to take about 30 minutes, but we're going to go through and use these assumptions here to build up and drive our income statement, balance sheet, and cash flow. Have them all interconnected.
And then when they're interconnected, we can go up to the assumptions here. we can start changing these around and see what happens as the numbers flow through the model. Now, before we get started building it, let's flip over to review a few key concepts in PowerPoint.
All right. So, to build a financial model, what we're going to do is take accounting statements like this here and turn them into dynamically linked statements in Excel.
So, why would we do that? Well, we want to have a tool. A financial model is really just a tool to forecast business performance into the future based on assumptions and drivers that we want to use to try to predict the future.
Let's also discuss how three-statement financial modeling fits in the overall hierarchy of financial modeling.
Three-statement is the foundation, the bedrock, the simplest and most fundamental type of model that you need.
Once you've built it, on top of it, you can layer on discounted cash flow analysis, scenario analysis, sensitivity analysis. You could look at scenarios like capital raising or changing the capital structure of a business. You could look at acquisition opportunities, perform M&A analysis, which includes accretion and dilution, etc. And then finally, you can have leverage buyout analysis, which is typically the most complex type of model. You also have internal operating models for businesses that might include many parts of this pyramid like an internal FPNA model for example for a company.
All right, let's talk about the structure of the model. There's really three parts to every financial model though we have more than three sections.
Everything is one of these three types.
It's either an input, a processing, meaning a formula, or an output like a chart and graph or table. And we want them clearly separated. So the inputs are all in one area. The calculations are all in one area. And the outputs or charts and graphs are all in their own area as well. This keeps the model super organized.
All right, let's talk about layout and structure. There's really two ways to organize models. One is with multi multi- tabs or multi-heets across the bottom. So you have income statement on one, balance sheet on another, etc. The next thing is you could stack them vertically all in one sheet. And this is my preference, the single sheet vertically stacked type of model where we use grouping to expand and contract the different sections. And you'll see that in our model. This is my preference and a general preference at CFI as well.
All right, let's look at the framework for how we're going to set it up. We're going to start with assumptions and drivers where we have historical ratios that are used to inform the future drivers of the business. Okay. Then the income statement. This is pretty straightforward. Just summarizes the profit and loss. The balance sheet shows the financial position, sort of what the company owns and what it owes. The cash flow statement shows increases and decreases in cash across the business.
And then of course we have our supporting schedules underneath that because some of the balance sheet items and cash flow statement items will require extra calculations and it's much more organized to keep them in a separate section.
I'll add one comment about forecasting techniques. In this model, we're going to do a year-over-year growth rate, the simplest form, but there are many forms of revenue forecasting. You could do a top- down analysis where you look at the macro picture, market share, and work your way down to revenue. You could do bottom up where you start with units like unit economics of the business and multiply those out to get up to revenue.
You could look at regression analysis where you're looking at correlations and relationships between certain drivers and then revenue. Uh, and finally, year-over-year growth rate. This is the simplest. So, the purpose of this course is just to teach you how to link the statements. This is not really a forecasting course. So, we're just going to use year-over-year growth rates. And finally, at the end of the course, we're going to give you some auditing techniques to make sure the model works.
You can do sanity checks by changing assumptions and drivers. Use go-to special in Excel to solve for something backwards.
Use trace precedence and dependence where arrows will show you how things are connected to each other. view formulas to look look at and audit formulas to make sure they're consistent.
We can have error messages and alerts to look at and finally play with our Excel settings. So, with all that being said, I wanted to get through that quickly so we can jump back into Excel and get building this model together.
All right, so here we are back in the model and this time it's going to be empty. So, the forecast part is completely blank. We have some assumptions and we'll talk about those as we go through them. But the income statement, balance sheet, cash flow, supporting schedules, charts, graphs, that's all empty and we're going to build everything together. So, we've saved you the hassle of copying and pasting historical financials into Excel. But if you had a blank spreadsheet, you just paste in all these historical numbers, and then we'd start building together. And as I mentioned earlier, we're going to use a simple year-over-year growth rate for revenue.
So if we look at the historical numbers, you can see we've just calculated historically what has that revenue growth been. And then we're going to fill this in um by saying the formula is equal to the prior period times in bracket 1 plus this growth rate assumption.
And once that's in place, you can fill it right. If I select the cells holding down shift and the right arrow and then I press controlR, that's how you do fill right. Crl R will save you a lot of time in filling in this spreadsheet. Cost of goods sold is simply going to be a proportion of revenue. So if we look back historically, cost of goods sold has been between 37 and 40% of revenue.
And then we've got these assumptions about what it's going to be going forward. And you can see it's bumping around. And that's partly just to show you how things change when your assumptions change.
So to calculate this all we do is we we set a formula equal to revenue multiplied by the cost of goods sold assumption as a percent of revenue.
And then to get gross profit we simply take revenue and subtract cost of goods sold. And we can fill all that right.
I'm holding down shift when I use the arrows and pressingtrlr.
So I filled all that right. So, in just a few seconds here, I've got revenue, cost of goods sold, and gross profit for the whole forecast period. We're doing a 5-year forecast period here. And we've got 5 years of historicals. This is pretty standard to give you enough of a timeline to see the historical trend and to have an impactful forecast period as well. So, let's keep moving down the list of assumptions. Next up, we've got another variable cost, salaries and benefits. It's a percent of revenue. So that makes it a variable cost. And we're going to set it equal to revenue multiplied by the assumption and fill it right with controlr.
Salaries and benefits are a variable cost for this business because as the business produces more revenue, it needs to hire more people. And then we're going to introduce our first fixed cost here, which is rent and overhead. This business won't need to increase rent.
it's got extra space uh in the office and can add a lot more people without increasing fixed costs. So, the rent and overhead is going to stay flat during the forecast period. You can see it jumps and like I said, that's to have a bigger office space that has room for the company to grow, but then it doesn't have to increase it. It has fixed rent.
All right, so we're making good progress here through this. Next up is depreciation and amortization. I've made a note here that says it's a percent of the opening property, plant, and equipment balance. This is an important note because you could calculate depreciation as a percentage of revenue, but that wouldn't be following any type of accounting policy or procedure. From an accounting perspective, depreciation is always related to the assets that are being depreciated, not the revenue. So, we're going to tackle that later once we've filled in the balance sheet. We don't have PPE yet, so we can't do that yet. Same thing with interest expense.
We have a note here saying it's based on the average debt balance. But if we scroll down to the balance sheet, we don't have a debt balance. And like I said just a minute ago, we don't have property, plant, and equipment or fixed asset balance either. So, we can't do those. But that's fine. The key to building a model is to just chip away at whatever you can do in whatever order you can do it. So you start at the top of the income statement, get down to the point where you get stuck. Now there's one other thing we can do here, which is fill across these formulas that are subtotals because the subtotals don't need the numbers in the middle. So we can fill those, right? Same with net income just so that we've continued to chip away at linking everything up. And eventually we'll come back and fill in these numbers and it'll automatically update net income for us.
Okay, great. So, let's go down to the balance sheet now. Cash balance. Let's think about this for a second. The cash balance is at the end of the period, and it's impacted by basically everything that goes on. So, we won't know this until basically the final step of the financial model. So, we can't do cash.
Let's move on. What about accounts receivable? That's a function of revenue. Not everybody pays for products or services right away, and that creates an accounts receivable balance. So if we look at the assumptions here, we have an assumption of how many days of revenue essentially are unpaid at the end of the year and based on the historical trend, it's about 18 days.
So we use the same assumption of 18 days of accounts receivable and what to calculate that let's walk through this together. So remember that I said it's a function of revenue and we multiply it by those number of days that are outstanding divided by the days in the period which is 365.
That gives us the accounts receivable balance. So it's telling us that one way to think of it is that 18 out of 365 days are unpaid. That's why we divide by 365.
So when we have that ratio, we apply it to revenue and we have our accounts receivable balance. Let's fill it.
Right?
Okay. Next up is inventory.
Inventory is going to be a function of cost of goods sold. It represents um what is remaining to be sold on the balance sheet. So let's take cost of goods sold. Let's find it here.
inventory days multiplied by let's try that one more time. We're going to set it equal to the cost of goods sold multiplied by the average inventory days which is 80 and then divided by the days in the period which is 365.
So this is how much inventory is going to be on the balance sheet based on historically speaking how quickly the company has turned over inventory. This is our best estimate of how much inventory the company will have on its balance sheet at the end. Now property and equipment is a little more of a complicated calculation. So we've put a schedule down below, a supporting schedule. And you'll see here we're going to calculate a few things in the supporting schedules. changes in working capital, depreciation, as well as PP&E, and then debt and interest. So, just a little preview for you of what we're going to calculate in the supporting schedules down below.
So, let's fill that right. We can also take the total assets calculation and fill it right. You'll notice for simplicity, I haven't separated current and non-current assets. It's just a subtotal line. It doesn't really change the balance sheet. So, it's fine for us to just have it as one thing. Let's calculate accounts payable. Accounts payable is going to be a function of cost of goods sold just like inventory was multiplied by the accounts payable days assumption divided by the days in the period. Now, there could be other parts of the income statement that have payable terms, but generally COGS is where most of the payable terms are going to be. Salaries and benefits are mostly going to be paid right away and not have much owing to employees, whereas COGS is where you could have a bunch that's still owing to your suppliers and vendors.
Let's fill that right with controlr fill total liabilities across debt. As I said, we don't have yet.
We're going to go to the supporting schedules for that. Then we have shareholders equity, the equity capital.
That's going to be a bit more complicated. Um, but we don't have a schedule for um equity capital. So, let's think about how we could do that, but we're going to come back to it a bit later to fill in the balance sheet. Same with retained earnings. We'll come back to these items. Generally, I just like to tick off the easy ones on the balance sheet first, like these ones here.
Then we'll move on to the cash flow statement.
We can link up net income. Even though we know this isn't the right net income number yet, but this is simply mechanics to link it up. It's going to change when we add the rest of the calculations in.
All right. And then you see depreciation and amortization is coming up again.
and changes in working capital. So, so let's say all right, it's time to move on to the supporting schedules.
Like I said, we're going to calculate the net working capital amount and then the changes in that since we need it for our cash flow statement.
Then we'll go on to do depreciation and fixed assets, debt and interest. So to to do this one, we essentially just link up accounts receivable and then we link up inventory and then we link up accounts payable.
And then to calculate the net working capital, we take the asset side which is accounts receivable and inventory and we subtract the liability side.
And then we calculate the change which is the current amount minus the prior period amount.
And once we have this, we can use shift and the right arrow and then press controlr to fill it. Right? So now we have our networking capital and you can see it climbing as the business builds with a little bit of a change in 2028. That's fine. We'll we'll sort of analyze these numbers a bit later.
Um and let's move on now to the depreciation schedule. What we're going to do, there's many ways to do this.
This is a method I like that's fairly simple and it does have assumptions built into it. We we take a corkcrew calculation here. The reason it's called a corkcrew is like the shape of a corkcrew it pulls from a prior period.
So the opening balance of PP&E plus any capital expenditures that are added to it minus any depreciation gets us the end of period balance, the closing balance. Okay, so the opening balance is equal to the prior period closing balance and the current period opening balance are the same thing. So that's the corkcrew part. We're just referring to the prior period.
Now let's see. We have an assumption for capital expenditures.
We go up here, select that, press enter.
Okay, so this is adding to the PPE balance less depreciation. But let's see how we're going to want to calculate depreciation. If we look at the note, we're saying that depreciation is going to be a percent of opening PP&E. We don't depreciate any of the capex in this period. That's just an assumption.
Your accountant might tell you otherwise that you might have to use the average balance that includes um sorry I'm in the wrong spot. That includes some of the capex from the year with a half rule principle. But we don't need to get too complicated here with halfyear principles and so on. So let's just take the opening balance and multiply it by the depreciation expense or assumption I should say.
and then calculate the closing balance which is opening plus additions minus deductions.
That gives us the closing balance. We can take this whole thing since we have the corkcrew built in the corkcrew part.
We can fill it right with controlr and we can see what's happening to that PP& schedule over time. Let's tackle debt and interest now too because once we have these supporting schedules done, we get to just hop up to the cash flow statement and balance sheet and link things up pretty quickly.
All right. So, the same kind of thing here where we're going to use a corkcrew. So, we have an opening balance of debt which is equal to the prior period's closing amount. There's no time in between the end of the last period and the start of the new period really.
I guess there's 1 second between midnight and the end of the end and the start of the period. Uh, and then we have an addition to the debt balance or a reduction in the debt balance which is just issuance or repayment. And we've decided to net those numbers into one line here. So you could have it as two lines like additions and repayments or you could just have one line which is the net number. That's what we've done here for simplicity sake. So the closing balance alt equals is the shortcut to quickly sum the opening plus the change.
And then the interest expense in this case I mentioned we're calculating it as the average of opening and closing and then multiplying it by the interest rate assumption. Now you could calculate this with more detail if you need to. Uh but I think you'll find for most models this at least gets you pretty close. Okay.
10%'s our assumption for the cost. So that's the interest expense.
Let's fill it right with controlr.
There we go.
All right. Now that we have this whole section done, we're going to go back and we can fill in a lot more things now.
So, let's jump all the way up to the income statement where we have depreciation and amortization that we can link to the the value we calculated here. So in this depreciation schedule, we calculated what DNA is going to be each year. So we link that up. We also calculated what interest is going to be in the debt schedule.
So we can link that up. You'll notice that it jumps here because we had a change in assumption on interest rate.
It's just to show you how the model works.
Take those assumptions and fill them right.
Okay, we're getting pretty close on the income statement. It just leaves taxes.
We'll come back to that in a sec. But let's go down to property, plant, and equipment on the balance sheet. Right?
We have a schedule for that. So, all we do is go to our schedule and get the closing balance. Pardon me. It's going to be right here. The closing balance for property, plant, and equipment.
I'll fill that over with controlr.
Next is debt. I have a closing balance in my schedule. So, I just scroll down to my schedule, grab the closing balance, fill it, right? We're really making good headway here.
Next up, equity capital and retained earnings. We'll circle back to those in a minute. Let's chip away at the cash flow statement.
We've got depreciation and amortization being referenced here. It's a non-cash item, right? So to get cash from operations, we take net income, adjust it for non-cash items and changes in working capital.
So let's add back this non-cash item, which is depreciation.
Let's also subtract the increases in working capital. If working capital goes up, cash goes down, right? So we need that to be a negative number here.
But even though it's going to be subtracted, there's two ways to do this.
Make it a negative number here like I just showed you and then sum everything up or make this a positive number.
If I go down here and select the changes in working capital, but then use subtraction in the formula here. So equals net earnings plus DNA minus the increase in working capital. I get to the same number. So you can choose your preference. I'll I'll stick with this method since that's what we've done historically just to keep everything consistent.
I can fill all this across with controlr.
Okay. Under investing activities, we only have one investing activity. That's investments in capital expenditures. And capex is contained in our fixed asset schedule or depreciation schedule. And then the total here is simply equals equal to the line above since there's only one row. Okay. So now we have that done.
Let's look at financing issuance and repayment of debt.
We have that up in the assumptions.
Let's look for debt issuance right here.
Make sure you select the right period, the first forecast period, which is 2025.
We also have an issuance of equity assumption. Let's go up to the assumptions.
Equity issued or repurchased. We don't have a dividends assumption here. You'll notice that because we just happen to know that this company is not going to pay dividends, so we don't need to model it. You might want to add dividends as well. You can certainly do that.
So we have our financing section done, right? So we've got cash from operations less the cash that's used in investing plus or minus depending on if it's a source or use of cash, the financing cash flow. In this case, it's it's a it's a use of cash. And then we can calculate this net increase or decrease in cash. And if you look at the historical period, you see it's simply equal to the cash flow from operations. Now, watch your signs here. I'm subtracting investing cash flow. If you put this as a negative number, then you would add it, right? So, you just have to watch your signs carefully.
Opening cash balance is a corkcrew. So, that means we reference the prior closing balance.
And then we add those together.
Let me fill that right to get the closing balance for this period. Fill it across. All right. So, this is an exciting point because now we have a closing cash balance number which we can plug in to the top of the balance sheet. But I want to save that for the very end. I want to do equity capital and retained earnings first.
Often you'll see schedules for those.
Often you could go down to supporting schedules, make one for equity capital or share capital, one for retained earnings, or put them together. In this case, it's a very simple model. So, we're just going to do it right in the balance sheet directly here. So, equity capital is simply going to be the prior period plus any increase or decrease in equity val.
Since this is a net number, we only have to adjust it for one thing. And then retained earnings is the prior period plus net income minus any dividends. But we don't have any dividends in this model. So all we have to do is add in the net income. We can take all this and fill it right.
And now we're getting really close to having this completed. So let's look at what's left. I see that on the income statement we haven't calculated taxes yet to get to our true net income.
Cash flow statements complete, supporting schedules are complete, and then the final piece will be the cash balance here. So, what we should do in preparation for that because I want to see it click in real time here. We're going to have this check that we've built, which takes uh the two sides of the balance sheet and make sure that they're equal. Let's fill it right with controlr. And guess what? You know, it's not. I'll let me see what actual numbers are here. Of course, it's not uh balancing because we haven't finished. And we get this error message above. You can see the if statement I used uh to make that calculation if you want to rebuild it yourself. And what we're going to do is watch this hopefully go to zero and watch this hopefully go away when we finish off our our model here. Okay, so taxes, we have an assumption up here. Let's look where it is. Tax rate, it's just a percent of EBT. We've not separated current and future income taxes here, which you could do if you want to do more advanced modeling. Like I said, the point here is to see how the statements are connected, not to do hardcore tax modeling. So, we're just going to take the taxable income and multiply it by the tax rate.
Like I said, you can get very complicated with tax modeling, and that's fine for later, but for now, we're just going to have this simple tax rate assumption. So now we have our true net income number and still not balancing. No surprise, but that's because we haven't added the cash yet. So let's add the cash and see what happens. Okay, so equals and then I scroll down to the bottom of the cash flow statement. Right, that's where I get my cash. Press enter. All right, it works. It balances. You see, that's exciting. If you are a true financial analyst, a real, you know, kind of finance nut, you're going to get excited by this. I'm pretty excited about this. Look at that. Woohoo! It balances. All right, do a fist pump or something. Go have a coffee. Uh, celebrate in some way. So, all right, we got a fully connected, dynamic, and balancing three-statement financial model here. And we did it in under 30 minutes. So, the point here was to show you that if you know what you're doing and you don't get too complicated, you can build a three-statement model very quickly. Let's do a couple finishing touches, though. It wouldn't be complete if we didn't have some charts and graphs. So, I want to do one that shows revenue and margin. So, I'm just going to go up and uh link revenue, fill it, right? You'll see this chart autopop populates the revenue. And then I want to show the gross profit margin.
You'll notice that I'm referring to or I'm I'm repeating the information, I should say. I'm repeating the information from the model down here next to the charts. It makes it way easier to build the charts and link them up. Okay, let's calculate gross profit.
Um, it's simply the gross profit divided by the revenue.
That's our gross profit margin. Fill it right. And you'll see this is a combo chart. It has a column column chart and a line chart combined. I like this to show you revenue with the columns and margin with the line. Now, let's graph the cash flow statement. This is one of my favorite graphs. It really hits home when you see the cash flow statement visually. So, let's go up and link. All we're going to do, we just want to see cash from operations.
We want to see cash used in or from investing and then cash used or from financing.
Okay. So, we link all three and then we fill it. Right. Let's scroll down so we can watch this chart autopop populate.
Okay, this will be cool. I'm just going to press control-r. Boom. The graph is there. All right. Looks good. It's pretty interesting. Um, what we need to do though is flip a sign or two here.
Okay. So, because our investing cash flow, if you recall, our investing cash flow was shown as a positive number, but it's actually a use of cash. So, you might actually want to go back if this was your own model. might actually, you know, make that as a change. I might actually display this as a negative number. But, you know, like I said, it doesn't matter as long as it all balances, which it does and it works.
And here you can see visually now, all right, the light blue, or I should say the medium blue is the operating cash flow. You can see it's positive and you can see it's growing. That's a nice trend. But, of course, the net of that is like the investing or capex.
is the black column that goes off of that. Okay? And so you can see it being negative every year. Um but then the bigger swings come from financing cash flow. And why is that? Well, because financing can have these big swings and help fund the business or distribute cash or distribute capital back to shareholders or debt holders.
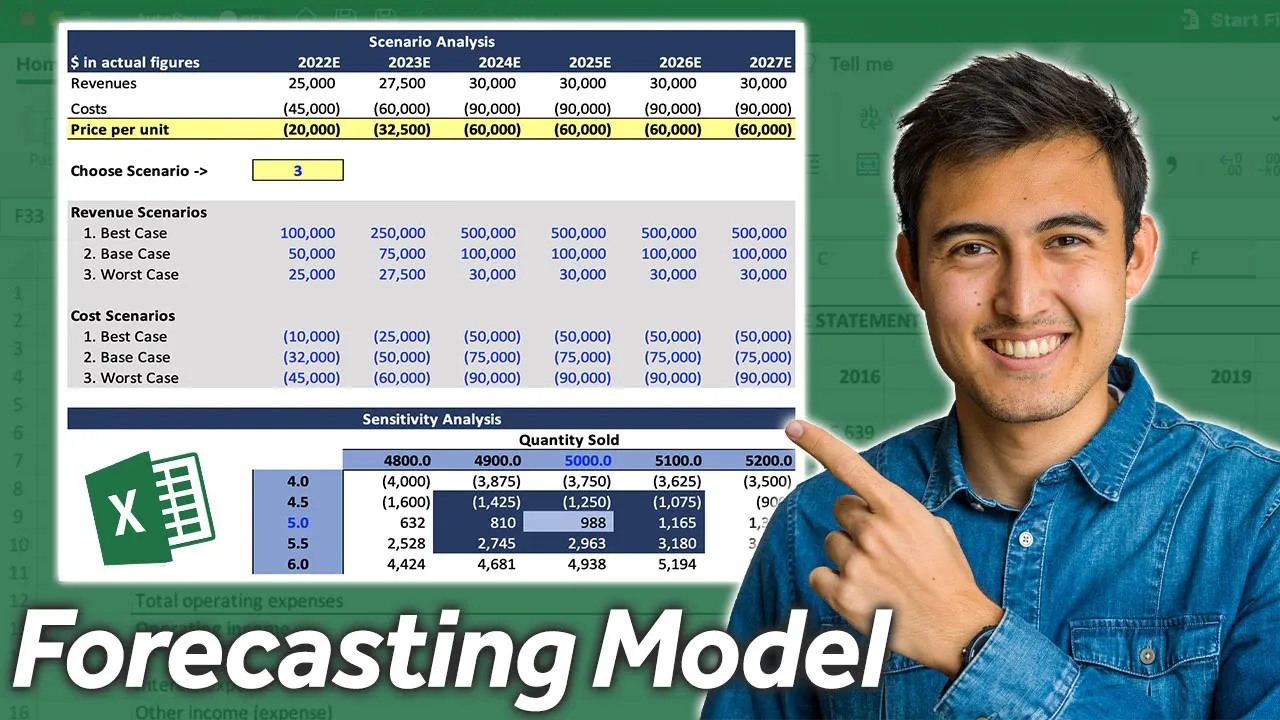
So there you have it. There is our completed three-statement model with charts, graphs, outputs, all the bells and whistles. Hopefully, you've enjoyed this. Um, you can play around with a model now. So, you can let's try a couple scenarios just for fun. Let's try flatlining the revenue growth. Okay, this will be a bit of an audit or sanity check. No revenue growth for the business.
Let's take a look. Okay, revenue is flat as we would expect. Let's see what happens to net income, though.
it actually continues to climb. Okay, let's look at why would that be the case? Well, it looks like a big part of it is in gross profit.
We're actually forecasting cost of goods sold to bump around and eventually drop significantly. So, that assumption is is probably the biggest cause of it. And let's scroll down to the charts and graphs and look at what happens. So, we have our historical period where revenue is climbing, revenue flat lines. The cash flow statement looks okay. Looks like the business could sustain that if it can actually bring its margins down.
But my guess is that it's partly only able to bring margins down if revenue is growing. You know, maybe getting economies of scale. So that probably seems like an unlikely assumption. Or if you want to try another scenario, we could keep this at zero, jack this up to, I don't know, 60% fill it, right? Let's see what happens to the business. Not Not quite enough. I want to push it into a loss. Let's make salaries and wages 25%. Okay, so here we go. Now we've pushed it into a loss.
Let's see what happens to cash flow statement.
Okay, so net income is a loss, but we add back, you know, there's a lot of depreciation and advertisation here. So we're still able to produce positive operating cash flow, but we have negative free cash flow. If you subtract capex from this, you have negative free cash flow. What does that mean? the cash balance should be going down and it is.
Look, the cash balance is declining over time.
Okay. And if you look at the graph here, it's it's quite different where you can see that operating cash flow now uh is is barely positive and and the company is actually decreasing its cash balance over time. So, I encourage you once you've set up the model to go play around with a whole bunch of scenarios and use those scenarios to help inform your analysis.
I just want to leave you now with some final thoughts, which is that a financial model or a three-statement model specifically is just a tool. It's only as good as the assumptions that go into it. Now, that tool has to be mathematically correct in that it has to be properly linked up. But once you've done that, it all becomes an exercise in making good assumptions.
I also want to remind you that there's this hierarchy of financial models.
We've just started with the basic three statement. I encourage you to layer on DCF, scenario, sensitivity, capital structure, M&A, and LBO. We cover all these in thorough courses at CFI. I encourage you to check them out.
They're all covered from A to Z. You'll be a master at all of these. And I should also mention that all of these fall into our world recognized, globally renowned FMVA certification.
So I also encourage you if you want to stand out from the competition, uh get a promotion, move up, have your resume be wellreceived. I highly encourage you, and of course I'm super biased here being the founder of the company, but I encourage you to go check out and earn your FMVA certification from CFI. All right. So, with that said, thank you so much for joining me for this free tutorial on how to build a dynamically linked three-statement model. I can't wait to see you again. Thank you for joining.
Up Next
ESG Framework and Standards: A Comprehensive Guide
@CFI_Official
1.4M views•2022-08-30
Retention Habits of Top DTC Ecommerce Brands Revealed
@SendItPodcast
44K views•2026-03-03
Sensitivity Analysis in Financial Modeling: A Practical Guide
@CFI_Official
438.6K views•2016-05-31

The Planned Obsolescence of Light Bulbs and Tech
@veritasium
25.3M views•2021-03-26
Related Study Plans & Knowledge Roadmaps
Structured learning paths in Business