![[핵심 머신러닝] Anomaly Detection (개요, 확률분포기반)](https://i.ytimg.com/vi/TqSwuCX7Lds/maxresdefault.jpg)


























![[파이썬 머신러닝 실습] Anomaly Detection (LOF, iForest)](https://i.ytimg.com/vi/PSzWsWoebwE/maxresdefault.jpg)



This lesson explains three key metrics for evaluating anomaly detection algorithms: precision measures the proportion of correctly identified anomalies among all predicted anomalies (correctly identified anomalous points / total predicted anomalous points), recall measures the proportion of actual anomalies correctly identified (correctly identified anomalous points / total actual anomalous points), and rank power addresses the limitations of precision and recall by considering the ranks of suspected anomalies, calculated as (2 × sum of ranks of suspected anomalies) / (n × (n+1)), where n is the number of suspected anomalies. These metrics help data scientists choose the most effective algorithm for their specific anomaly detection tasks.
Metrics for Anomaly Detection: Precision, Recall, Rank Power
Added:Fundamental understanding of anomaly detection concepts and how they differ from standard classification tasks.
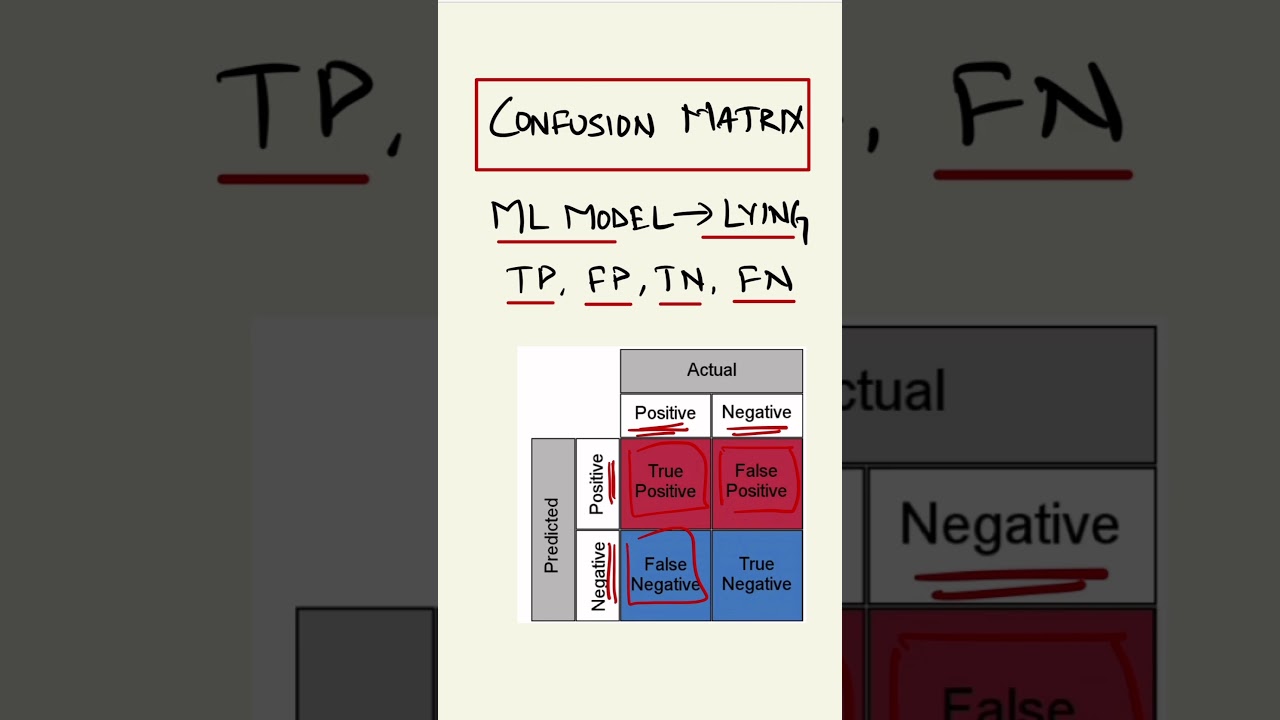
Familiarity with the Confusion Matrix, including True Positives, False Positives, True Negatives, and False Negatives.
The concept of class imbalance and why standard accuracy is a misleading metric for rare event detection.
Basic knowledge of thresholding and scoring in machine learning model outputs.
Evaluating models using advanced curve metrics, such as Precision-Recall (PR) Curves and Area Under the Precision-Recall Curve (AUPRC).
Applying cost-sensitive learning and tailoring the F-beta score to weigh precision versus recall based on domain-specific costs (e.g., fraud vs. medical diagnosis).
Exploring rank-based evaluation metrics like Normalized Discounted Cumulative Gain (NDCG) for prioritized anomaly investigation.
Hyperparameter tuning of unsupervised anomaly detection algorithms (like Isolation Forests or One-Class SVMs) using the studied evaluation metrics.
196 views10likes11:08Original Release: 2021-08-08
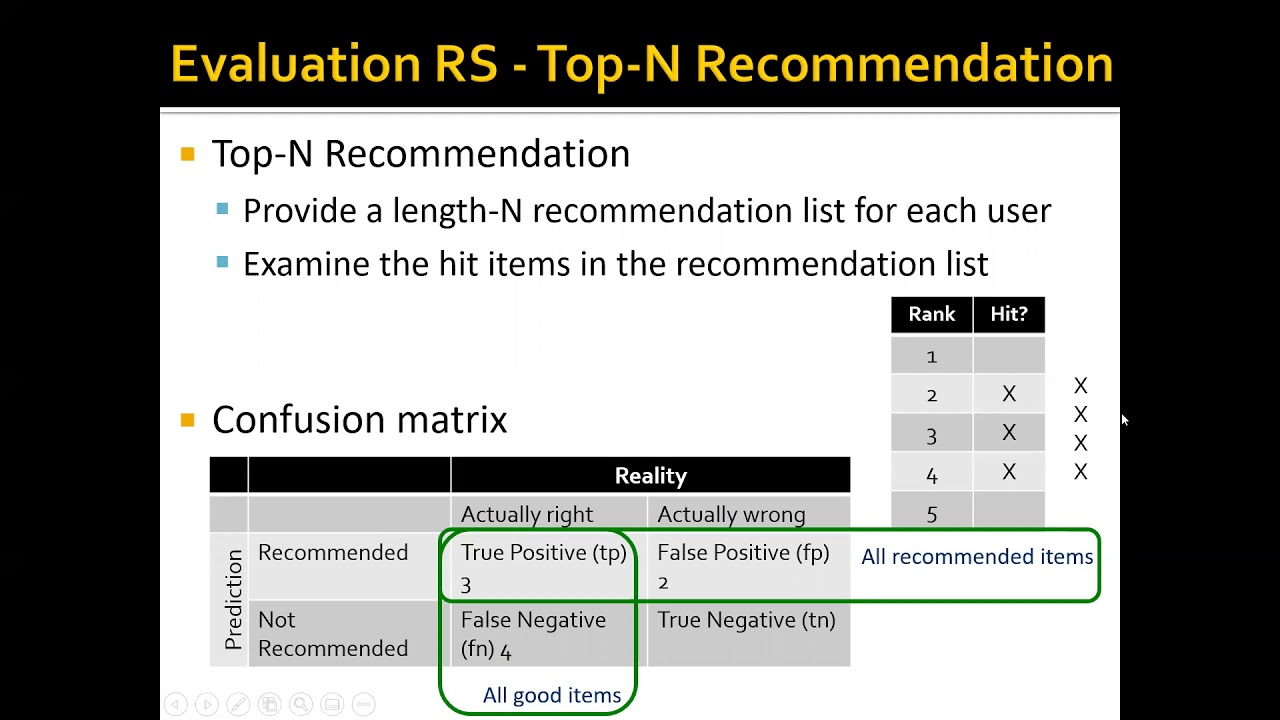
at the end of the lesson you are expected to identify the metrics of measurement of anomaly detection algorithm follow the process of calculating the metrics of measurements and appreciate the use of the metrics in anomaly detection algorithms in applying our algorithm we always ask ourselves how does the algorithm that we have chosen perform because the performance really can affect the choice of the model that we're going to perform for future projects or future data sets of course in the process of this application you have to make some changes you have to make some kind of adjustments so as to conform to the new set of data and variables so that you can meet the demand of the business question at hand so this lesson is actually very important because this will give us the proper understanding of the metrics of measurement that we use for our anomaly detection algorithm but of course we have a lot of algorithms or what i mean is metrics to use for measuring the performance of our anomaly detection algorithm but so far these are the most famous ones so we have precision we do have recall and also we have rank power so we're going to have them one by one so first we're going to have precision what does a precision measure how do we arrive at the conclusion that a certain output given by our algorithm is really performing very much well how precise is it so basically precision answers the question how many of the data points that were predicted by the model to be abnormal were correctly identified to be anomalous by our model we can say for example that m okay it's not working well so i guess i have to change it okay so we have for example um m is greater than zero and this one represents all data points predicted to be anomalous or in other words this is the potential anomalous points out of these anomalous points how many are correctly identified to be unknown those by our algorithm so having these values now we can get the precision using this formula so we have the correctly identified anomalous points then we're going to divide that by the total number of data points that were identified by the model to be anomalous the higher the value would mean that the precision is really higher so it means that our model is performing very much well so when the value is 1 it means to say that all points were correctly identified by the model to be through outliers or nomados so after this identifying the position now we're going to ask ourselves has the model properly or correctly recalled the outliers or anomalous points so this question can be answered by this recall so what is this recall recall means how many out of these empty or true outliers the model correctly identified so basically we can do that by using this computation so just like this one when the value is equal to one then we could say that all true outliers are discovered by the algorithm but of course in the real world this one can be very difficult to arrive at so for us to be able to properly understand these two metrics position and recall we're going to have this example so this one concerns the credit card transaction fraud our data set has 1000 transactions and out of these 1000 transactions we consider 200 to be fraudulent so how do we get the precision and how do we get the recall so it's very easy we just have to plot these values in our formula so 200 so this one empty the ones presumed to be a nomados and we're going to divide that by 1000 and that gives us the precision of 20 or just 0.2 so what is the recall so we've said that the recall is the per person of the two outliers discovered by the model on top of the suspicious fraudulent transactions so we have in this case 200 divided by 200 and that is equal to 1 or 100 percent so this means that our model has perfectly identified all of the data points to be a nomados but then again in the real world this one does not happen as of this moment i want to tell you that the precision and recall actually have some kind of problems when it comes to identification because they are actually very much insufficient to completely identify the anomaly points or anomalous points so in short we can say that they are not very effective in identifying anomalies and why do we say this that using this precision recall does not make our algorithm really effective in identifying anomalies the reason for this is that for example when we have two algorithms used in anomaly detection the result can give us different numbers of anomalies so if we're going to look at this one here in this case we are using a larger number and of course this would give us a small amount so if we're going to use for example two algorithms in a certain situation for example in a credit card transaction one algorithm may identify one outlier to be the most suspicious one but in another algorithm this data point may be identified as the least suspicious here comes the problem in the use of precision and recall because we also have to remedy this kind of situation because not in all cases we may use the same number of data points remember this that we always or in most cases we use the 70 30 for the tweening and the test sets the remedy that we can offer is the use of around power and this rung power can answer the question in the situation that we have just illustrated so what is this one so basically the wrong power can be computed using this formula so we have ri which is equal to empty the number of data points which we have suspected to be anomalous and what we do is we multiply that to itself but then we add 1 over 2 and the summation of the ri so maybe you would want to ask me what is this ri all about so ri is actually the rank of the ith outlier in the sorted list sorted list of the most suspicious objects say for example when we have 10 suspicious data points or objects in our data set so we're going to rank them from 1 2 10 1 being the most suspicious point and the 10 being the least suspicious point so basically what we do here is just we rank the data points which were which are considered to be anomalous so for better understanding of this metric we're going to have this example so supposing we have 1000 data points and we have identified 100 data points to be anomalous so out of these 100 for our mts so what are these four so we have data point one did a point twenty five did a point seventy six and did a point ninety one so how do we get the position it's just very easy just like the number one what we do is we just divide four the empty over 100 or by 100 which is we have the suspicious data points and that gives us 0.04 so this one is not enough because we have to get the rp then so what's the rp just very easy we are just going to plug in our values so we have four and four plus one is five so four times five and we have already identified the positions or the ranks of the suspected or suspicious data points and the truly outliers are 1 position 1 or rank 1 rank 25 around 76 ranks 91.
so what we do here is just we add them and then we multiply the result by 2 and so we have 30 or 20 divided by the result of this one and then we get 0.05 and so having this one is actually better than having precision and recall it's because we consider the ranks of the points which are considered to be the most auspicious and the least suspicious what is this for why do we have to study this basically having the proper understanding of the different metrics of performance or measurement is a great help to identify which algorithm is the best one to use apart from these metrics there are also other metrics to use for us to be able to identify the performance of the algorithms that we are using after all being said and done let's try this what are the metrics of measurement how do we calculate each of these metrics why do we have to know these metrics please write your answers in the comment down below so that we would be able to have a very rich interaction of ideas and we can learn from each other do you want to know more about this channel is click these cards we do have a lot of free data science courses for free like machine learning essentials deep learning mathematics and a lot more here you can always learn an upskill for free
Up Next

65:43
Building Anomaly Detection Systems: Essential Guide
@Anodot-Autonomous-Analytics
133 views•2025-07-28

57:48
Secure Multiparty Computation (MPC): Foundations & Challenges
@SimonsInstitute
7.3K views•2015-05-28

13:03
Bypassing Tor Censorship: Bridges and Pluggable Transport Guide
@Coding_ForEveryone
397 views•2024-06-11

18:41
Neural Networks Explained: Math, Layers, and Learning Fundamentals
@3blue1brown
21.9M views•2017-10-05
Related Study Plans & Knowledge Roadmaps
Structured learning paths in Artificial Intelligence
artificial-intelligence
Aligning LLMs: DPO, TRL & Custom Datasets
01Foundations of Python & Machine Learning
02Transformers and Large Language Models (LLMs)
03Aligning LLMs: SFT and RLHF
+ 3 more learning modules
24h6 modules
Explore Roadmap
artificial-intelligence
Federated Learning: PyTorch, Flower & Privacy
01Python & Machine Learning Foundations
02Deep Learning Basics with PyTorch
03Introduction to Federated Learning
+ 2 more learning modules
35h5 modules
Explore Roadmap
artificial-intelligence
Securing LLMs: Guardrails AI & NeMo Gateway
01Introduction to LLMs, Python, and APIs
02Understanding LLM Vulnerabilities & Threats
03Defending LLMs with Guardrails AI
+ 2 more learning modules
15h5 modules
Explore Roadmap
artificial-intelligence
Building Recommenders: Two-Tower & Vector DBs
01Foundations of Python & Machine Learning Basics
02Introduction to Recommender Systems
03Deep Learning & Representation Learning
+ 3 more learning modules
75h6 modules
Explore Roadmap