

























Driver-based financial modeling is a systematic approach where founders identify the key activities (drivers) that generate revenue and expenses, such as paid marketing, organic traffic, outbound sales, and returning customers, and use conversion metrics to connect these drivers to financial outcomes, enabling accurate funding round sizing and milestone planning rather than relying on arbitrary numbers or unrealistic growth projections.
Financial Modeling for Startup Funding: A Bootcamp Guide
Added:Fundamental understanding of the three core financial statements (Income Statement, Balance Sheet, and Cash Flow Statement) and how they articulate with one another.
Basic proficiency in spreadsheet software (Excel or Google Sheets), including dynamic formulas, cell referencing, and financial functions.
Familiarity with startup funding mechanics, including venture capital stages (Seed, Series A), equity, dilution, and pre/post-money valuation.
Understanding of key operational metrics and unit economics, such as Customer Acquisition Cost (CAC), Lifetime Value (LTV), and Churn Rate.
Advanced valuation techniques, such as Discounted Cash Flow (DCF) analysis and the Venture Capital method, to estimate a startup's worth during negotiations.
Sensitivity and scenario analysis to stress-test the model against market volatility and changing operational assumptions.
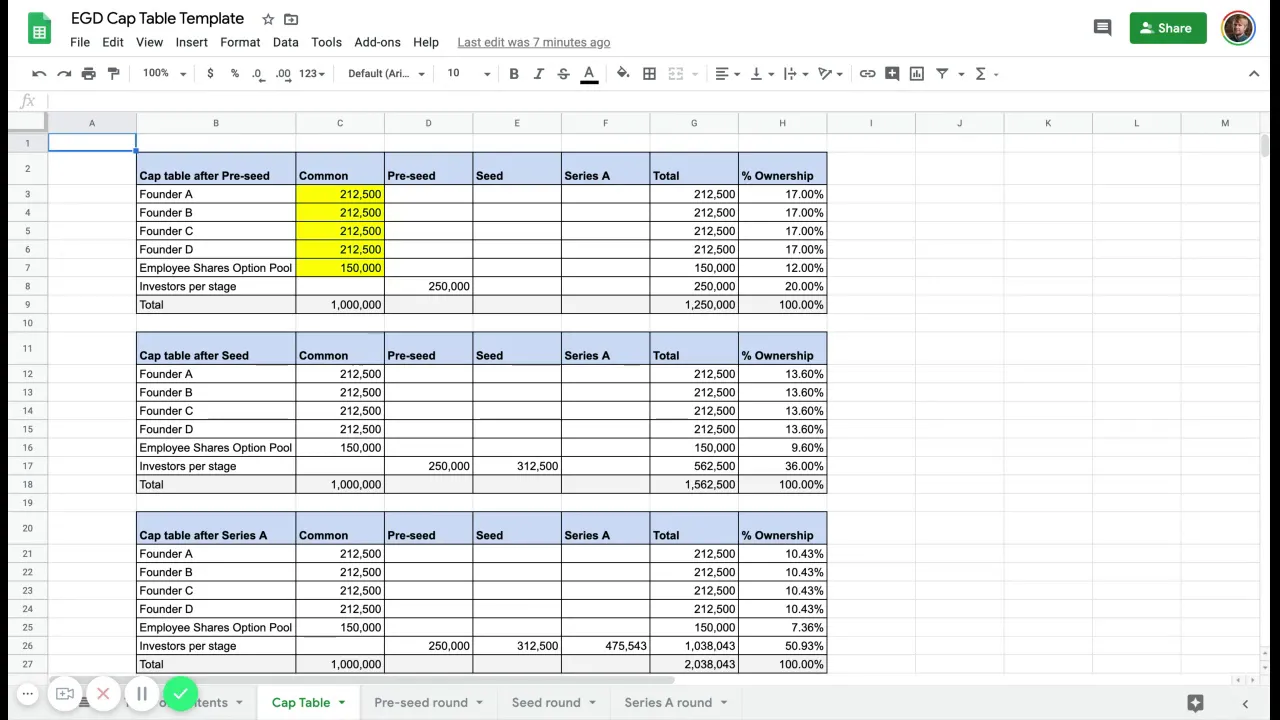
Cap table modeling and waterfall analysis to determine exact equity distribution and payouts for founders, employees, and investors during subsequent funding rounds or exit events.
Implementing Budget vs. Actual (BvA) tracking processes to manage cash runway and operationalize the financial model post-funding.
520 views28likes47:10Original Release: 2025-09-26
Hello everyone. Thanks for uh thanks for tuning in and thanks for waiting uh and thank you for joining to our thank you for joining our our session today. So I uh I started doing these sessions on um budgeting a funding round uh a bit to show you how the process works but all but mostly to kind of prove to you that you doing this the right way like actually budgeting how a how a startup funding round works is not as hard as people might think. Like when I think that when people hear financial model assumptions and and all this like financial terminology, they get scared away a little bit and they end up not doing the homework. U but it is really important homework if you're if you're looking to raise money. You know, I I I look at uh dozens of pitch decks every day and the Yeah. like it's usually when when somebody hasn't done their homework on the financials, you you can tell. Uh and that's kind of what I want to make sure that doesn't happen to you. So, um we have we have a lot to cover today, so I don't want to I don't want to mingle. Um we will have time for questions at the end. So, let me just rearrange my screen and we can get started. Just a sec.
think that this uh should this should be should work decently well for Yeah. Okay, cool. Uh no, I lost myself.
Sorry. There you go. Uh I think that should work. Okay, let me know if it let me know if it doesn't like throw in the chat. I So I am doing this on um on Zoom for you guys uh that signed up for Slidebean and I'm doing this on Google, I'm sorry, on uh ah on YouTube. So, uh, if either doesn't work, I have chats and I can multitask decently well. Okay. So, so, uh, again, the only reason why I kind of know a little bit of how to do this is because we've been helping founders uh, prepare a pitch or like run through the pitch today or help us with some of this stuff for for a few years now, like about 12 years since we started selecting. And um, we we see these common problems around numbers.
This stuff that kind of keeps happening.
Uh first of all that the round size is just this really random arbitrary number. It's like oh we're raising a million dollars or or we're raising between 1 million and 3 million and it's like okay like that's that's a big range. How much money how much money do you actually need for for this business?
Uh typical case. Uh another one is that your growth projections um are just like this fantastic magical 10% month-over-month growth. Uh if when that happens, it's usually a sign that something uh doesn't that something doesn't work or isn't working. Um and another big mistake that I that I made myself is just assuming that the round size um is based on on the number of months of runway not reaching a certain milestone. We we'll talk about that in a sec. So we'll we'll fix all of this uh by the end of the session. We'll we will have fixed uh most of this stuff. Uh and then the answer to this, you know, you might have been asked for a performer template or a profit and loss or or you might have been asked like how much asking yourself how much money you need to raise. Maybe you Googled a runway calculator. But in the end, the ultimate answer to to this question is a financial model. That's that's what a financial model does. Um so let me show you really quickly how uh usual financial model looks. Uh let's go here.
See if I can if I unbreak this.
Okay, took my face somewhere. Okay, cool. Um, so, uh, this is a very very very basic financial model called the intro financial model. I'm going to give you a link to download this stuff soon. Um, let me move this around here.
Okay, cool. So, um, basics of a financial model, you have this stuff.
You have revenue, you have costs. Um, you know, just to kind of understand the basics of this, let's say that you made $1,000 worth of revenue uh selling t-shirts and then you spend $500 to print those t-shirts. Basically, your company made a gross profit of 50%.
Right? So, half of that became profit to you. Um, now that doesn't contain that doesn't account for salaries, right? So, this is just the gross profit uh that the business made. Let me hide this up so we have more space.
Okay. Uh that's just gross profit. If you go on and say, hey, like I'm going to, you know, make myself CEO and I'm going to pay myself some crazy salary uh starting January, right? Like notice that what I'm doing here is I'm taking the salary, I'm dividing it by 12 and kind of basing it out the start date, right? So the company at at its core, right, that the business that we've made is still profitable in the sense that revenue is bigger than costs. That's important. If if this these two numbers aren't working, then there's there's a big big problem with your with your company. Uh but then after that, salaries and other expenses come in, right? And that does make you unprofitable, right? But it's but and this is the net income that the company makes or your burn rate. Uh but it's not it's different from your gross profit, right? So gross profit is just the business at its core, making sure that it it can make money. Uh and then there are other expenses, overhead, development costs, etc. that you that you have to cover. So let's uh go through a very very basic scenario.
Let's assume that uh I see MCU there. I see you on uh on on YouTube. So like MCU is going to be my co-founder and we're both going to start working on this. It's already September. So let's maybe say November.
Um okay. So we're paying ourselves maybe a smaller salary. Um we're bringing in a third co-founder. Let's uh bring someone from the Zoom session. Who do we have here? Uh Hunter. So let's bring Hunter is also a co-founder and we all started we all started working on this company here. Okay. So notice that the first thing that's going to happen is you know we started set a start for set a start date for November. Uh we have our expenses here. And if we expand this cash flow section here at the top, we'll see the company you the company cash flow over time. So right what what's basically basically happening is you know we we're spending 12500 every month on in our salaries and then next month we'll be minus 25 and then next month minus 37 and so on and so forth. So you know that's what we would need to raise money for right that's that's um that's you know we don't have this cash. Let's assume that we don't uh so we don't have this money. We need to raise it. Uh so let's let's just assume that November we were able to actually secure some funding from investors. Let's maybe for now let's just put a you know test number. Let's maybe say 250, right? So 250, you know, of course covers this cash balance. We will run out of money eventually, right? So we'll get to zero and then you we'll be in the red again.
But we've essentially bought ourselves some time, a few months of work to you to launch this business, right? So let's think a bit about launching. I have this other metric section here at the top. Um so let's say that we all quit our day jobs and start building this product, start working on it by November and then we um yeah, by November. And then it's going to take us a few months to launch it, right? We we have we haven't started doing anything. So let's say that you know from November through May we're going to start building and here here in May we're going to launch it right. So this is just kind of basic calendar assumption if you think and then we have this new clients input.
Notice that all the inputs are blue here. Um so we're not going to have any customers from here through here. God, what's going on?
What the hell? Let's refresh here.
Oh, my internet my internet is acting up or my browser is acting up. Uh, let me sorry. Let me just sec what's going on here.
Okay, that that's good. My bad. Uh, I don't I never restart my computer. I'm I'm really bad at that. like I've just I just like turned it I just couldn't close the screen. Uh and that kind of creates this these little issues. Okay, I got it. So, uh like I said, uh we're raising that money there and then we are not getting any customers through all this and then in May when we launch uh that's it, right? We start getting about 50 customers a month. Um good, good. So, we have you know I just set this input of 50 customers every month. Fantastic.
And then all we really need to do is we can set up a churn rate an assumption of how much customers are going to cancel.
Let's maybe set that to 5%.
Uh and then we have an MR. So our subscriptions per client u subscription pricing, right? So let's say it's uh 49 49 a month. Okay. So notice that when we do that here uh we have these 50 customers that we add and then next month we add another set of 50 customers up to 98. We lose three because of churn and then another 50 143 and so on. So the model, the spreadsheet is taking care of calculating that for us and it's converting that into revenue, right? So notice that we have this revenue that scales here. Um and we have this you revenue scaling to 22,000 and so on. Uh and that still doesn't make us profitable, right? So uh we're still burning through money here, but here we actually hit profit in October. Um in October the company starts making money and we still have about 147K in the bank. So, in theory, if if we were right about this, we could change how much money we plan to raise and not raise the full 250. Just raised 100K. Uh we're short a little bit. So, maybe bump that up to 125, right? So, 125. We never run out of money and then by here we kind of became profitable. Uh our net income is positive. We're paying for the team and that's done, right? So, good. Our business needs $100,000.
Uh, and we're done. Now, I've been working on this. Oh, sorry. Sorry. Um, now there I always kind of work on this a little bit and then kind of give you this this plot twist, which is like this model is is trash there. Something that I did in this spreadsheet is really really wrong. I did something badly incorrect. Uh, when making these forecasts, I made it as simple as possible. Uh, I cut a little bit of corners. We I should have added more expenses, but there's something even there's some even bigger flaw about this model. Um, let's see if you guys can guess what it is. Any ideas? Throw it in throw it in the chat. Uh, R um, sorry, Ryan Jeet is asking if we're if I'm sharing the file. Not this one cuz it's trash. Um, I'm going to I'm have a better model. It's free. Uh, so you'll be able to download it. I'll give you the link at the end of the session. But yeah, like you guys on YouTube and uh you guys here on on Zoom, like what's wrong? focused on months of runway. Um yeah, a little bit but you know we made we got to profitability. Um Rej is saying assuming simple revenue line I think you might be on the right track.
Um what this model assumed right is is something that I heard from from a founder once or more than once. They said something along the lines of hey we're going to generate 700 orders the month that we launch and then that number is going to grow 10% every month.
So he had actually done this math. He had actually run this forecast. So if you looked at this at his model at his spreadsheet, he had something like this, right? He had whatever 700 customers a month and then uh that number was growing just multiplying it by 110%. He took that, dragged the formula on the sheet and came up with this beautiful nice beautiful looking hockey stick chart. Um which is which is bogus, right? Like how did he come up with it?
you just like put a 700 and multiplied it by 100%. And and like the problem is the reason I stop at this is like I see these decks all the time. You see this in pitch decks all the time. They just have this hockey stick chart. You look at the formula behind it, it's just like a 110% scaling. So please, please, please don't do that. If you take one lesson from today, it's like that's just we can investors can smell that. It's very easy to tell when when you haven't done your homework on the financial model. Now, uh, what so what what do you actually need to do? We actually need to do is we'll understand well that every month we're going to have revenue.
That's that's fine, right? We're going to have extra revenue coming in each month. Um, and then we're going to have expenses too, right? So, we we've kind of color coded them a little bit on the sheet if you remember. So, we have uh revenue green and then we have costs, right? The cost of serving that revenue and then expenses which tend to be high at the beginning, right? Because we have salaries that we're not making up for yet, right? So, we have revenue and and these all match up and they probably end up negative at first because we're spending more than we're generating and probably every business starts there.
Um, okay. So, the question here is, well, what is it that we're doing that's driving extra revenue for us? What activity is the company doing that's going to make revenue grow? And what activity is the company doing that's going to make expenses grow? Right? Both of those tend to grow ideally uh with time. Um, okay. I usually have that a trivia question here, but I I want to make sure that we kind of push through.
So, let me go back to that that chart.
So, um you know, when I'm saying like what's driving revenue, right? What's driving orders? We I mentioned like the t-shirt shop example. Um you know, what's driving extra orders? That could be traffic. That could be subscriptions for you. Whatever KPI is more important to you, what's driving it, right? what activity that the company does creates more traffic or creates more subscriptions or creates more more monthly active users. And at the same time, when you have more of those, what do these orders drive, right? Do you have extra fulfillment costs because you grew you have do you have extra hosting costs because you have more customers, API costs for your whatever AI tool you're building? Uh do you need a bigger account management team when as you grow? Like that's that's what this um you know mindset is about. what what is driving what when you're when we're talking about expenses in your company.
Um and when you when you think of drivers, right, when you when you're thinking that something is driving something else, um you kind of land at something like a flowchart, right? So, um revenue at the core, let's let's think of revenue at the core. Um we establish that revenue drives costs, right? Right? So if we remember um you our gross profits are revenue the more revenue that we generate the more costs that we have. If you have a t-shirt shop every shirt that you sell is a is a t-shirt that you have to print or that you have to manufacture or and you have to ship right. So the more revenue you have almost proportionally the more costs you're going to have. And you know that something scales something is a cost because it scales kind of proportionately along with revenue. Uh yes, you can, you know, get into economies of scale and so on, but there's always going to be that scale.
For every order, for every customer, we're going to have to spend this.
That's an easy way to identify cost. COG stands for cost of goods sold. Um but at the same time, sorry, at the same time, uh there's there's a driver to revenue, right? There's something that you're spending probably that's going to drive extra revenue. Um a lot of people like kind of think of, well, once we generate revenue, we're going to take 20% of revenue and spend it in marketing.
That's not how it works. It's the other way around, right? You first have to spend money in marketing and then you generate revenue. So the understanding this causality, if there's anything that you want to screenshot or steal from this from today's session, it's it's here. Um so what are potential drivers, right, that that generate revenue for a company? One potential driver could be paid marketing, right? So the more um the more paid marketing you spend, the more customers you convert. Pay marketing could be a group of search ads, display ads, retargeting, sponsors, whatever. Another potential driver could be outbound sales. Uh maybe you're you're you have a team that's finding leads for that's finding leads uh that's trying to convert people, etc. Uh maybe they're hunting LinkedIn or sending cold emails or cold calling. That would be a driver of revenue. The more the bigger your outbound sales team, the more leads you're going to get. Um another potential driver could be organic traffic, right? So, if you're doing uh PR or if you're doing SEO uh and weird times for SEO with with GBT search with AI search, but anyway, if you're doing SEO uh organic traffic or PR referrals, like that's just traffic that comes to your website and converts, right? So, and another potential driver could be returning customers, right? So, the more customers you have, uh you know, the lower your turn rate, you have a retention team that's kind of in charge of this. But not all these drivers are created equal. You have some drivers that are very much expenses to the company. And if you remember the color coding, we had red, sorry, we had green, then red, it's like magenta, and then the cyan color for other expenses.
That's where we put our salaries. Why?
Because, you know, we have to spend that money. We have to spend the marketing money or we have to spend money uh to hire that outbound sales team. Um so those are drivers that have a direct cost. Uh there are other drivers that don't, right? But there's still some like indirect cost tied to them, right?
when we have for example marketing um when you have for example uh organic traffic you you need to assume that there's a marketing team that's driving that traffic or when you have returning customers you have to assume that there's a retention team that's kind of in charge of that now one big difference between these two is if you double your marketing spend you normally should double the number of leads that you get right if you're doing Google ads if you spend double you probably should get more or less double the number of leads maybe even better uh but if you double your marketing team, do you double your organic traffic? Not necessarily, right?
Because those are not necessarily one driven by the other. Um, so they're they're important to remember, but they're not like a driver. Um, but then the important part here is like all of these depending on if you track them correctly, they're going to be a driver of revenue, right? So there's a cost. Damn it, I can't find put place to put my head. Sorry. Um, so like they're a driver of revenue, right? So, for example, if you're thinking paid marketing, like how do you convert paid marketing dollars into revenue dollars?
Well, normally you would do that do that through a cost of acquisition. Uh, and how do you convert outbound sales to revenue? Well, normally on a number of sales per agent, right? A number of leads per agent. Organic traffic, you would convert that into customers on a on a website conversion rate. Uh, and then returning customers, you would convert that uh on a on a turn rate. So, like there's this cause and effect.
There's an arrow that connects the two.
Uh, and there's there's this conversion rate. There's a conversion rate metric that um that lets us track how how one converts to the others. Okay. So, I'm going to show you some what I call model maps, which are kind of like actual build flowcharts for common businesses, and then I'm going to build one for you guys. Uh, so Josh from my team is going to paste the link to the Zoom session to you guys on YouTube. So, if you're going to move to the to the Zoom session, uh, and kind of raise a hand. And then for you guys on Zoom already, um you just raise a hand and we'll I'll bring you up and we'll actually build one of these for your company. Let me show you a few examples first while you guys uh do the joining and so on and we'll we'll bring it up. Okay, so just as a reminder, we have some color coding that we established. Revenue is green, costs are red, uh sales, selling general and admin expenses or expenses are blue. Um and then uh capital expenditures are yellow, which don't we don't generally use in startups, but yeah. Okay. Um, and let me walk you through some of these uh some of these model maps. Um, move my head somewhere. Uh, okay. So, this is like a typical e-commerce, right? We've been we've been um we've been talking about e-commerce about the t-shirt shop. So, let me give you an example of how this would look in a in a model map. Um, you would have paid marketing and organic traffic as drivers, right? So, uh, notice the blue arrow. That's the driver. We identify it like that. It's like this is the number that we're modifying on the spreadsheet to or like that that we're making assumptions on and that's what's going to drive everything else, right? So, we spend more money in marketing or we assume that we're going to get more organic traffic that our team's going to drive that traffic and we convert that make this bigger um and we convert that on a cost of acquisition per order to orders from paid marketing. And if we want to track those correctly, if we want to understand um you know which orders came from marketing and which orders came from organic, we need to track those separately. So that's why we have a different box for each one of them, right? So but once we add those orders in, the ones that came from paid marketing through cost of acquisition and the ones that came from organic traffic through a conversion rate, we get into a total number of orders. Um now from the total number of orders we have orders that we have to that we get revenue from uh through a markup we can estimate how much the cost of goods is to those orders and we have shipping and handling right for every order that we ship we have to account for the shipping costs.
Um let me give you another example maybe more familiar to more of you a typical SAS company. Um this is what I call a self-service SAS. So that's kind of like um you know something that you sign up for for on yourself maybe like ClickUp or yeah subscription that you that you there's no sales team here is what I'm saying right automatic onboarding stuff like that. So um paid marketing is a driver and paid marketing through a cost per signup drive signups and again we track our paid marketing signup separately. Uh and then we have organic traffic which is which is a a a number of visitors to the website if you will and then there's a conversion rate to sign up on that landing page right and I think an important thing here is that most of these numbers we can we can Google right we we can find out what a typical paid marketing like cost of acquisition or cost per signup is it's about 10 to 15 bucks maybe 25 depending on the depending on the product and the geos but yeah something like that organic traffic like a landing page normally converts at 15 20% that'd be a good conversion rate. So you know when you're making assumptions for this model you can find references right of of benchmarks to decide you know if if the um you know if if what you're inputting what you're assuming is you know sensical if it makes sense. Okay. So then we have trials or signups or free users, premium, whatever. Uh and we have a conversion rate to customers, right?
Those are actually paying customers. And then customers have uh give us revenue green box. There's a churn rate, there's a monthly subscription, whatever. And then uh for every customer that pays that activates that uses these features, we're going to have a hosting cost uh for each one of those users. So that's a typical like classical uh self-service SAS company. Okay. So now let's actually build one. uh raise a hand. I'll bring you up if you want me to kind of take a stab at your company. You'll need to tell us a few details. Don't worry.
Nothing too secret, nothing too major about the company. Uh and we'll uh we'll build it out. Okay. Let me share the right screen that find a place for my face.
Uh yeah, let's keep it here. Okay. Uh and okay. Any no takers? No. You want to raise a hand? Yes. No.
I can build like a generic company like a an example but uh it's better I always like to kind of at least uh help help somebody with that. So no hands on Zoom going once going twice.
All right, that's fine. Uh we'll we'll uh I'm just going to show you a few examples and then we'll build one of those like we'll bring one of those to the spreadsheet. Okay. So, uh this this template this this uh this is Miro uh no sponsored not a sponsored uh use this is a fantastic tool for like flowcharts and stuff like that. Uh brainstorming. Um I'm going to show you one other example that's maybe a little bit more typical to many of you. Uh which is what I call like an inbound sales model. So from inbound sales the idea is that you um you drive leads right? you bring leads into the into the platform and then from the leads that you generate you have a sales team that's in charge of attending to those leads right um so let's look at inbound sales we have two drivers organic traffic and paid marketing right so we have uh an organic traffic box that converts to leads through a website conversion rate uh and then we have a paid marketing box that converts to leads on a cost per lead right again another metric another reference that we can find uh uh and understand. So like I was saying like a good website conversion rate could be somewhere in the 20%. 20%.
Right? So and this would be our input 20% is our assumption for this. Uh and then here our paid marketing cost or cost per lead let's maybe say it's I don't know $95.
Um which is also decently standard for like a B2B platform. Cool. So 20% and 95% sorry $95 and then that gives us leads. Now the big difference between the other models is that we were looking at is that from the number of leads that we get uh we need to have a sales team that looks to those leads, right? We need to have an inbound sales team that takes those calls. Maybe that lead is a call. Maybe they follow up over email or maybe they schedule something. But the more leads we have, the bigger our inbound sales is going to be, right? So our inbound sales team is driven by the number of leads, right? So again, we in our model, we're going to control, we're going to input how much we spend on marketing or how much traffic we assume we're going to get. Uh but then there's this direct cost of lead of a sales team that that's going to grow depending on the number of leads. And what's important with these models is that this is kind of going to force you to say, well, if I suddenly assume that I'm going to get a,000 leads a month, well, I'm going to need to hire a team to look to those leads. Uh, and if that functionality, if that kind of flowchart is is mapped out, then it's going to make your life a lot easier.
Um, then we get to customers, right? Uh, conversion rate, inbound sales. Uh, we could have a sales commission situation here. whenever somebody converts and then we're going to have a hosting cost out here uh just like just like we had before. Okay, so that's just an example of of another revenue line. Uh but let's actually see how this looks on a spreadsheet. Um so this is the good model. I'll I'll give you a link. Let actually let me give you the link first.
That way you guys can play around with it. Uh let me uh let me share the screen and give you the link where you can download.
Uh oh yeah my team will paste it too uh on you know that that link on so there you go this is this is the link to the good spreadsheet uh feel free to download it make uh well actually you'll need to sign up for slide free and it works in our platform uh so you can't download it sorry but uh it works and it's free uh that's the that's the important part you can just use it for free so does it get better than that I don't think so uh okay let's get back to Okay, so um we're at this model. Notice that it looks not too different from the one we had before, right? Where we have uh revenue in revenue costs, etc. But notice that we used to have like blue numbers here to input stuff. But now these numbers are black. Uh and that basically means that we were getting those numbers from somewhere else that the model this is a formula and that we're kind of extracting that number from a different sheet. And what what we actually have is we have a dedicated sheet for each one of them. We have a dedicated sheet for revenue. Um and we have a dedicated sheet for uh costs and so on. So normally where I like to start in these models, oh by the way, also notice that we have like this kind of historical um color coding, right? So anything that's in the past is purple.
We're in September, so that's the future. I mean, at least the closing of the month is the future. Um, so, uh, let's, you know, let's work through some milestones first. And I always like to start here in milestones. Um, so it's September. Uh, we're going to start this company. We're going to start building a model and we're going to raise and we're going to try to raise a preceeded round.
But preede rounds take about 6 months to close. So, you know, if it's September, I think we could be optimistic and say that we're going to close this round in February. Preed close. Right? So that this is a milestone and this milestone is going to work across the model.
You're going to see how in a sec. Um and then once we close the preede, we're going to assume that all the founders are going to start working on this full time and it's going to take us a few months to launch our MVP. Uh and then after we launch your MVP, when we test a little bit, we'll have a launch date for the product. Uh kind of around August maybe. So about a year from now. Uh assuming that we've raised this funding.
Okay. So these milestones again are are super useful to you know to a bunch of other stuff in the model. Uh and if you go to the revenue sheet for example you'll see those milestones here at the very top.
So you kind of every every sheet our expenses sheet and our cost sheet is going to have those milestones. So it's kind of like a good idea of of you where we are. And the reason why I like to start there is first because it's easy, but also because what I want you to think about with these models is well, how much is it going to take us to accomplish this, which in turn kind of converts it to how much money do we need to accomplish that? Um, okay. So, let's go to assumptions. Assumptions is always kind of like a dashboard sheet um where we can input the the main stuff that we that we need to forecast for. Um, notice for example that we have staff here and we have the team that we talked about before. So, I'm just going to be I'm going to be CTO of this company. Um, we had MC War from YouTube was going to be CEO and then who else do we have here?
All right, let's do Ranjit. Um, is going to be our our is it co. Okay, so let's enable these roles.
Um, let's we can define a salary for them. So, let's set it to 60 for everybody. This is annual of course. And then the start date. Notice that we can pick from the milestones that we had before, right? So we can go and say, "Oh, let's actually have uh everybody start paying themselves when we close the preede, right? Um we can add more team members." So there's a dedicated staff sheet for this. You'll see the people that we already added. This is me as CTO, but we could start, for example, adding a marketing team. Um we're not going to have like a CMO just yet because it's maybe a bit overkill for the early stage, but maybe let's create this scaling team that starts uh when we have the MVP, right? So, we'll have a senior marketing team that we start hiring when, you know, when the MVP is ready. Um, we're not going to fire them.
And then there's their salary maybe is the same. They're not founders, so we have probably have to pay them closer to market salary. Um, this is I don't know if this market salary wherever you guys are based, but I'm just going to keep the whatever the template said. Um, we have payroll taxes and benefits, annual salary increases, and all that stuff.
And then the number of buyers. So we could say, well, let's add a couple of marketing people every, yeah, every quarter is fine and let's scale that team to 20. Right? So over time, we're going to see that number scale. And what this dashboard does is basically solve that for us. We don't have to like go and say, oh, new hire, uh, 5,000 bucks a month, whatever. It actually creates those roles. So notice that here we have staff, we have the founders at the preede close, and then at MVP we have those two extra marketing people. and then 3 months later more people and so on. And the salaries of course uh get calculated automatically based on that. So that's that's that's already done. You don't have to do it again. Uh that's what the template's for the good the good one. Okay. Um so let's go to the monthly sheet back.
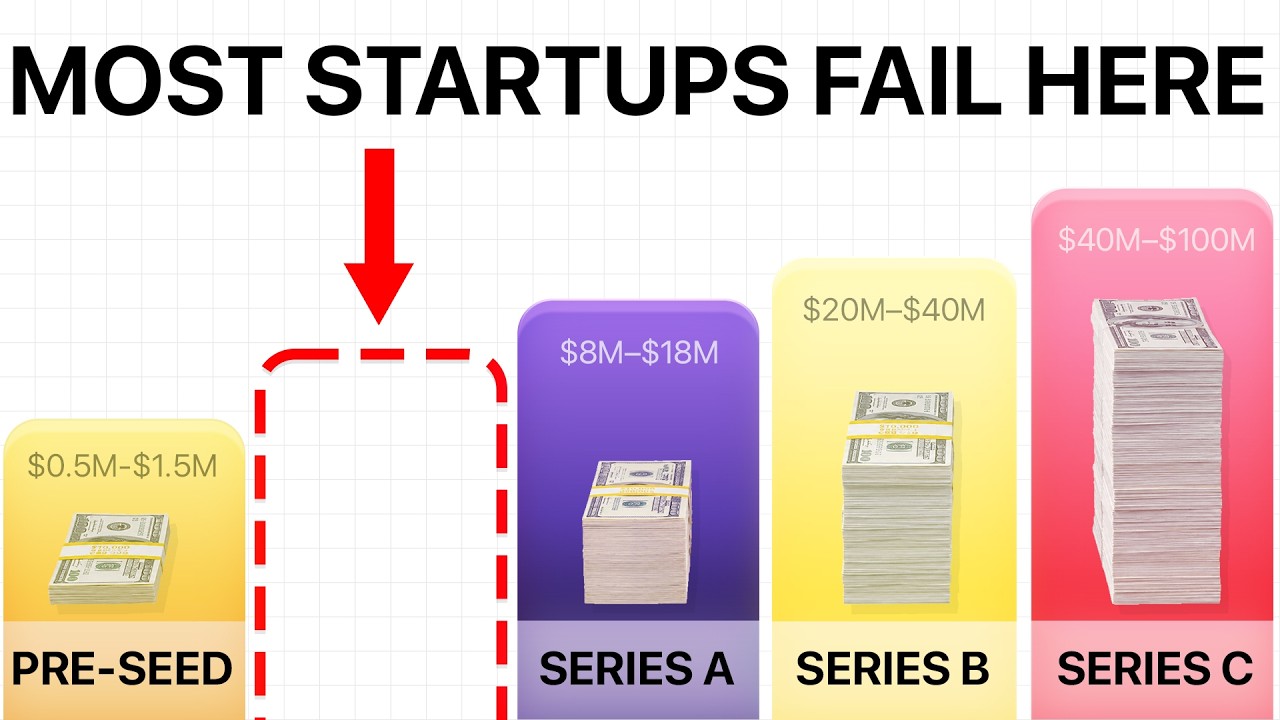
Right. So now we have this cash balance at the end of the month month. Now what's really important with with rounds of funding is that whenever you raise money, it needs to be enough to get you to the next fundable milestone, right?
Um, so if we're raising a preede round now, which is when then we raise I mean or in in February, we need to make sure that the money that we raise is enough to get to seed stage, right? Uh, and what is seed stage? Well, seed stage in this day and age for SAS is a company that makes 20 maybe $30,000 in monthly revenue. Um, so when do we hit 20 to $30,000 in monthly revenue? That's that's the question, right? That's a big question. Um, so in assumptions, we have some stuff that's uh built out for that.
Uh, we have a revenue line, a sample revenue line that we've built out.
Notice how we have this little guidance chart here on how much we're spending every month if useful. Uh, and I'm going to enable a SAS model. Like this spreadsheet comes with both a SAS model and an e-commerce model, the ones I showed you earlier, like the maps. Uh, so that those are kind of pre-built here. Uh, so you don't have to build anything yourself. We of course have room here for other revenue lines. So, if you go to the revenue sheet, you'll see that we have that first revenue line, but then others where you can kind of build your own custom formulas. We actually have a boot camp um like a like a weekly like a oneweek boot camp where we go over like formula building like deep formula building on how this stuff works. Uh my team will paste the link uh soon. But uh considering what we have here now, let's remember our model like let's remember our map. We have organic signups, we have paid signups, and we have conversions, right? So, it's kind of like what we had here, just exactly what we had here, right? Paid marketing, organ traffic, conversions, and so on.
So, let's see it. Uh, let's Well, of course, we're not going to launch in um, you know, we set this launch date to August 2026, right? So, we're going to set that August 2026.
Um, and then we're going to assume like how much you about organic traffic. So, organic traffic is, you know, is how many people are going to come to our website.
um you know this is arbitrary in the sense that we we haven't been forced to forecast a team right but but uh we did right so let's remember that again that doesn't happen magically we did create this senior marketing team that starts in what was it oh when we launched the MVP which was uh let's go back to expenses here here in June right so uh at the launch date of of August here let's say that we're already at 1,000 visits a month. I can buy that.
Yeah, like they're doing some good social media work, Tik Tok, whatever.
Uh, and let's assume that that traffic is maybe increasing 5% a month. Uh, and then our conversion rate from that traffic to sign up is again a benchmark, right? Uh, we know this benchmark. It's going to be 50. Again, a good landing page may convert at 25, but we don't want to do the best case scenario. We want to think conservatively. Just make sure we don't run out of money. Okay.
Uh, next up is paid acquisition. Uh, so we have those ads too, right? So, how much are we going to spend in marketing?
We can be a little bit more uh aggressive here if we will. So, let's maybe start with a 5K monthly budget. Of course, that you'll see how that increases our expenses a lot, but also increases our revenue, right? Because we're gen we're using that money to generate ads. We maybe increase that budget maybe 10% a month. I'll buy that.
And then the cost per signup is maybe 10, right? So, five is maybe too optimistic. Okay. Now, we have conversions, right? So if we're looking at this map, we had this to this, this to this, and now we're converting trials to customers. Um, so let's see if our conversion rate to paid is maybe five, I think. I mean, I I'll give you some of my metrics like in the states, our platform converts maybe at 5%. Uh, sign up to paid. I'd say that that you can buy I can buy that. Uh, this is like a premium product to paid in the states.
uh you know in other in in the developing world in Europe it's maybe three four in the developing world it's maybe 1% right so I I guess that connects a little bit to where um where your customers are mostly based where your signups are coming from that's what's going to define um where that come how that behaves but okay signups are paid at 5% we have an average monthly revenue per user let's maybe set that to 49 is what we had before and that turn rate uh there's a hosting cost per active customer 10 which I think is too much let's set it to uh and we have the credit card processing fees. Okay, so now we've set it. So let's see what how that looks. Um notice that here at launch we start generating revenue and then based on our our you know the standard that I mentioned you know a seed company is is a company that has about 20k in monthly or in in MR. Uh notice that we're kind of hitting seed metrics kind of like here, right? So this is, you know, in kind of like in milestones with our current assumptions, we're hitting seed metrics here.
Basically, that means we have 20K in monthly recurring revenue, which means we can go to an investor and start pitching our seed round, right? Start pitching to raise another round because we're still of course not profitable. Um but but um raising our round takes about six months to close. Uh, so we have one, two, three, four, five, six.
December is a really bad month to raise money. So we assume that it's not it's not that close in December. Let's maybe close it. In January, we have seed round closed or seed be closed.
Now, what this basically what the model is telling us now is that well, in order to get here, in order to get to our seed close, we need about 1.1 $1.2 million.
And $1.2 million is maybe too big of a um of a preede round. Preet rounds don't tend to be that big. Um, so something that we're doing, something in our model is not working uh for this initial round. We're we're not growing fast enough, which means that we need too much money that we probably won't be able to raise for preede because again, this is really not a standard uh preced. So that's the first problem. We're going to have to fix that. Another problem we might have, well, we actually don't have is like I I like to look at the annual sheet just it's like the zoomed out version, right?
So not by not month by month but annually just to understand uh you know scaling right here and we have you know revenue is actually scaling nicely to 30 million. Um so like at least in in the thesis of the company makes sense right uh where we have to spend very very uh you know very aggressively in marketing uh to accomplish that but you know we do hit we do hit profitability so like uh you know like this is not too bad right the biggest problem is here um so what do we do well this is where we kind of start playing with some what if what if possibilities uh well one thing we could do is just work faster. Uh, right. So, maybe we have this MVP launch here. Uh, we could push this. Let's maybe move this over uh a couple months. Um, what that means is that our MVP is simpler. Uh, maybe we start coding this product earlier. Uh, and maybe we we even hire somebody else, right? That that could be an option. Uh, so here in staff, let's just assume that we're going to be able to launch the product sooner because we hire someone.
It's an extra expense, but it's an extra expense that, you know, maybe will allow us to to move faster, right? So, let's say that preede we're going to hire a senior developer, just one. Uh, which again is going to allow us to move faster. Um, let's maybe make this senior marketing team bigger. Um, yeah, let's or let's maybe add a junior marketing uh team, too, right? So, we we're not going to scale so quickly on the senior people. We'll maybe do one senior people every or senior person every every six months and cap that at five and then we'll kind of surround them with a more junior team. We maybe we don't have to pay them so much. Uh and we have yeah one every quarter like we had before all the way to 15. Right.
So like we're changing roles a little bit there. Oh, not 400,000. Sorry.
That's going to make us highly unprofitable.
Okay.
Okay. So let's uh that's that's a new option. Uh let's go to assumptions on the revenue side. Yeah. So let's we have to like maybe be more aggressive. Maybe we're we can get away with spending more on marketing at the get-go, right? Not five, but 15. It's we're just spending we're pushing harder for that growth earlier in the process. U and notice that here uh we're kind of our expenses versus uh sorry this black line which is profitability or net income. Um you can see here it's actually starting to to go up, right? So like that means like we're kind of moving faster towards profitability. Uh I don't think we can we can go beyond 5% conversion rate.
Like that'd be unrealistic. I could set this to 20, but that's just unrealistic.
That doesn't happen, right? So like I think we have to stick with something to something like five. But we can play around with pricing a little bit. Maybe we we decide to go a little bit up market. Uh sell the product at 79. Uh and maybe yeah, that's going to drop our conversion rate a bit. Uh but you know, we can maybe make up for it. Maybe right again. So another test scenario. Maybe our churn will be a little bit lower because we went up market. Okay. So let's look at it again.
Uh uh someone is we have this expense.
What is it? Oh, this there's the staff that that started the wrong date. All right. Right. Yeah. So the junior marketing No, they start when we launch.
Yeah. Okay. Um so let's look at our expenses again. So, we are getting to when are we hitting seat metrics? Well, this is an improvement now. We're hitting seat metrics here in November.
Much sooner, right? Just 6 months after launch, we have seat metrics just because we're more aggressive and because we launch sooner because we have an engineer uh an extra developer and we have a bigger team and and the junior marketing team. So, this is working. Uh we're actually hitting seat seed metrics here. Uh which means we can we can start pitching investors in November uh maybe even October. Um cuz November is Thanksgiving and it's crazy. Um and then and then um cuz it takes six months, right? So 1 2 3 4 5 6 seed metrics. We might be hitting seed close by April.
And the the money that we need to get there is no longer 1.1 million. Now we've we've reduced that to 450. Maybe I'm going to round it up to 500. But that's not a crazy preede round 500, right? So we close 500. We cover the red and we get to seed and we we might still need more money, right? We need to spend expend more aggressively. We will run our money later, but this is when we're closing a seed rent and a seed run could be 2 million. Uh and then we can just go over that process again, right? So that's that is basically the game uh of financial modeling. In case you missed it, here's the spreadsheet that I've been using. You can sign up for Slidebean and uh access it. You know, you'll get a clean uh like a clean version. No, no, none of noise I added.
Uh but yeah, feel free to use it. You know, run some forecasts. The you know, to to me like the like 80% of your time, your focus should be on the on the next few months on on the money on the round that you're raising, right?
So kind of like we did today where we focused all this time in making sure that the money that we raise for preede assuming that's the money you're trying to raise is enough. You know making sure that those assumptions are correct and so on. But you know we it's not done right. We didn't add every expense. We didn't account for everything. But you know a good structure of a model took us what 15 minutes 20 minutes. Um so it's not as hard as as a lot of people think.
Now uh I have some time for questions but before we jump into that just a couple of quick commercial. We have a boot camp, like I said, that's like maybe a an extended version of what we've what we've looked into today. Um, so my team's going to paste the link to the or already did paste the link to the boot camp. No, Josh, uh, just throw throw a link in there on the chats for the boot camp. And also, if your model maybe doesn't fit what the template has, uh, or you have a more complicated business or you don't understand how this works and you want some one-on-one assistance, we actually have a team that can help you with that. So um we you know our fractional CFO subscription includes you know a dedicated time with a team member to build this for you. Uh it includes access to our pitch builder um to our cap table and to our investor finder. Uh and that's just uh $1.99 a month. I also do a kickoff call with everybody that joins uh that subscription. So like it'll be a chance for some time to connect and I I normally jump in every every end of the quarter uh as kind of like a fractional CFO persona to um you know to kind of look into your assumptions, make sure that you're not uh coming up with crazy numbers or anything like that. Okay, so that's all I have. Let's jump into questions. Let's stop this screen share madness and uh yeah, anything I can answer, guys, throw it in the in either chats. Uh, I see Terry, great presentation. Good. Glad you liked it.
And for for everybody that's stuck around. I know this is like deep spreadsheet work. Uh, so thanks for sticking around. I know it's not easy. I hope it wasn't going too fast or whatever, but yeah, the recording is going to live in in our startup club channel forever. Well, not forever until we do another webinar and then we we replace it, but you get the point. Uh, right. Any questions, guys? Throw them in the Q&A or throw them in the chat.
I'm giving a little bit of time to the YouTube people because you I know you guys have like a 20 30 second delay from where I am. But um no takers. No. Are you sure?
Going once. Going twice.
Um okay. May maybe I did a really good job today. That's that's what I'm going to tell myself as as I uh as I close it up. Uh okay. Cool, guys. Thanks a lot for Thanks for tuning in. Hope this is useful. Again, the template is free. Use it, break it. Uh don't break it. It's it's it has enough protection, I think, so that you won't be able to break it.
So, feel free to use it. Um customize it, you know, run your forecasts and don't make the same mistakes that that I did and that so many of the founders I talked to make. Um thanks for tuning in.
Have a good one. Bye, guys.
Up Next

68:49
DocSend CEO on Investor Tracking: Pitch Deck Analytics
@startups
19.8K views•2021-01-13
46:36
Retention Habits of Top DTC Ecommerce Brands Revealed
@SendItPodcast
44K views•2026-03-03

15:23
Decoy Effect: How Pricing Psychology Influences Consumer Spending
@bobinvestsUS
90K views•2026-01-05

17:30
The Planned Obsolescence of Light Bulbs and Tech
@veritasium
25.3M views•2021-03-26
Related Study Plans & Knowledge Roadmaps
Structured learning paths in Business
business
Pop-Up Retail: Strategy, Design & Execution
01Introduction to Pop-Up Retail & Strategic Goal Setting
02Budgeting, Site Selection, and Legal Essentials
03Experiential Retail Design & Visual Merchandising
+ 2 more learning modules
15h5 modules
Explore Roadmap
business
Reg CF: Startup Funding, Marketing & Launch
01Introduction to Equity Crowdfunding & Reg CF
02Platform Selection & Legal Preparation
03Crafting High-Converting Campaign Assets
+ 2 more learning modules
14h5 modules
Explore Roadmap
business
Productized Services: Scaling Solo Freelance
01Foundations of Productized Services
02Packaging and Scope Definition
03Pricing and Subscription Models
+ 2 more learning modules
15h5 modules
Explore Roadmap
business
Gov Procurement: Find, Bid & Win Contracts
01Introduction to Government Procurement & Business Setup
02Small Business Certifications & Set-Asides
03Finding and Analyzing Contract Opportunities
+ 2 more learning modules
14h5 modules
Explore Roadmap