






![สถิติและการแจกแจงความน่าจะเป็น ม.6 - ปูพื้นฐาน [Part 2/2] | คณิตศาสตร์ By พี่ปั้น SmartMathPro](https://i.ytimg.com/vi/bGUvZPyeTRM/maxresdefault.jpg)









![Costing MCQ Marathon 🚀| 25 Must-Solve Case Scenarios for CA Inter 🔥| CA Tabish [AIR-10]](https://i.ytimg.com/vi_webp/7zVyPsysvvA/maxresdefault.webp)











The Q R (Min Max) inventory model calculates safety stock, reorder point, and average inventory using the formulas: Safety Stock = Z × Sigma_L × √L, Reorder Point = μ × L + Safety Stock, and Average Inventory = Q/2 + Safety Stock, where Z is the Z-score for the desired service level, Sigma_L is the weekly standard deviation of demand, L is lead time, μ is average demand, and Q is order quantity.
How to Calculate Reorder Point & Safety Stock: QR Inventory Model
Added:Basic concepts of inventory management, including holding costs, ordering costs, and stockout costs.
The Economic Order Quantity (EOQ) model, which determines the optimal order quantity 'Q'.
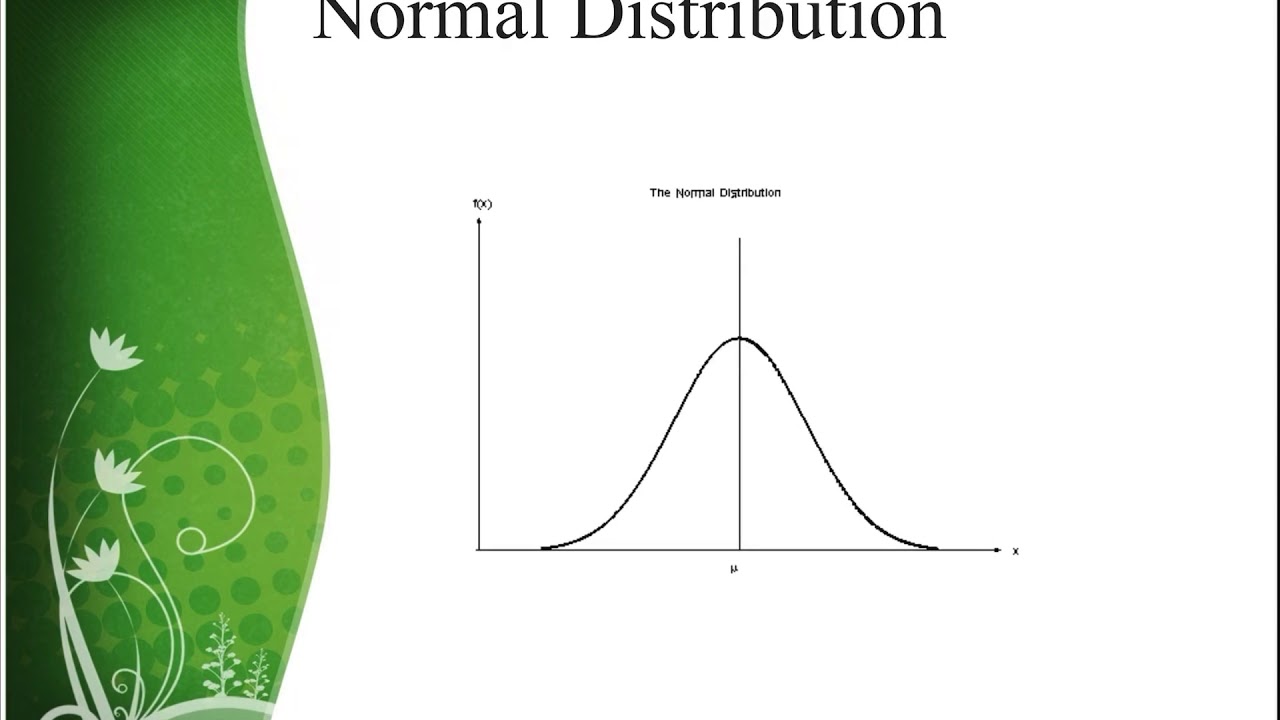
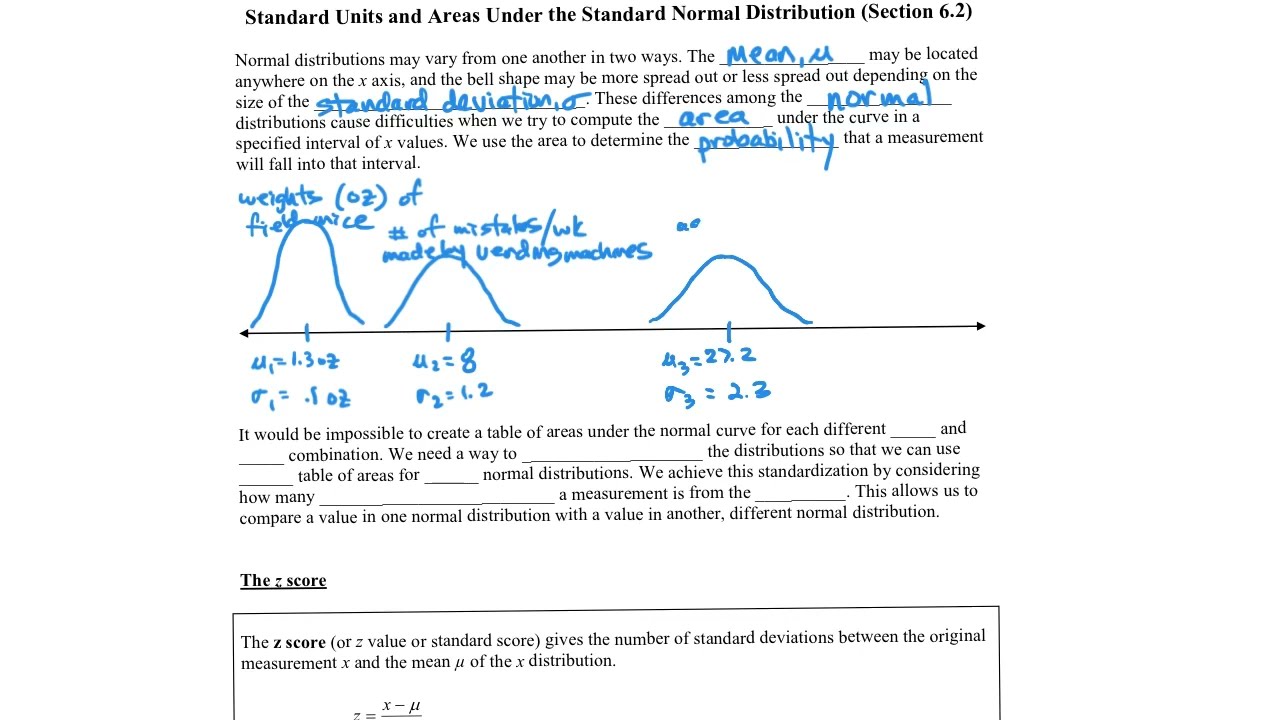
Fundamental probability and statistics, specifically mean, standard deviation, and the standard normal distribution (Z-scores).
The concept of lead time and how it affects supply chain operations.
Periodic Review Inventory Models (such as the Periodic Reorder System or P-system) as opposed to Continuous Review (Q-system).
Determining optimal service levels by balancing inventory carrying costs against the cost of stockouts.
Advanced inventory modeling with stochastic (variable) lead times in addition to variable demand.
Implementation of safety stock and reorder point calculations within Enterprise Resource Planning (ERP) and Warehouse Management Systems (WMS).
Multi-echelon inventory optimization, which coordinates safety stock across multiple distribution centers and retail nodes.
14.1K views45likes11:25Original Release: 2012-02-12
we will now go through some worked examples of a QR model and a base stock model so the problem we're going to go through first is a materials manager for a manufacturer of diesel oil filters has a demand for metal tubes of 250 units per week the lead time for the tubes is 2 weeks and the order amount is 228 units per replenishment and the root mean square error rmsse of the forecast is 1,316 units per year so we need to find the Safety stock the reorder point and the average inventory assuming a QR model also assume the demand is normally distributed giving the uh manufacturer wants a 95% service level for a replenishment cycle and uh this is our type one service level and also assume that inventory is continuously reviewed okay so let's write down some of the key attributes that uh that we know so we're told in the problem that our me our average weekly amount is 250 units per week so that's given in units per week we also know that our lead time going to call that L is 2 weeks we're also given our um Q value which is our order amount so we know Q is equal to 228 and that's given in units per order we know our root mean square error our root mean square error is equal to 1,316 and that's given in units per year and just take note here that this is given as a yearly unit whereas everything else we have is in weekly so we're going to have to convert that in a sec the last of data that we have is that Alpha given from our 95% service level for our Cycle Service level is equal to 95% or 0.95 Okay so let's come over here and start off by calculating um the uh the weekly stand deviation so one our first step is to find the weekly standard deviation okay so what do we know we know that um our our root mean squ where error was 1316 so let's call our weekly standard deviation Sigma L because we want it in the same term as lead time so to convert our root mean square error which is a standard deviation in itself into a weekly format we divide by the square root of 52 so this gives us an approximate week stand deviation and this comes out to 182.5 now again the reason we do this is to ensure that our standard deviation is in the terms of the units of lead time okay so next we can go on now to find as our second step the Safety stock so find our Safety stock okay to find Safety stock we write down some terms that we'll need to use the first important term is lead time lead time we know is given as 2 weeks we know that we just calculated our Sigma L which is8 2.5 whoops.5 um we know an alpha is.95 we then do a very quick calculation using either a lookup table or Microsoft Excel if we were to use Microsoft Excel to find the Z from our Alpha value we type into Excel the function Norm s i imv which is the inverse of standard normal we type in 0.95 in Brackets and this gives our answer 1.64 okay now we have the key information now to find Safety stock so if we recall from our Theory Safety stock we'll use SS equals z times our standard deviation times the square root of L we just worked out Z 1.64 our Sigma L we worked out is 182.5 and our lead time is two so it's the square Ro TK of two so calculating this out we get 423 so this is our safety stock okay next we're asked to find what our reorder point is for um the uh the QR model so that'll be our third step so here we are finding our reorder point now to find every reorder point we need to use mu is 250 as we saw at the start again we're going to use our lead time of two weeks our Z which we calculated up above of 1.64 and our equation for our reorder point if we recall is R equals mu time L plus our safety stock which we worked out before Z Sigma L Square < TK of L so we have 250 for our mu our lead time is 2 weeks and our safety stock we worked out up here which is 423 summing this together we get 900 23 units so there is our reorder Point okay and lastly we need to work out what our average imetry is so going to find our average inventory okay so some key things we'll need to find our average inventory we need to use our Q which is 228 our safety stock which we've calculated is 423 so let's go ahead and calculate our average inventory for a QR model so we know that our average inventory and I'm using the expression here the expected value of inventory which is the same as our average inventory is equal to Q on 2 plus Safety stock which was given if you recall Z Sigma L Square Ro T of L Okay so Q we just said is 228 / 2 plus our safety stock which is 4 23 okay again multiplying through then adding it up we get 500 and 37 units okay so if we were to draw a little schematic of the uh solution here excuse the bad drawing so we have our Top Line which is going to be our reorder point so R here is N9 2 three our safety stock is 423 um and uh you can see that our difference between the Safety stock and reorder point is merely our mu L which is 250 * 2 to give us 500 can see that difference there and and we worked out what our average inventry is which is halfway between um our order amount q12 plus our safety stock so that would be in that region um our average imetry would be in this region here at uh 537
Up Next

63:17
Advanced Forecasting with Inventory Planner for eCommerce
@InventoryPlanner
11.1K views•2020-10-01

23:08
Building Iconic Brands: Marketing Strategies from Rohan Oza
@CNBC
16.7K views•2017-09-28

15:23
Decoy Effect: How Pricing Psychology Influences Consumer Spending
@bobinvestsUS
90K views•2026-01-05

17:30
The Planned Obsolescence of Light Bulbs and Tech
@veritasium
25.3M views•2021-03-26
Related Study Plans & Knowledge Roadmaps
Structured learning paths in Business
business
Gov Procurement: Find, Bid & Win Contracts
01Introduction to Government Procurement & Business Setup
02Small Business Certifications & Set-Asides
03Finding and Analyzing Contract Opportunities
+ 2 more learning modules
14h5 modules
Explore Roadmap
business
Greening Supply Chains: ESG Audits & Net Zero
01Introduction to Supply Chains and ESG Standards
02Measuring Carbon Footprint: Scope 1, 2, and 3
03Auditing Legacy Systems & Lifecycle Assessment (LCA)
+ 2 more learning modules
14h5 modules
Explore Roadmap
business
13-Week Cash Flow: Liquidity & Forecasting
01Excel & Financial Statement Foundations
02Working Capital & Liquidity Dynamics
03The Direct Method of Cash Forecasting
+ 2 more learning modules
16h5 modules
Explore Roadmap
business
Migrating to Usage Pricing: Strategy & Value
01Foundations of Business Pricing Models
02Understanding Enterprise Contracts & Value Metrics
03Designing a Usage-Based Pricing Structure
+ 2 more learning modules
12h5 modules
Explore Roadmap