The CTAB method for plant DNA extraction involves: (1) grinding 200mg plant tissue with liquid nitrogen and adding 700μL lysis buffer, (2) incubating at 65°C for 20 minutes followed by 10,000 rpm centrifugation, (3) adding chloroform-isoamyl alcohol to separate phases, (4) precipitating DNA with ice-cold ethanol and sodium chloride, (5) washing the pellet with 70% ethanol, (6) air-drying, and (7) resuspending in TE buffer for storage at 4°C.
Plant DNA Extraction Using CTAB Method | Lab Protocol
Added:Deep Dive
Understanding of plant cell anatomy, particularly the composition and rigidity of the plant cell wall compared to animal cells.

Plant cell wall structure and function
170.1K
The plant cell wall is a rigid structure providing structural rigidity and support, unique to plant cells among eukaryotes. Composed primarily of polysaccharides like cellulose, hemicellulose, and pectin, it differs fundamentally from animal cells which lack this external layer. Plant cells organize uniquely through shared cell walls, creating interconnected hexagonal arrangements where adjacent cells interlock, unlike animal cells that rely on protein-based adhesion molecules like actin and intermediate filaments.
Click to watch →

RRB ALP, Technician Science Class | RRB JE Science | Cell Biology Class For Railway Exams
72.2K
Plant cell walls are primarily composed of cellulose, hemicellulose, and pectin. Cellulose is the main component, while hemicellulose and pectin also contribute to the cell wall structure. Cellulose is a polysaccharide that provides rigidity and strength to plant cells. Hemicellulose is a component of cellulose, and pectin is another component found in plant cell walls.
Click to watch →

المحاضرة (6) | الفصل الأول 2026.
336.5K
Plant cells have a cell wall consisting of a thin plasma membrane plus a thick cellulose cell wall that may contain lignin, providing structural support. Animal cells lack a cell wall and have only a thin plasma membrane. Plant cells contain plastids (chloroplasts for photosynthesis, colorless and colored plastids), while animal cells lack plastids.
Click to watch →
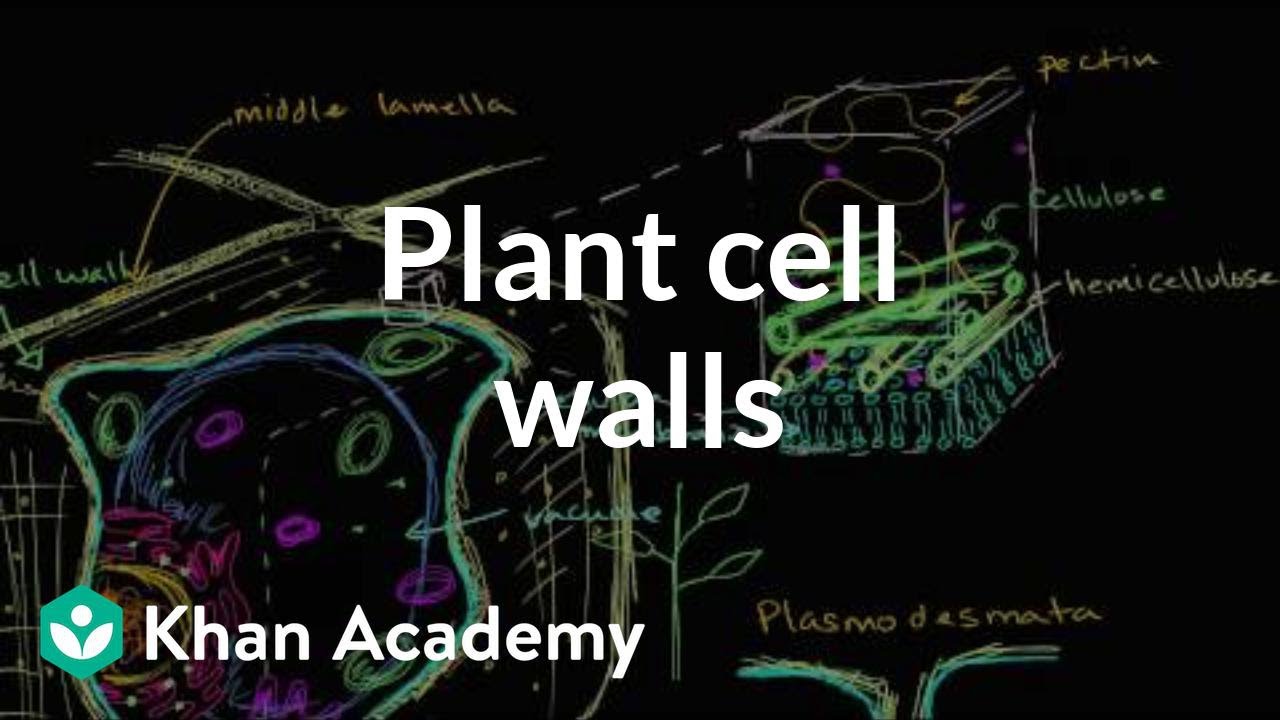
Plant cell walls | Structure of a cell | Biology | Khan Academy
287.6K
Plant cells have a rigid cell wall made of polysaccharide fibers (cellulose, hemicellulose, and pectin) that forms a mesh-like structure rather than an impenetrable wall, providing shape and rigidity to plant cells; this mesh allows small molecules to pass through while maintaining structural integrity, and mature plants develop secondary cell walls for even greater rigidity, with adjacent cells connected by plasmodesmata for direct communication.
Click to watch →

Phoenix 2.0: Biology Most Important Video for NEET 2025 | Unacademy NEET Toppers | Udaan
430.1K
Plant cell walls are primarily composed of cellulose, a polysaccharide made of glucose monomers. Cellulose provides structural support and rigidity to plant cells. The cell wall also contains hemicellulose and pectin, which help bind cells together. Unlike animal cells, plant cells have cell walls that protect against mechanical stress and maintain cell shape. The cell wall also regulates cell expansion during growth. Plant cells contain chloroplasts, which contain chlorophyll and conduct photosynthesis. Chloroplasts have a double membrane and internal structures called thylakoids, which are stacked into grana. The stroma is the fluid-filled space surrounding the thylakoids where the Calvin cycle occurs. This structure enables plants to convert light energy into chemical energy.
Click to watch →
Deep Dive
Fundamental knowledge of DNA structure, stability, and its localization within plant cells (nucleus, chloroplasts, and mitochondria).

🔥LUCENT SCIENCE 2026 | BIHAR LUCENT SCIENCE CLASSES 2026 | BIHAR LUCENT CLASS | THE LUCENT SHOW
2K
DNA is found in three locations within a cell: mitochondria, chloroplasts, and the nucleus. In mitochondria and chloroplasts, DNA is circular in structure, while in the nucleus, DNA exists as a double helix (dual helix) structure.
Click to watch →

الـ DNA في أوليات و حقيقيات النواة + تكثيف الـ DNA بأبسط طريقة
735
DNA location varies by cell type: humans have DNA in nucleus and mitochondria; plants have DNA in nucleus, mitochondria, and chloroplasts; prokaryotes have DNA in cytoplasm. Mitochondria and chloroplasts contain their own DNA similar to bacterial DNA, supporting the endosymbiotic theory that these organelles originated from free-living bacteria.
Click to watch →

Hssc group d & cet mains science | science for haryana group d & cet mains 2026 #hssc #science
1.2K
DNA (deoxyribonucleic acid) is found in three locations within plant cells: the chloroplast, mitochondria, and nucleus. All three organelles contain genetic material.
Click to watch →
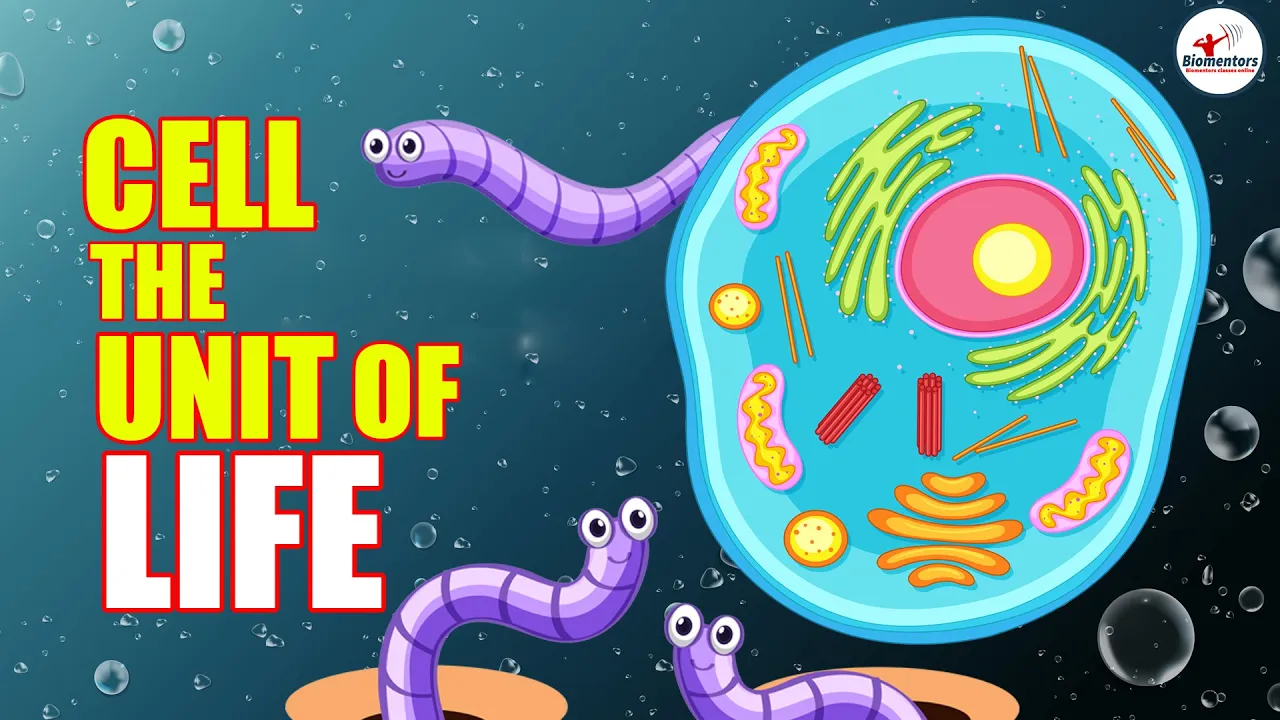
Cell the Unit of Life l Lecture 21 l Biology l NEET
67K
DNA in a cell is found in only three locations: the nucleus, mitochondria, and chloroplasts. In plant cells, DNA is present in the nucleus, mitochondria, and chloroplasts. In animal cells, DNA is present only in the nucleus and mitochondria. This distribution is fundamental to understanding cellular organization and function.
Click to watch →

Solved: May/June 2021 Paper 2, Variant 1
17.1K
DNA in plant cells can be found in three locations: the nucleus (where DNA is concentrated), chloroplasts, and mitochondria. This relates to the endosymbiont theory, which explains that chloroplasts and mitochondria originated from free-living bacteria that were engulfed by ancestral cells.
Click to watch →
Deep Dive
Basic chemistry concepts of solubility, polarity, and pH, particularly how biological molecules partition into aqueous versus organic phases.

TRIzol extractions of RNA, DNA, and protein
11.6K
Solubility depends on molecular polarity and solvent compatibility. Water's high polarity creates hydrogen-bonded networks that exclude nonpolar (hydrophobic) molecules, causing them to aggregate. Biomolecules partition between phases based on their chemical properties: hydrophilic molecules stay in aqueous phase while hydrophobic molecules enter organic phase. The interphase contains molecules unable to choose definitively. Chaotropic agents disrupt water networks, allowing salt ions to interact directly with charged biomolecule backbones. This fundamental understanding enables selective precipitation and recovery of specific biomolecules through controlled solvent manipulation.
Click to watch →
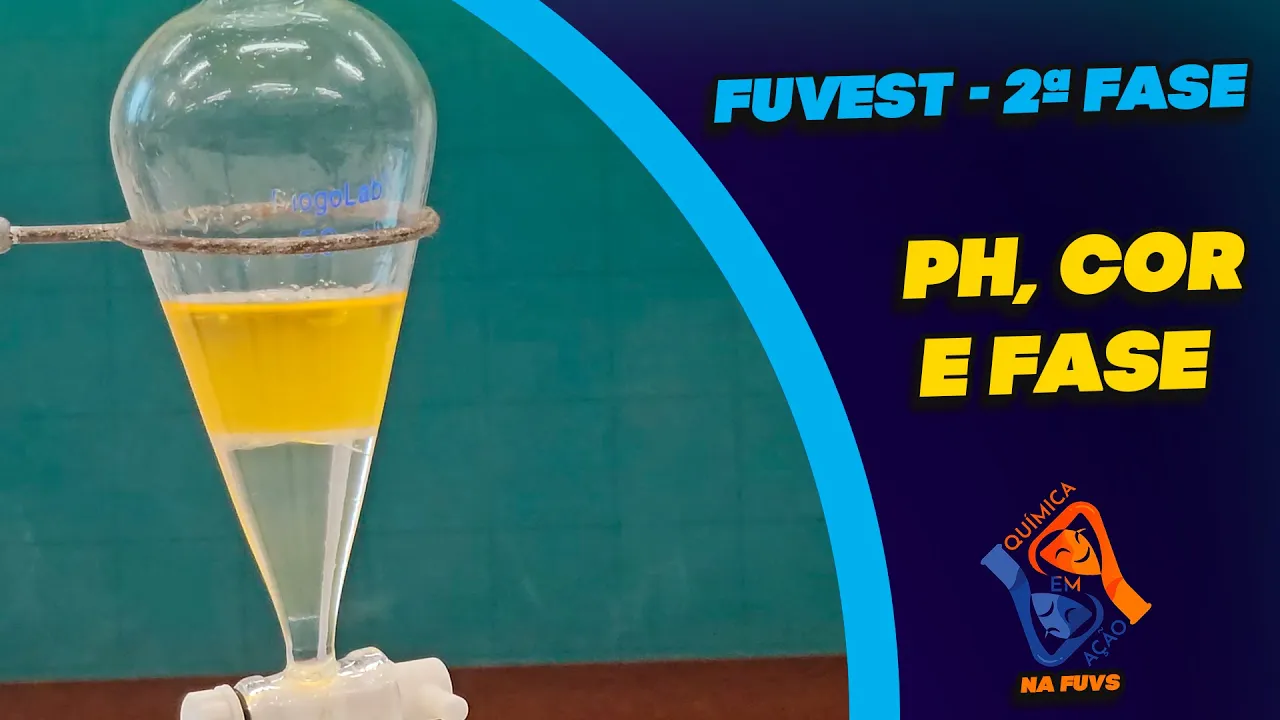
pH influencia a cor e a fase de um composto? - Q&A na Fuvs
206
The pH of a solution can dramatically alter a compound's polarity, thereby changing its solubility and phase distribution between aqueous and organic solvents; adding acid protonates the compound, reducing its polarity and causing it to transfer from the aqueous phase to the organic phase, while adding base deprotonates it, restoring its polarity and returning it to the aqueous phase.
Click to watch →
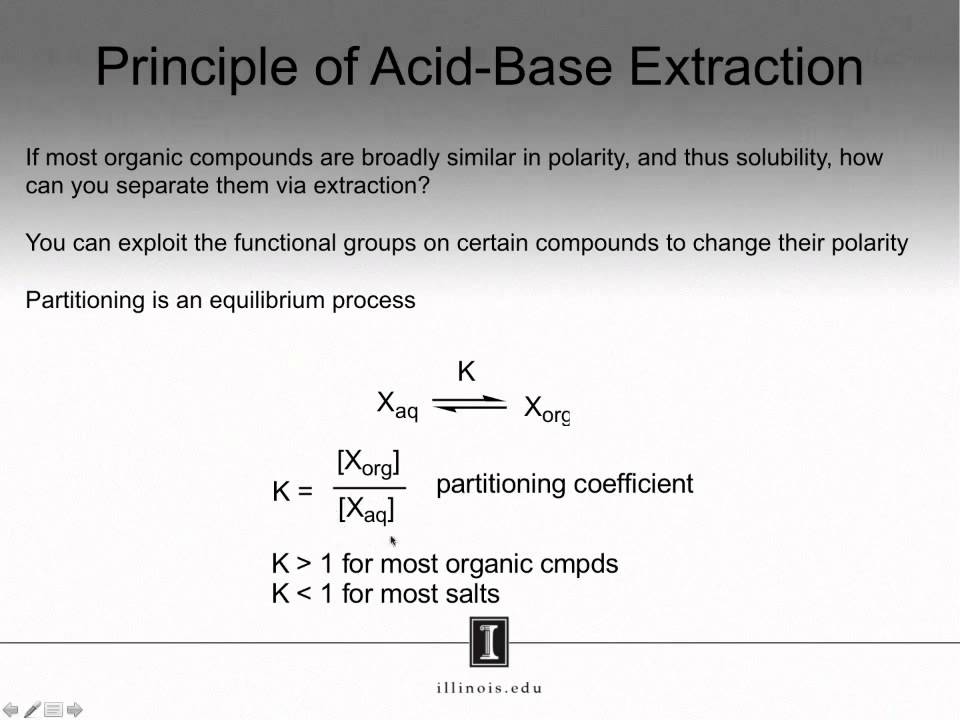
Acid Base Extraction - Background
11.6K
The 'like dissolves like' principle governs solubility: polar compounds dissolve in polar solvents, and non-polar compounds dissolve in non-polar solvents. Water's polarity creates partial charges (oxygen δ⁻, hydrogen δ⁺) that stabilize charged ions through favorable charge interactions. Organic solvents range from non-polar to moderately polar and dissolve neutral to moderately polar compounds. The partition coefficient K quantifies this relationship as the ratio of compound concentration in organic to aqueous layers. K > 1 indicates preference for organic layer; K < 1 indicates preference for aqueous layer. Most organic compounds have K > 1, while salts have K < 1 due to high polarity.
Click to watch →

Química orgânica: tudo que você tem que saber para o vestibular
8.9K
This segment teaches how to determine solubility and polarity in organic molecules. Students learn to count polar groups (containing electronegative atoms like oxygen or nitrogen) to identify which molecules interact better with water. Molecules with more polar groups are more hydrophilic and more soluble in water. Molecules with more hydrocarbon chains are more hydrophobic and more soluble in organic solvents. The instructor also explains that symmetrical organic molecules with low polarity tend to bioaccumulate in lipids and interact better with organic solvents, which explains why many organochlorine compounds persist in the environment.
Click to watch →

CHEM117 04 Liquid Liquid Extraction Fundamentals
166.9K
The solubility and partitioning behavior of weak acids and bases can be controlled by adjusting aqueous pH. Neutral weak acids have limited water solubility, but become highly soluble as charged conjugate bases in basic solutions. The Henderson-Hasselbalch equation governs this relationship: for every pH unit above pKa, deprotonation increases tenfold. This allows chemists to direct compounds into desired phases by selecting appropriate pH values, effectively modifying the partitioning coefficient for the same compound.
Click to watch →
Deep Dive
Familiarity with standard laboratory safety protocols and equipment, including microcentrifuges, micropipettes, and fume hoods.

023-BLS-ဓါတ်ခွဲခန်းသုံးပစ္စည်းများကို ကိုင်တွယ်အသုံးပြုခြင်း ၁ (Pipette, Centrifuge, Waterbath)
380
This segment covers essential laboratory techniques for pipetting and centrifuge safety. Pipetting best practices include: keeping tips pointed down to prevent liquid from entering the pipette body, releasing the plunger slowly to avoid air bubbles, and pushing to the first stop to dispense exact volumes (e.g., 250 microliters). Centrifuge safety requires using polypropylene tubes with blue screw caps (never white caps or glass), checking caps for cracks, adding up to 10 milliliters per tube, and balancing samples by weight by loading tubes of equal weight directly opposite each other. Balance tubes can be created using water if samples cannot be split evenly.
Click to watch →
GRADE 9 CHEMISTRY UNIT 2 |Part 3 BY AFAAN OROMOO
9.2K
Essential laboratory equipment includes: microscopy (compound for visible light magnification, electron for higher resolution), centrifuge (separates liquid mixtures by density), pipettes (micro for small volumes, graduated for larger volumes), Bunsen burner (heating and chemical composition), test tube (holding/mixing small quantities), funnel (transferring liquids to small openings), test tube rack (holding multiple tubes), and ring stand (supporting equipment). Critical safety rules: wear PPE (gloves, goggles), know safety equipment locations, never eat/drink in lab, report incidents immediately, never smoke, never work alone, keep work area neat, and always pour acids into water (never water into acids).
Click to watch →

CHEMISTRY- ল্যাবরেটরির নিরাপদ ব্যবহার | Medico Online Class 2022 | MEDICO |@INSIDEREDUCATION
390
Analytical methods are classified by sample size: Macro (largest), Semi-micro (medium), Micro (smallest). Micro is 10 times smaller than semi-micro, macro is 100 times larger than micro. Semi-micro uses test tubes, centrifuge tubes, capillary droppers. Essential safety equipment includes goggles, gloves, safety showers, and fume hoods. Laboratory glassware includes measuring cylinders, measuring flasks, burettes, pipettes, and conical flasks. Bunsen burners produce luminous and non-luminous flames at different temperatures.
Click to watch →

Fume Hood Safety
700
Fume hoods are semi-enclosed laboratory workspaces that maintain air circulation to prevent hazardous vapors from escaping, featuring front sashes and rear dampers that require all objects to be placed at least 15 cm from the front and back edges to ensure proper airflow; researchers must avoid rapid movements, open windows, or fans that create turbulence, and must conduct annual validation tests using smoke tests or ribbon tape to verify face velocity, while never using fume hoods for chemical storage or waste disposal and following specific protocols for overnight reactions, radioisotopes, and perchloric acids.
Click to watch →
Aula 4 - Práticas de laboratório - Parte 1
114
Laboratory good practices encompass all attitudes, care, and behaviors required in any laboratory setting, regardless of discipline. These practices are essential for safety (preventing accidents with chemicals and acids) and respect (sharing spaces with multiple people). Key protocols include: proper attire (lab coat, long pants, closed-toe shoes); PPE (gloves, masks, safety glasses); never taste, smell, or put reagents in eyes/mouth; no eating/drinking to prevent sample contamination; long hair must be tied back and covered; hands must be washed before leaving; smoking is prohibited due to flammable substances; all reagents must be properly labeled; extreme caution with sharp objects. Key laboratory equipment includes: laboratory bench (shared workspace with electrical outlets); fume hood (protective enclosure for hazardous materials); Eppendorf tubes (small plastic tubes for storing samples); microscope slides (thin glass plates for mounting samples); cover slips (small glass pieces to secure samples). The microscope has two main parts: mechanical (base, column, stage, focus knobs, stage controls, revolver) and optical (condenser, diaphragm, objective lenses 4x/10x/40x/100x, ocular lenses, diopter adjustment).
Click to watch →
Prerequisite Knowledge
- Concept 01Understanding of plant cell anatomy, particularly the composition and rigidity of the plant cell wall compared to animal cells.
- Concept 02Fundamental knowledge of DNA structure, stability, and its localization within plant cells (nucleus, chloroplasts, and mitochondria).
- Concept 03Basic chemistry concepts of solubility, polarity, and pH, particularly how biological molecules partition into aqueous versus organic phases.
- Concept 04Familiarity with standard laboratory safety protocols and equipment, including microcentrifuges, micropipettes, and fume hoods.
Subsequent Learning
- Step 01Methods for assessing DNA quality and concentration, such as agarose gel electrophoresis and UV-vis spectrophotometry (e.g., NanoDrop, A260/280 ratio).
- Step 02Principles and protocols of Polymerase Chain Reaction (PCR) and quantitative PCR (qPCR) using the extracted plant genomic DNA.
- Step 03Applications in plant genomics, such as Next-Generation Sequencing (NGS), marker-assisted breeding, and phylogenetic analysis.
- Step 04Troubleshooting strategies for high-polyphenol or high-polysaccharide plant species that interfere with standard CTAB extraction.
Sample Prep
Purification
DNA Recovery
Wash & Store
Sample Prep
0:00Playing Section
- 1
Grind plant tissue with liquid nitrogen.
- 2
Measure 200 mg and transfer to tube.
- 3
Add lysis buffer and incubate at 65°C.
Commercial Spin-Column Kits and Direct PCR Methods
While the traditional CTAB (Cetyltrimethylammonium bromide) method is highly effective for yielding large quantities of DNA from plants with high polysaccharide and polyphenol content, it is increasingly challenged by modern alternatives. Critics of the CTAB protocol highlight its use of hazardous chemicals—such as chloroform and beta-mercaptoethanol—which pose safety and environmental risks. Furthermore, CTAB is labor-intensive, time-consuming, and difficult to automate for high-throughput workflows. Modern alternatives, such as commercial silica-based spin-column kits and magnetic bead systems, offer faster, safer, and highly standardized extractions with fewer toxic reagents. For simple downstream applications like PCR, 'Direct PCR' methods bypass extraction entirely by amplifying DNA directly from tiny leaf punches. Consequently, while CTAB remains a valuable academic tool for challenging species, modern labs often favor kit-based or direct amplification methods to maximize efficiency, safety, and reproducibility.
Deep Dive
Methods for assessing DNA quality and concentration, such as agarose gel electrophoresis and UV-vis spectrophotometry (e.g., NanoDrop, A260/280 ratio).
DNA Isolation
85.8K
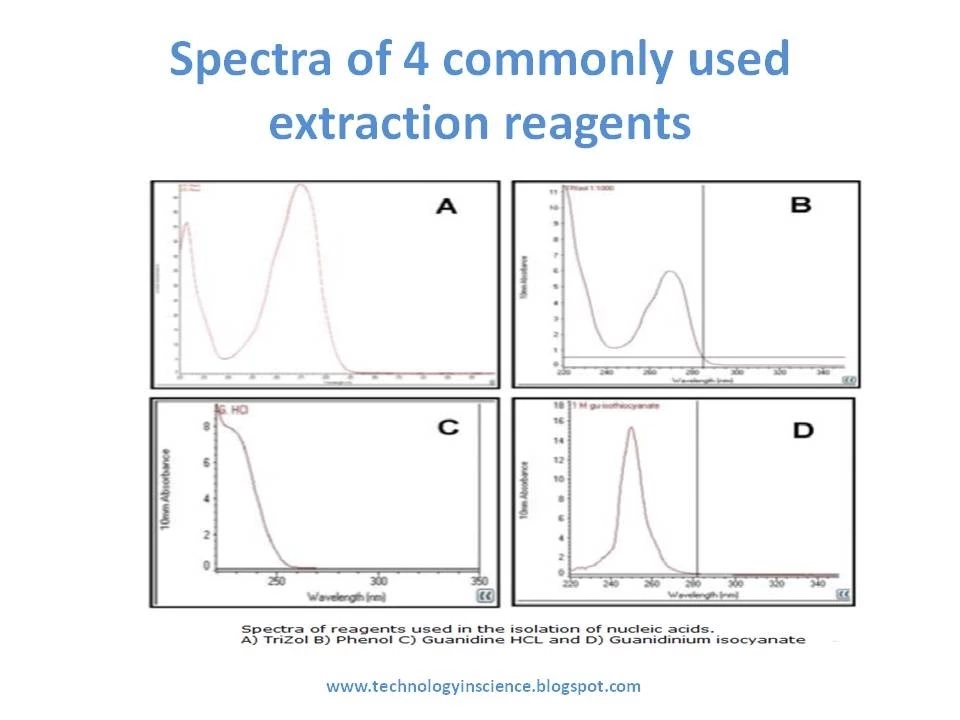
DNA quality assessment employs two primary methods. Agarose gel electrophoresis separates DNA fragments by size, with higher molecular weight DNA moving slower than lighter fragments; ethidium bromide staining visualizes DNA under UV light. UV absorbance spectrophotometry measures concentration at 260 nm, where an absorbance of 1 equals 50 μg/mL of double-stranded DNA. Purity is determined by the A260/A280 ratio: a ratio of 1.8 indicates pure DNA, while values below 1.8 suggest contamination with protein or phenol. These assessments ensure DNA meets quality standards before downstream applications.
Click to watch →
DNA Isolation Csir-NET, dbt-jrf, gate online classes
1.3K
DNA quality is assessed through two methods: integrity check and purity assessment. Integrity is checked using agarose gel electrophoresis: intact genomic DNA appears as a single thick band, while fragmented DNA appears as multiple thin bands or a smear. Purity is assessed using a spectrophotometer by measuring absorbance at 260nm and 280nm wavelengths. The A260/A280 ratio indicates purity: 1.8 indicates pure DNA, ratios above 1.8 suggest RNA contamination, and ratios below 1.5 suggest protein contamination. DNA concentration is calculated using: Concentration (μg/mL) = Absorbance at 260nm × 50, assuming 1.0 absorbance corresponds to 50 μg/mL. For accurate quantification, a standard curve is created using known DNA concentrations (e.g., 10, 20, 40 μg/mL), and the sample concentration is determined by comparing its absorbance to the standard curve.
Click to watch →
Nucleic acid Quantification - DNA / RNA Quantification Methods
21.9K
Nucleic acid quantification determines DNA/RNA concentration and purity using spectrophotometric analysis (measuring UV absorbance at 260nm) and agarose gel electrophoresis; the A260/A280 ratio indicates purity (1.8 for pure DNA, 2.0 for pure RNA), while A260/A230 detects organic contamination, and gel electrophoresis separates nucleic acids by size for purity assessment and purification.
Click to watch →
DNA extraction from Blood
550.8K
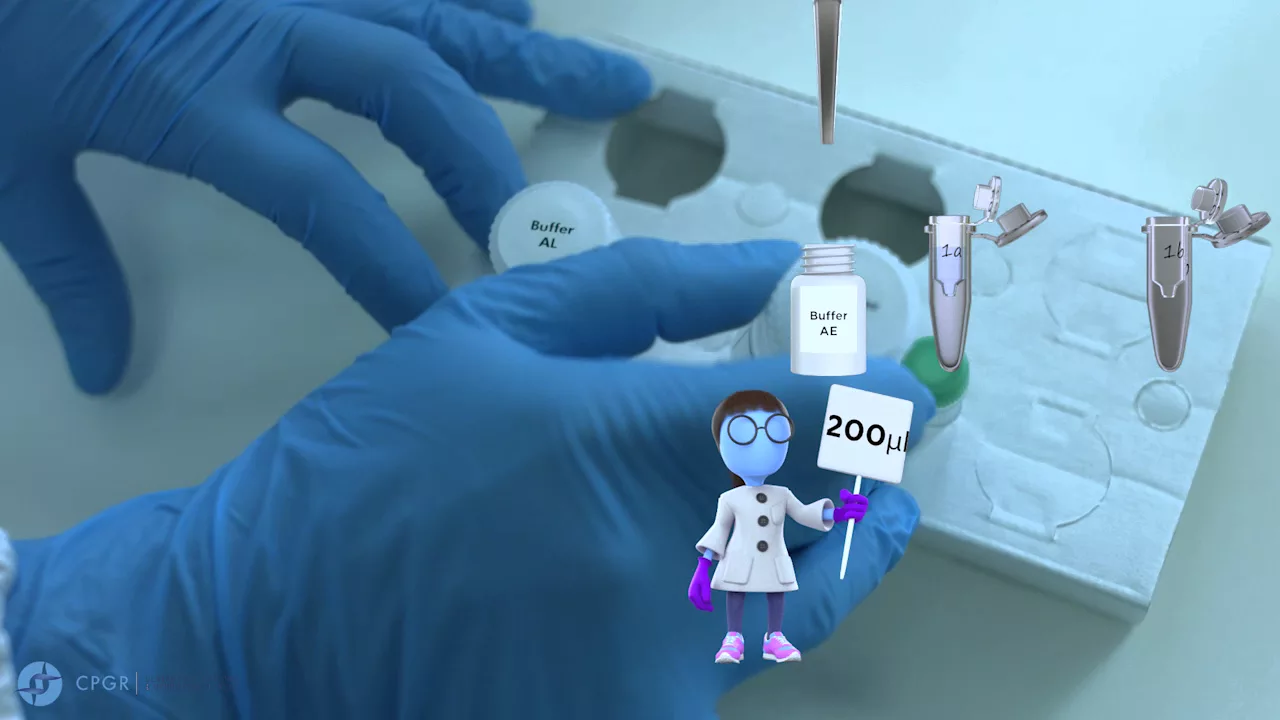
This final section covers comprehensive DNA quality assessment and stabilization protocols. Quality control involves removing 5 microliters for testing, using nanodrop spectrophotometry with AE buffer blanks to measure concentration and A260/A280 ratios (optimal 1.5-3 range). Gel electrophoresis assesses DNA integrity using 1% agarose gels run at 100V for 20-30 minutes, visualized under UV light to distinguish high molecular weight from degraded DNA. For transportation, DNA is dried on DNA stable plates in PCR hoods, sealed airtight, and packaged with documentation for shipment.
Click to watch →

Определение количества и качества ДНК DNA quality and quantity control
2.6K
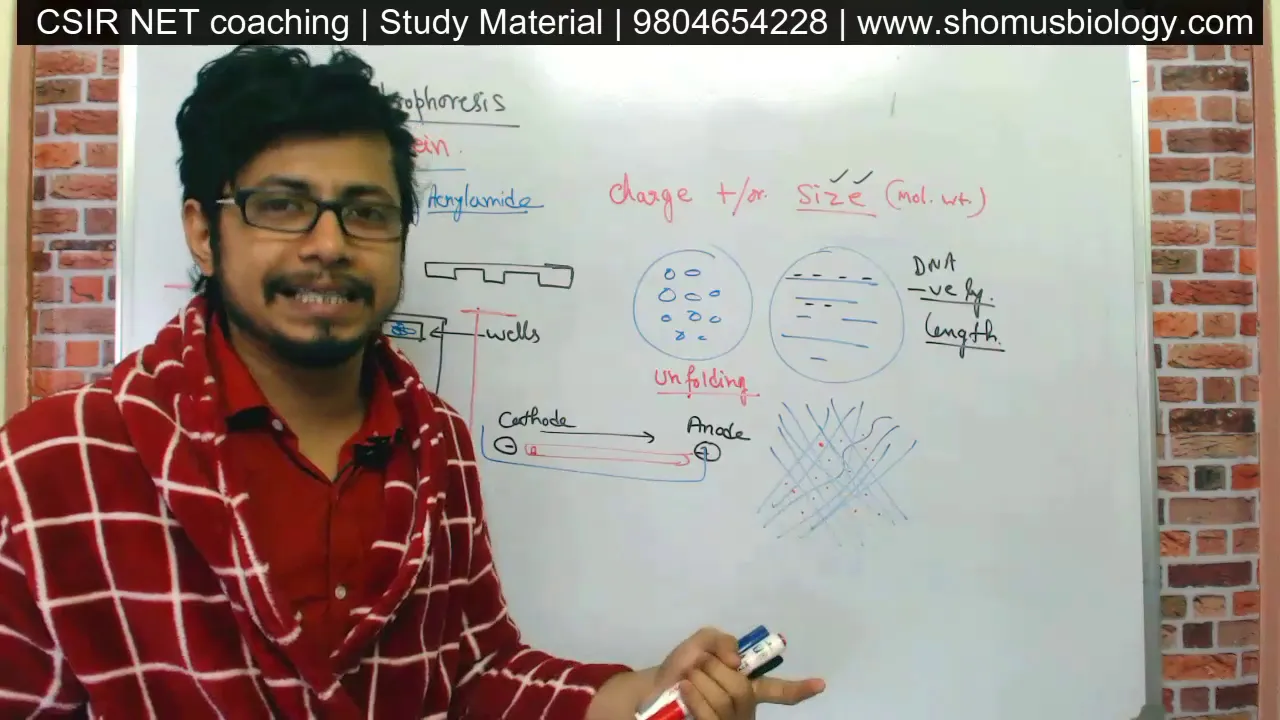
This comprehensive section covers the essential methods for evaluating DNA before genomic applications. The spectrophotometer measures DNA concentration by detecting UV light absorption at 260 nm, where higher absorption indicates greater concentration. Purity is assessed through absorbance ratios: A260/A280 (approximately 1.8 indicates pure DNA without protein contamination) and A260/A230 (indicates organic compound contamination). Agarose gel electrophoresis separates DNA fragments by size using an electric field, with larger molecules moving slower through the gel matrix. DNA's negative charge causes migration from cathode to anode. Buffer solutions maintain electrical conductivity for proper separation. The gel documentation system visualizes separated DNA using UV light and fluorescent dyes, allowing researchers to determine fragment sizes by comparison with DNA ladder standards containing known fragment lengths.
Click to watch →
Deep Dive
Principles and protocols of Polymerase Chain Reaction (PCR) and quantitative PCR (qPCR) using the extracted plant genomic DNA.
3) Polymerase Chain Reaction (PCR) - Quantitative PCR (qPCR)
230.6K
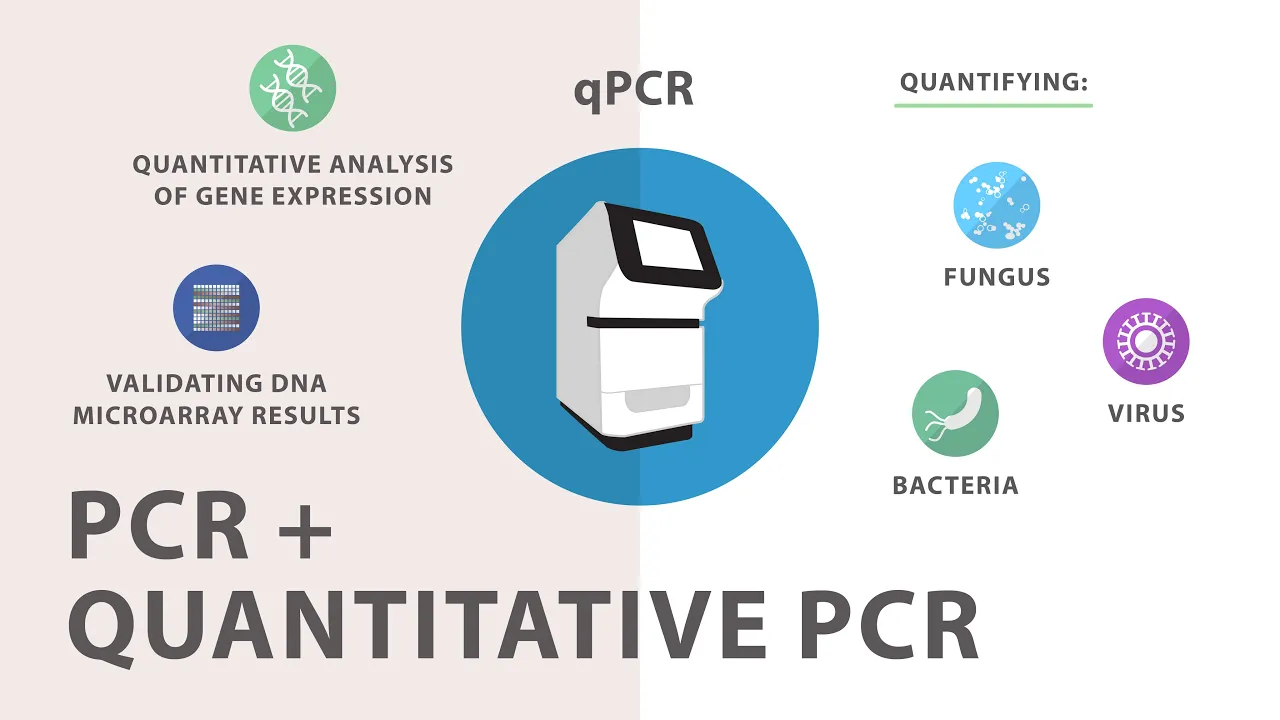
Quantitative PCR (qPCR) is a technique that simultaneously amplifies and detects changes in amplicon concentration by collecting fluorescence signals during amplification; it uses two main methods: SYBR Green-based detection, which binds to all double-stranded DNA and requires melting curve analysis for specificity, and TaqMan probe-based detection, which uses hydrolysis probes with fluorescent reporter and quencher dyes that only bind to target sequences, enabling multiplex reactions and better specificity.
Click to watch →

What is PCR and qPCR? | PCR Animation
252.9K
PCR (Polymerase Chain Reaction) is a revolutionary molecular biology technique invented by Kary Mullis in 1983 that enables unlimited DNA amplification through repeated cycles of heating (95°C to separate DNA strands), cooling (60°C for primer binding), and DNA synthesis by Taq polymerase; qPCR (quantitative PCR) extends this by adding fluorescent probes that emit light when cleaved during amplification, allowing real-time monitoring and quantification of DNA through the cycle threshold (Ct) value, which correlates with initial DNA quantity (a 2-cycle difference equals 4 times more DNA, 20 cycles equals 1 million times more), enabling applications from disease diagnosis to multiplex detection of multiple pathogens in single tests.
Click to watch →
Isolation of Genomic DNA from Plant Tissue
46K
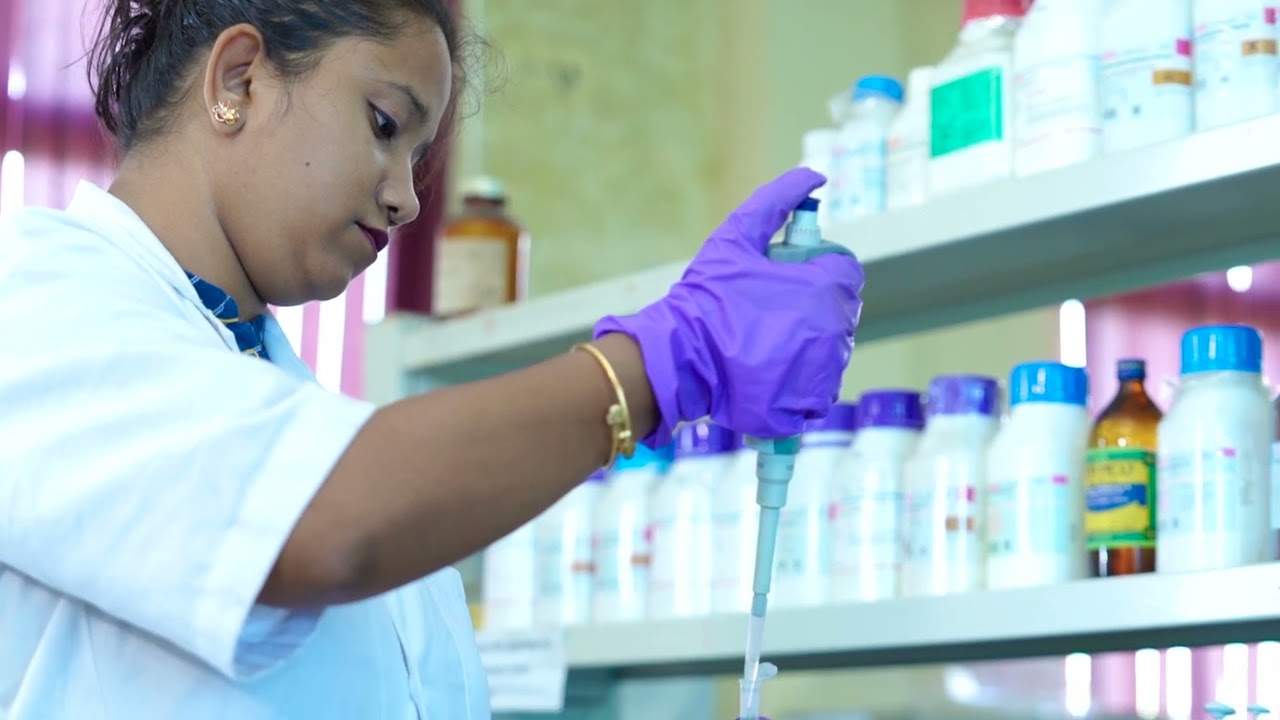
Genomic DNA isolation from plant tissues involves three main steps: (1) cell lysis using liquid nitrogen and CTAB buffer to disrupt cell walls and membranes, (2) purification through phenol-chloroform-isoamyl alcohol phase separation to remove proteins and contaminants, and (3) DNA precipitation using isopropanol followed by washing and resuspension in TE buffer; this protocol enables downstream applications like PCR and cloning.
Click to watch →

RT - PCR (Real Time PCR) | Quantitative - PCR | qPCR | Basic Principle and Data Analysis
131.7K
Real-Time PCR (quantitative PCR or qPCR) is a molecular biology technique that amplifies and simultaneously quantifies DNA or RNA in real-time by monitoring fluorescence signals during the amplification process. Unlike traditional PCR which provides endpoint measurements, qPCR uses fluorescent dyes (like SYBR Green) or sequence-specific probes to detect amplified products continuously. The technique involves three main steps: denaturation (95°C), annealing (57-60°C), and extension (72°C), with Taq polymerase synthesizing new DNA strands. During extension, if probes are used, the enzyme's 5' to 3' exonuclease activity cleaves the probe, separating the fluorescent reporter from the quencher and generating a measurable signal. The amplification curve generated shows fluorescence intensity versus PCR cycle number, and the threshold cycle (Cq) value—the point where the signal crosses above background—is inversely proportional to the initial template concentration. Lower Cq values indicate higher initial DNA/RNA amounts, enabling precise quantification of genetic material for applications like viral load detection.
Click to watch →

A Day in the Life of a PLANT SCIENTIST — Ep. 354
20.4K
PCR (Polymerase Chain Reaction) is a fundamental molecular biology technique for amplifying specific DNA sequences. The process involves placing extracted DNA in tubes with nucleotides, primers (short DNA segments matching target regions), DNA polymerase enzyme, and magnesium chloride. The sample undergoes thermal cycling in a thermocycler: heating to 94°C separates double-stranded DNA into single strands; cooling allows primers to bind to complementary sequences; moderate heating enables DNA polymerase to synthesize new strands. After multiple cycles, billions of copies of the original DNA segment are produced, enabling accurate genetic analysis for phylogenetic studies, gene expression analysis, and molecular identification of plant specimens.
Click to watch →
Deep Dive
Applications in plant genomics, such as Next-Generation Sequencing (NGS), marker-assisted breeding, and phylogenetic analysis.
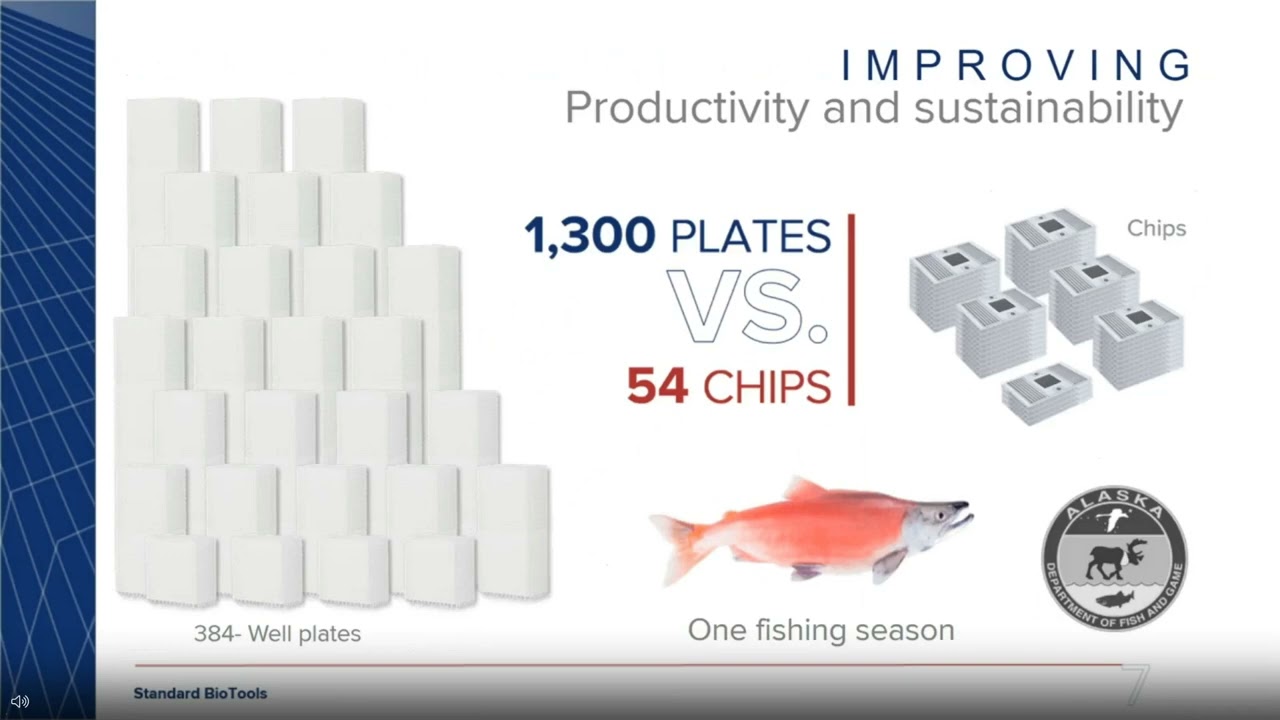
High-Throughput qPCR Microfluidics Technology With Singleplex Accuracy for Plant and Animal genomics
411
Plant genomics applications span pre-breeding DNA fingerprinting for variety identification using thousands of markers, breeding marker-assisted selection with hundreds of SNPs, and quality control including seed purity testing, hybrid verification, and seed lot qualification with pathogen screening. Sample requirements range from 1-10 samples in pre-breeding to hundreds to ten thousand samples in breeding stages. The platform supports both high-density marker screening (NGS sample prep for genome-wide association studies) and mid-low density needs (SNP genotyping and targeted genotyping-by-sequencing). For NGS workflows, microfluidic cartridges enable whole transcriptome sequencing through bead-based mRNA capture, reverse transcription, and whole transcriptome amplification with barcoding capability, as well as targeted amplicon sequencing for specific gene panels.
Click to watch →

Uso de marcadores moleculares PCR para estudios de diversidad de plantas y animales
4.5K
Next Generation Sequencing (NGS) has revolutionized molecular marker development by enabling high-throughput genotyping. SNPs (Single Nucleotide Polymorphisms) are now the most widely used markers, with approximately one SNP every 300-500 base pairs in plant genomes. NGS platforms like Illumina use emulsion PCR to generate millions of microdroplets for sequencing, with detection via fluorescently labeled nucleotides. GBS (Genotyping by Sequencing) is a cost-effective approach where a small random fraction of the genome (0.1-1%) is digested with restriction enzymes, prepared into libraries, and sequenced. DArT (Diversity Arrays Technology) uses restriction enzymes with barcoded primers to detect both SNPs and presence/absence variations. Applications include phylogenetic analysis, parentage determination, and population structure studies. For example, SNP-based studies on carrot domestication revealed clear separation between wild and cultivated varieties, distinguishing New World and Old World cultivars. Studies on native potato varieties in Cusco, Peru demonstrated high genetic diversity within populations and significant differentiation between populations. Software tools include R packages (poppr, adegenet), Arlequin, and STRUCTURE. Marker selection depends on budget constraints, prior genomic information, marker availability, and research objectives.
Click to watch →

Marker Assisted Selection & Its Application in Recurrent Selection, Gene pyramiding & QTL | Agri Ans
111
MAS has three major applications in modern plant breeding. First, in recurrent selection, it accelerates genetic gain per cycle and enables simultaneous selection for multiple QTLs across multiple parents. Second, in gene pyramiding, it combines multiple desirable genes into single genotypes for durable disease resistance, reducing pathogen breakdown risk. Third, in QTL introgression, it enables precise transfer of complex quantitative traits from donor to elite varieties, as demonstrated in drought-tolerant rice development.
Click to watch →

International Hands-on Online Workshop on “Quantitative Genetics and Genomics in Plant Breeding”
1.1K
Linkage mapping requires specific populations: backcross populations, F2 segregating populations, recombinant inbred lines, and double haploid populations. Major marker types include dominant markers (RAPD) that distinguish presence/absence, and codominant markers (SSRs, SNPs) that distinguish all genotypes. SSR markers are microsatellite polymorphic markers highly useful in crop breeding. CAPS markers detect specific mutations by restriction enzyme digestion. Next Generation Sequencing (NGS) has revolutionized genetics by enabling high-throughput sequencing at low cost. NGS platforms generate millions of sequence reads for genome assembly, SNP identification, and genotyping. Genotyping-by-Sequencing (GBS) is particularly valuable for large populations, enabling identification of millions of SNPs for GWAS, linkage mapping, and population genomics studies.
Click to watch →

Session 10. Genomics-assisted breeding of climate-resilient ... by Dr NK Singh, FNA,IARI, New Delhi.
202
The main challenges in genomics-assisted breeding are: (1) Conservation and high-throughput evaluation of germplasm in gene banks; (2) Prioritizing economically important crops for genome sequencing; (3) Understanding plant biology to interpret gene function; (4) Marker-assisted breeding tools are available but require time and expertise. Genome sequencing is now the easiest part, while gene discovery remains the most challenging. SNP chips from companies like Affymetrix and Illumina offer different densities for different applications. The technology has improved from clone-by-clone sequencing to NGS and now to third-generation sequencing, with costs dropping from dollars to cents per nucleotide.
Click to watch →
Deep Dive
Troubleshooting strategies for high-polyphenol or high-polysaccharide plant species that interfere with standard CTAB extraction.

High Throughput Homogenization of Plants webinar
795
Unlike animal tissues which have relatively consistent biochemistries, plants exhibit tremendous biochemical diversity that complicates standardized processing. Different plant species vary dramatically in DNA concentration, carbohydrate content, oil composition, and secondary metabolites like tannins and polyphenols. For example, grapes contain high tannin levels that cause downstream PCR issues, while pine nuts contain tannins that create extraction problems. This diversity means successful methods developed for one plant type may fail for another. Researchers must develop customized protocols for each plant species or tissue type they work with, as universal plant processing methods do not exist due to this inherent variability.
Click to watch →
CTAB Method| Plant DNA Extraction| cetyl trimethylammonium bromide | Biotechnology| Jayarama Reddy
466
This comprehensive protocol covers the entire CTAB-based DNA extraction method for plant tissues. The process begins with understanding why plant DNA isolation is challenging due to biochemical diversity between species, unlike animals. CTAB (cetyltrimethylammonium bromide) serves as a cationic detergent that separates polysaccharides, while additives like polyvinylpyrrolidone inactivate polyphenols. The method, developed by Doley and Doley in 1987, uses cauliflower as a model plant material. Key steps include: preparing CTAB buffer and storing it in a water bath; homogenizing 200mg plant tissue in 1ml CTAB buffer using a cold homogenizer; heating at 60°C for 30 minutes; centrifuging at 12,000 RPM; adding phenol-chloroform-isopropanol (25:24:1 ratio); separating the aqueous layer containing DNA; precipitating with isopropanol at -20°C; washing with 75% alcohol three times; and storing at -20°C. The extracted DNA is suitable for cloning and gel electrophoresis analysis.
Click to watch →

Plant DNA extraction to PCR | Outline
1K
The CTAB method extracts DNA from plant tissue through systematic lysis and purification. Use 100mg leaf tissue (avoid too little or too much). Add 800μl CTAB buffer with 2μl PVP (for protein contamination, OD260/280<1.8) and 2μl RNase (for RNA contamination, OD260/280>2.0). Incubate at 65°C for 30 minutes. Add phenol-chloroform (1:1), centrifuge 12,000rpm 20min at 4°C. Transfer 500μl supernatant, add 500μl CTAB buffer with PVP/RNase, incubate 30min at 65°C. Add chloroform-isoamyl alcohol (24:1), centrifuge again. Transfer supernatant, add isopropanol and sodium acetate, incubate -20°C 24-48 hours.
Click to watch →

Plant DNA extraction by CTAB Method
26K
The CTAB (Cetyl Trimethyl Ammonium Bromide) method is a widely used technique for extracting DNA from plant tissues, which are challenging to process due to their tough cell walls composed of cellulose and the presence of interfering compounds like polyphenols and tannins. The method involves several key steps: first, plant tissue is ground in liquid nitrogen to create a fine homogenate; then, CTAB extraction buffer is added to lyse cells and dissolve the cell membrane, with components including CTAB (which dissolves cell membranes and removes polysaccharides), TRIS-HCl (maintains optimal pH of 7-7.2), EDTA (chelates Mg²⁺ ions to inhibit DNAse activity), NaCl (neutralizes DNA's negative charge to enable precipitation), PVP (absorbs polyphenols and tannins), and beta-mercaptoethanol (breaks disulfide bonds in proteins); the mixture is centrifuged to separate phases, the aqueous layer containing DNA is recovered, and DNA is precipitated using chilled isopropanol or ethanol, washed with 70% ethanol, and finally dissolved in TE buffer for storage and downstream applications.
Click to watch →

10.Biotec_AulaRemota10 - Técnicas Laboratoriais
1.4K
DNA extraction is fundamental for plant biotechnology, enabling genetic analysis and species differentiation. The CTAB method (Doyle, 1987) is the standard protocol. Plant material selection significantly impacts DNA quality: any plant part contains DNA, but fibrous leaves require careful handling, resinous species need special reagents, and dead or damaged leaves lack quality DNA. Fresh leaves are preferred. For temperate species without leaves in winter or tall tropical trees, cambium (meristematic tissue with living cells) is an alternative. Seed DNA considerations include: embryos contain DNA from both mother and pollen donor due to double fertilization, endosperm in angiosperms is triploid, and conifer embryos are haploid with only maternal DNA. Root extraction faces contamination challenges from bacteria and other organisms. Maceration mechanically disrupts cell walls composed of cellulose and pectin, using mortar and pestle, liquid nitrogen, or specialized equipment. The CTAB lysis buffer contains detergent (breaks lipid membranes), EDTA (chelates divalent cations to prevent DNA degradation), Tris (maintains pH stability), NaCl (aids DNA precipitation), PVP (protects DNA from oxidation), and beta-mercaptoethanol (degrades proteins including nucleases). The buffer is prepared at pH 8.0 and heated to 65°C to denature enzymes and break down membrane lipids.
Click to watch →
Sample Prep
Purification
DNA Recovery
Wash & Store
Sample Prep
0:00- 1
Grind plant tissue with liquid nitrogen.
- 2
Measure 200 mg and transfer to tube.
- 3
Add lysis buffer and incubate at 65°C.
Commercial Spin-Column Kits and Direct PCR Methods
While the traditional CTAB (Cetyltrimethylammonium bromide) method is highly effective for yielding large quantities of DNA from plants with high polysaccharide and polyphenol content, it is increasingly challenged by modern alternatives. Critics of the CTAB protocol highlight its use of hazardous chemicals—such as chloroform and beta-mercaptoethanol—which pose safety and environmental risks. Furthermore, CTAB is labor-intensive, time-consuming, and difficult to automate for high-throughput workflows. Modern alternatives, such as commercial silica-based spin-column kits and magnetic bead systems, offer faster, safer, and highly standardized extractions with fewer toxic reagents. For simple downstream applications like PCR, 'Direct PCR' methods bypass extraction entirely by amplifying DNA directly from tiny leaf punches. Consequently, while CTAB remains a valuable academic tool for challenging species, modern labs often favor kit-based or direct amplification methods to maximize efficiency, safety, and reproducibility.
Understanding of plant cell anatomy, particularly the composition and rigidity of the plant cell wall compared to animal cells.
Fundamental knowledge of DNA structure, stability, and its localization within plant cells (nucleus, chloroplasts, and mitochondria).
Basic chemistry concepts of solubility, polarity, and pH, particularly how biological molecules partition into aqueous versus organic phases.
Familiarity with standard laboratory safety protocols and equipment, including microcentrifuges, micropipettes, and fume hoods.
Methods for assessing DNA quality and concentration, such as agarose gel electrophoresis and UV-vis spectrophotometry (e.g., NanoDrop, A260/280 ratio).
Principles and protocols of Polymerase Chain Reaction (PCR) and quantitative PCR (qPCR) using the extracted plant genomic DNA.
Applications in plant genomics, such as Next-Generation Sequencing (NGS), marker-assisted breeding, and phylogenetic analysis.
Troubleshooting strategies for high-polyphenol or high-polysaccharide plant species that interfere with standard CTAB extraction.
133.2K views2.3Klikes8:08@DS-zg4kdOriginal Release: 2020-10-24
[Music] we are going to see in this video an extraction of dna from plant samples using c tab method [Music] 100 ml of setup lysis purple can be prepared using this description [Music] after collection of plant samples i have to measure 200 milligram and grind it with liquid nitrogen [Music] then transfer all ground plant samples into an append of tube and add 700 microliters of sit up lysis buffer [Music] vortex the mixture then incubate at 65 degrees celsius for 20 minutes in a water bath [Music] after incubation centrifuge samples at 10 000 rpm for 10 minutes [Music] after centrifuge transfer supernatant to a clean tube and add an equal volume of chloroform and isoamyl alcohol [Music] after addition of chloroform and isomine alcohol mix it well using vortex [Music] and centrifuge at 10 000 rpm for 10 minutes after centrifuge you will see an aqueous upper layer and an organic bottom layer now transfer the aqueous layer to a clean tube while transferring the quest layer ensure that you are not disturbing the bottom layer [Music] to this add 600 microliters of ice cold ethanol and 150 microliters of sodium chloride solution [Music] now mix the solution and centrifuge at 13 000 rpm for 10 minutes [Music] after centrifuge you could see dna pellet at the bottom of the tube now decant supernatant and wash the pellet with 600 microliters of 70 percent ethanol after addition of ethanol mix it then centrifuge at 10 000 rpm for 5 minutes after centrifuge decant ethanol and air dry the pellet while pouring out ethanol ensure that palette stayed at the bottom of a conductive air dry the pellet add 50 microliter of tea buffer to the pellet and resuspend it [Music] after store the samples at 4 degree celsius for further analysis
Up Next
23:17
Gel Electrophoresis of DNA: Agarose Gel Procedure Explained
@shomusbiologyofficial
264.4K views•2019-12-28

50:12
Bacterial Communication: Quorum Sensing and Biofilm Formation Explained
@JHUAAP
12.6K views•2011-06-28

5:35
Enteric Nervous System Explained: The Gut's Brain | Neurobiology Lecture
@alumniu6029
438 views•2018-09-12

7:08
Bacteriophages: Earth's Deadliest Killers and Future Antibiotics
@kurzgesagt
34.6M views•2018-05-13
Related Study Plans & Knowledge Roadmaps
Structured learning paths in Biology
biology
RNAi: Biogenesis, RISC & Gene Silencing
01Molecular Biology Foundations: DNA to Protein
02Introduction to RNA Interference (RNAi)
03Molecular Biogenesis of miRNA and siRNA
+ 2 more learning modules
10h5 modules
Explore Roadmap
biology
Mycorrhizae: Signaling, Biophysics & Ecology
01Foundations of Mycorrhizal Symbiosis
02Molecular Signaling and Root Colonization
03Biophysics and Bioenergetics of Nutrient Exchange
+ 1 more learning modules
11h4 modules
Explore Roadmap
biology
Circadian Clocks: TTFL, SCN & Periphery
01Foundations of Molecular Biology & Gene Expression
02Introduction to Chronobiology and Actograms
03The Core TTFL: Molecular Architecture of the Clock
+ 3 more learning modules
14h6 modules
Explore Roadmap
biology
Population Genetics: Math, Drift & Selection
01Genetic & Probability Foundations
02The Hardy-Weinberg Principle and Baseline Models
03Mathematical Modeling of Natural Selection
+ 3 more learning modules
18h6 modules
Explore Roadmap