



![Introduction To Plasmid DNA [Plasmid-101]](https://i.ytimg.com/vi_webp/7aFYU8m2qrE/maxresdefault.webp)












![[LIVE] A Chill Day of DNA Design (And Updates!)](https://i.ytimg.com/vi/3WkEiD2R7Ag/hqdefault.jpg)



This video demonstrates how to analyze restriction digest results to verify plasmid identity by comparing expected band patterns (based on plasmid maps) with actual gel electrophoresis results; key concepts include understanding that supercoiled DNA migrates faster than nicked DNA (which migrates slower than linear DNA), and that band intensity correlates with fragment size (larger fragments appear brighter), allowing researchers to confirm plasmid identity when observed patterns match predictions.
Restriction Digest Analysis: Plasmid Verification via Gel Electrophoresis
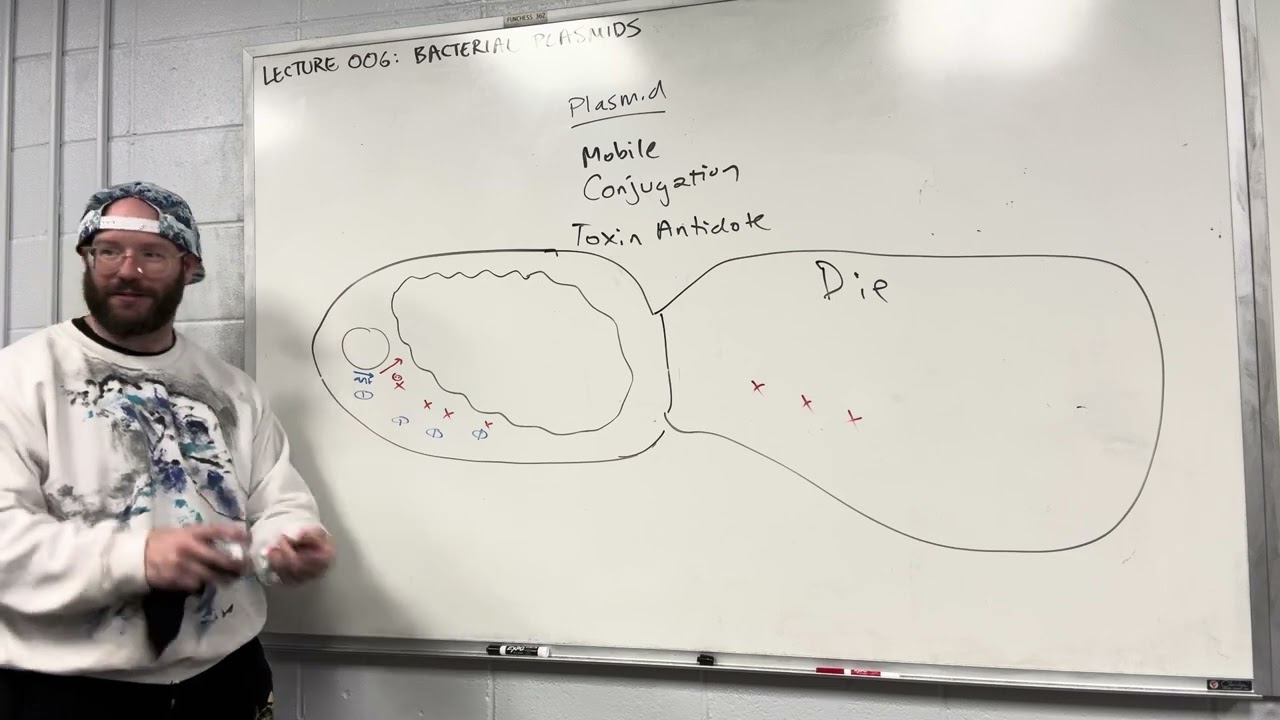
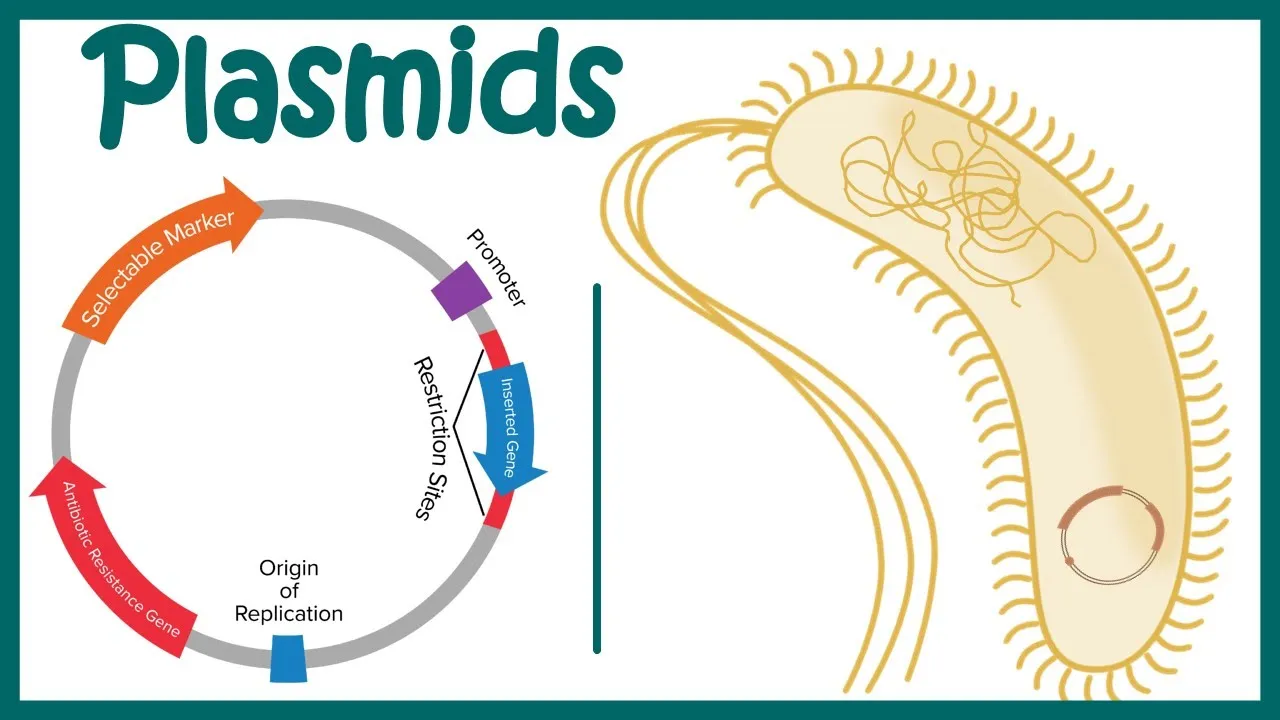
Added:Understanding the basic structure and characteristics of plasmid DNA, including circularity, supercoiling, and components like the multiple cloning site (MCS).
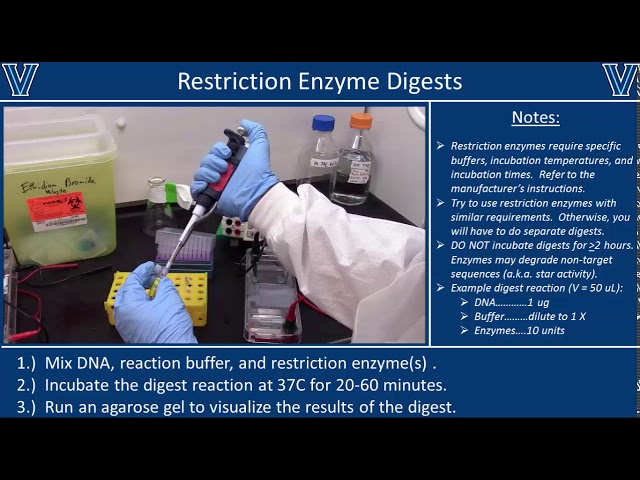
The biochemical mechanism of restriction enzymes (endonucleases), including how they recognize specific palindromic DNA sequences and create sticky or blunt ends.
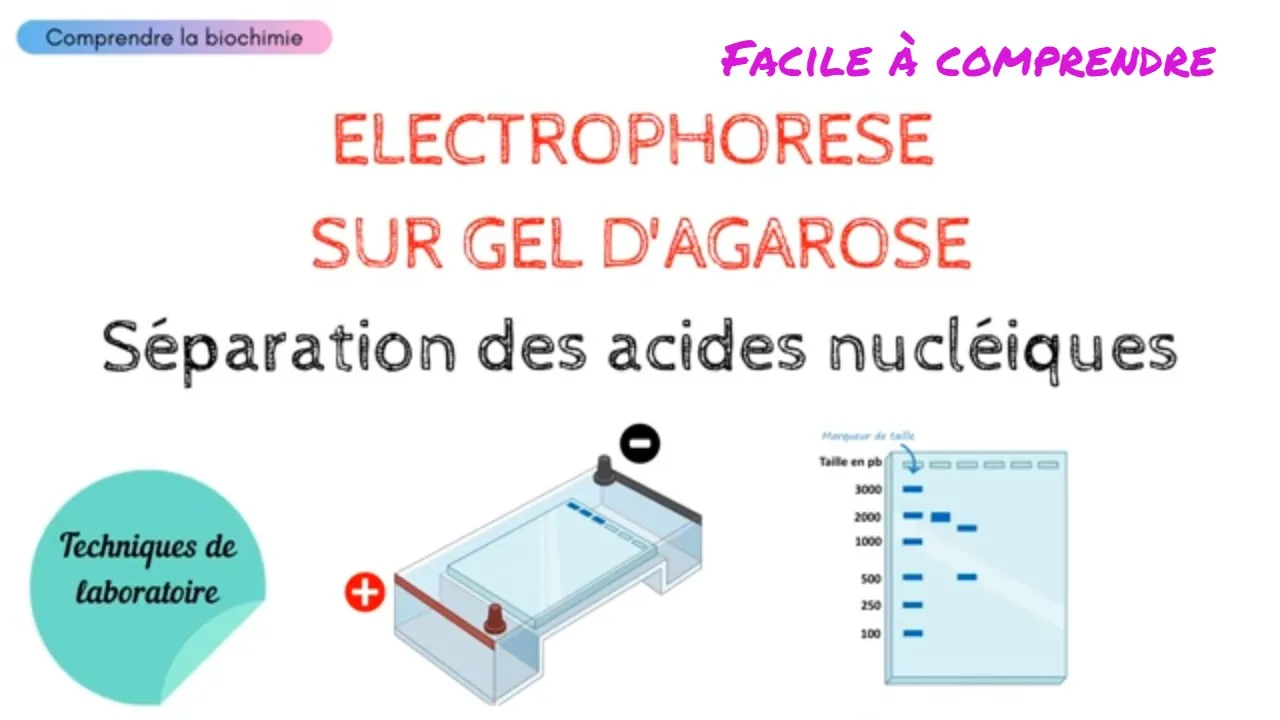
The fundamental principles of agarose gel electrophoresis, including how DNA's negative charge drives its migration through a matrix toward the positive anode.
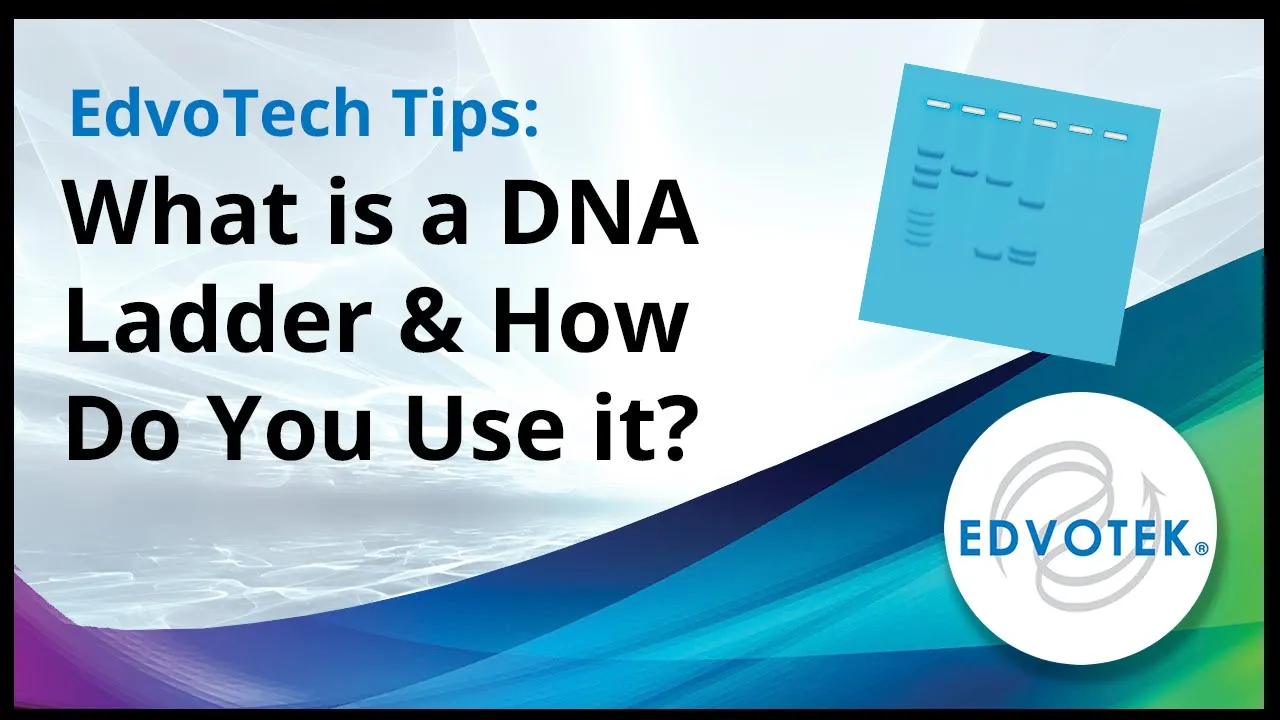
The purpose and function of a DNA ladder (molecular weight marker) in estimating the size of migrated DNA fragments.
Troubleshooting restriction digest anomalies, such as incomplete digestion, star activity, and distinguishing between different plasmid conformations (nicked, linear, supercoiled) on a gel.
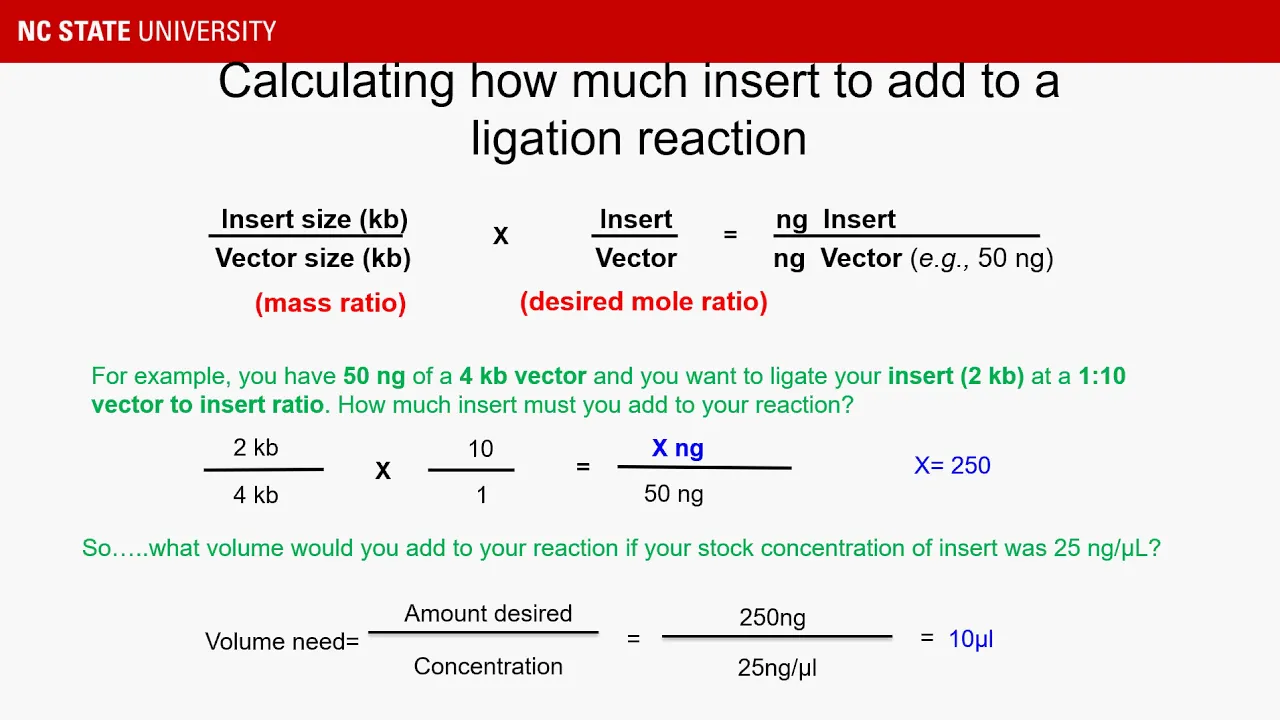
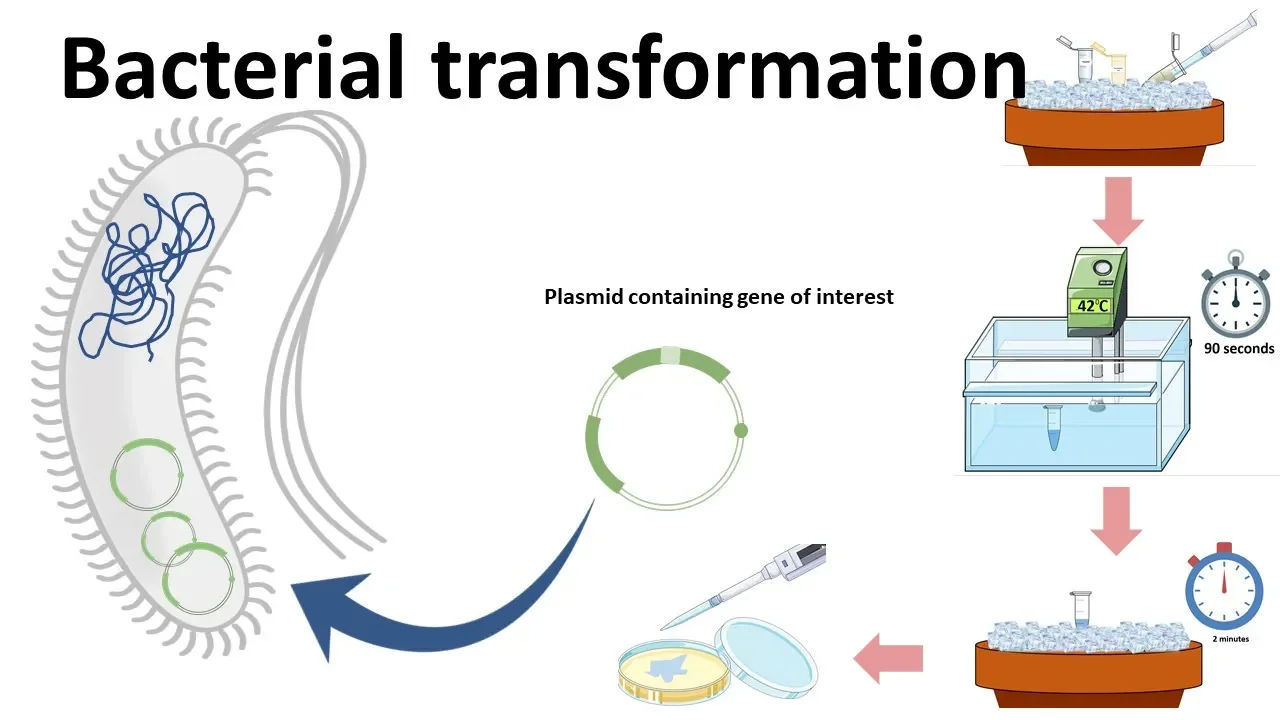
Downstream cloning workflows, including DNA ligation, transformation of recombinant plasmids into competent bacterial cells, and antibiotic selection.
Advanced plasmid verification methods, such as PCR screening and Sanger sequencing, to confirm sequence orientation and accuracy at insertion junctions.
Utilizing verified plasmids for downstream applications, such as transfecting host cells for recombinant protein expression or gene editing experiments.
219.4K views2.2Klikes8:02Original Release: 2016-12-13
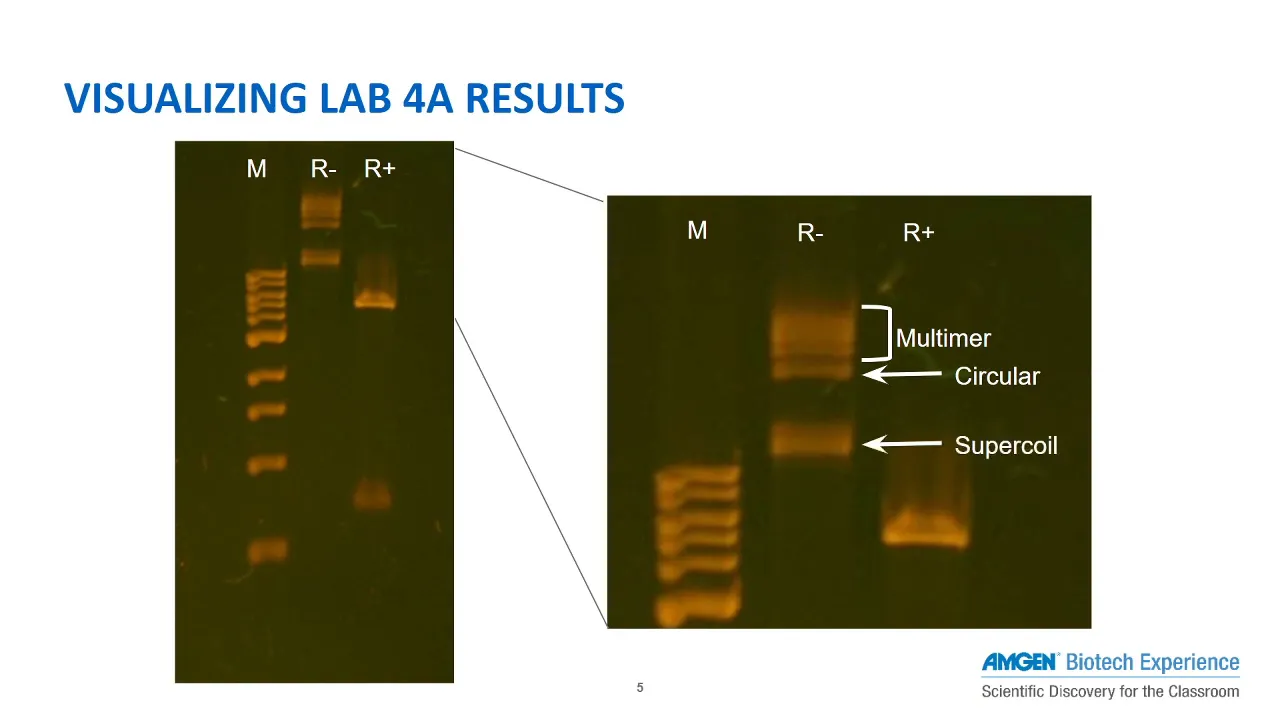
[Music] restriction enzyme digestion is a fast and inexpensive way to gather broad sequence information about plasma DNA a restriction digest can give a generalized bird's eye or macroscopic view of the entire plasmid it can also reveal useful information like the Purity and confirmation of a plasmid which is important for Downstream applications like transection for example super coil DNA has higher transfection efficiency see the nicked DNA while in theory and in textbooks restriction digestion is straightforward interpreting the results of a diges in practice is easier said than done in this video we will digest a plasmid of known identity with restriction enzymes run the products on an agar Ro gel and analyze the results we'll focus on identifying the bands produced under different conditions and use the results to make conclusions about the plasmid now let's start our analysis the first thing you should do is draw out your expected results while this step may seem unnecessary it's good practice and it will make your analysis go a lot faster in this exercise we would like to verify the identity of a plasmid we received from adene we'll digest this 7.5 kilobase pair plasmid individually with either ag1 or X1 which are both single Cutters and then with A1 and X1 together we'll also digest the plasmid with Echo R1 which has two recognition sites in the plasmid so let's draw out the expected results here's our gel Lane one is the size marker often referred to as the ladder lane two will be the undigested control because this plasma is circular the migration pattern of the undigested control diverges a bit from the migration pattern of the ladder which was made with linear DNA the uncut plasma typically adopts a super coiled confirmation that's because these plasmas were isolated from bacteria and super coiled is the native confir of plasmans in Vivo because it's compact a compact confirmation allows the plasma to migrate through the gel at a faster rate than its linear equivalent this is because it experiences the same amount of electromotive force but less resistance due to friction as a result it runs a little smaller than the equivalently sized band on the ladder this plasman is 7.5 kilobases so let's draw the super coiled band right below the 7.5 kilobase pair Mark another confirmation of uncut plasma DNA is nicked DNA can be nicked naturally in Vivo through the activity of Topo isomerases DNA can also get nicked during purification if the conditions are harsh so it's common to see nicked DNA in your uncut control when one strand of the DNA is nicked super coiling is released so the confirmation of Nick DNA resembles a floppy hula hoop or a hair tie making it relatively large in fact Nick DNA is so big that as it's migrating through the gel it experiences greater resistance due to friction than even the linear DNA which can be more flexible than the Nick consequently Nick DNA runs a little higher than the equivalently sized band on the ladder since we're still talking about a 7.5 kilobase par plasmid let's draw the Nick DNA a little above the 7.5 KB Mark now that we've drawn our control let's move on to our digestions lane three is the ag1 digestion which yields a single product and because it's linear its migration is consistent with the marker so we expect to see a band at the 7.5 KB Mark Lane four is the xball one digestion just like ag1 it yields a single linear 7.5 KB band so we expect to see a band in the same 7.5 KB Spot Lane five is the double ag1 xile 1 digest according to our map we would expect two products a 7.2 KB band and a 300 base pair B band since these two fragments appear in a 1:1 mol ratio we know the 7.2 KB band will be 24 times brighter than the 300 base pair band because it is 24 times as large this means that if we don't have a bright enough 7.2 KB band we might not even see the 300 base pair band Lane six is the echo R1 digest Echo R1 Cuts in two places so we expect two products a 5.4 KB band and a 2.1 1 KB band okay this picture looks complete let's run our experiment and see our results run your gel long enough to get good separation of the Bands don't rush [Music] it [Applause] [Music] a [Music] now that we've run our digestion let's go through each lane and compare our experimental data with our expected results we've marked the ladder with the sizes of the markers lane two the uncut negative control we expect to see a super coiled band and a nicked band and that's what we see here as expect Ed the super Co runs a little faster than the 7.5 KB band and the Nick runs a little slower than the 7.5 KB band based on the relative intensities of these two bands we can tell that the majority of our DNA is in the super coiled confirmation also based on the sharpness of the bands and the lack of smear we can deduce that we have a clean DNA prep Lanes three and four are the ag1 and X by1 single digests where we expect a single 7.5 KB band and possibly some of the cut fragments in each lane we do see a linear 7.5 KB band Lane five is the A1 XA 1 double digest where we expect two digestion products we can identify the 7.2 KB band clearly since this is a new band we know it must be the 7.2 KB digestion product looking for the 300 base pair band we find that it's visible but faint from our earlier calculations we expect the band to be 24 times less intense than the 7.2 KB band so the band intensity is not surprising Lane six is the echo R1 digest again we see two new digestion products in this Lane relative to the negative control Lane notice we do not see any residual nicked or super coiled bands which indicates that the reaction was run to completion overall our Gel looks close to the expected results and we don't see any bands that we can explain this indicates that the plasmid we've isolated is most likely the plasmid we think it is I hope this video helps you set up and analyze your next diagnostic digest this was just one example of how restriction digests can be useful other diagnostic digests like DNA fingerprinting follow these same principles and can be used to map plasmas or even entire genomes in more detail feel free to share your comments at the bottom of the page if you like this video check out our other videos at ad.org protocols adene a better way to share science
Up Next
9:36
Luciferase Reporter Assay: Applications in Gene Expression Analysis
@animatedbiologywitharpan
69.8K views•2022-06-07
50:12
Bacterial Communication: Quorum Sensing and Biofilm Formation Explained
@JHUAAP
12.6K views•2011-06-28

5:35
Enteric Nervous System Explained: The Gut's Brain | Neurobiology Lecture
@alumniu6029
438 views•2018-09-12

7:08
Bacteriophages: Earth's Deadliest Killers and Future Antibiotics
@kurzgesagt
34.6M views•2018-05-13
Related Study Plans & Knowledge Roadmaps
Structured learning paths in Biology
biology
RNAi: Biogenesis, RISC & Gene Silencing
01Molecular Biology Foundations: DNA to Protein
02Introduction to RNA Interference (RNAi)
03Molecular Biogenesis of miRNA and siRNA
+ 2 more learning modules
10h5 modules
Explore Roadmap
biology
Mycorrhizae: Signaling, Biophysics & Ecology
01Foundations of Mycorrhizal Symbiosis
02Molecular Signaling and Root Colonization
03Biophysics and Bioenergetics of Nutrient Exchange
+ 1 more learning modules
11h4 modules
Explore Roadmap
biology
Circadian Clocks: TTFL, SCN & Periphery
01Foundations of Molecular Biology & Gene Expression
02Introduction to Chronobiology and Actograms
03The Core TTFL: Molecular Architecture of the Clock
+ 3 more learning modules
14h6 modules
Explore Roadmap
biology
Population Genetics: Math, Drift & Selection
01Genetic & Probability Foundations
02The Hardy-Weinberg Principle and Baseline Models
03Mathematical Modeling of Natural Selection
+ 3 more learning modules
18h6 modules
Explore Roadmap