In Praat software, vowel formants (F1 and F2) can be measured by identifying the gray shades in the spectrogram; F1 is inversely related to vowel height (high vowels have lower F1 values), while F2 is directly related to vowel frontness (front vowels have higher F2 values), and measurements are obtained by clicking on stable formant regions and selecting Format Listing to display their values.
Praat Tutorial: Measure Vowel Formants (F1 & F2) in Acoustic Analysis
Added:Deep Dive
Basic concepts of acoustic phonetics, particularly the source-filter theory of speech production.
Noções Básicas de Fonética Acústica: parte 1
835
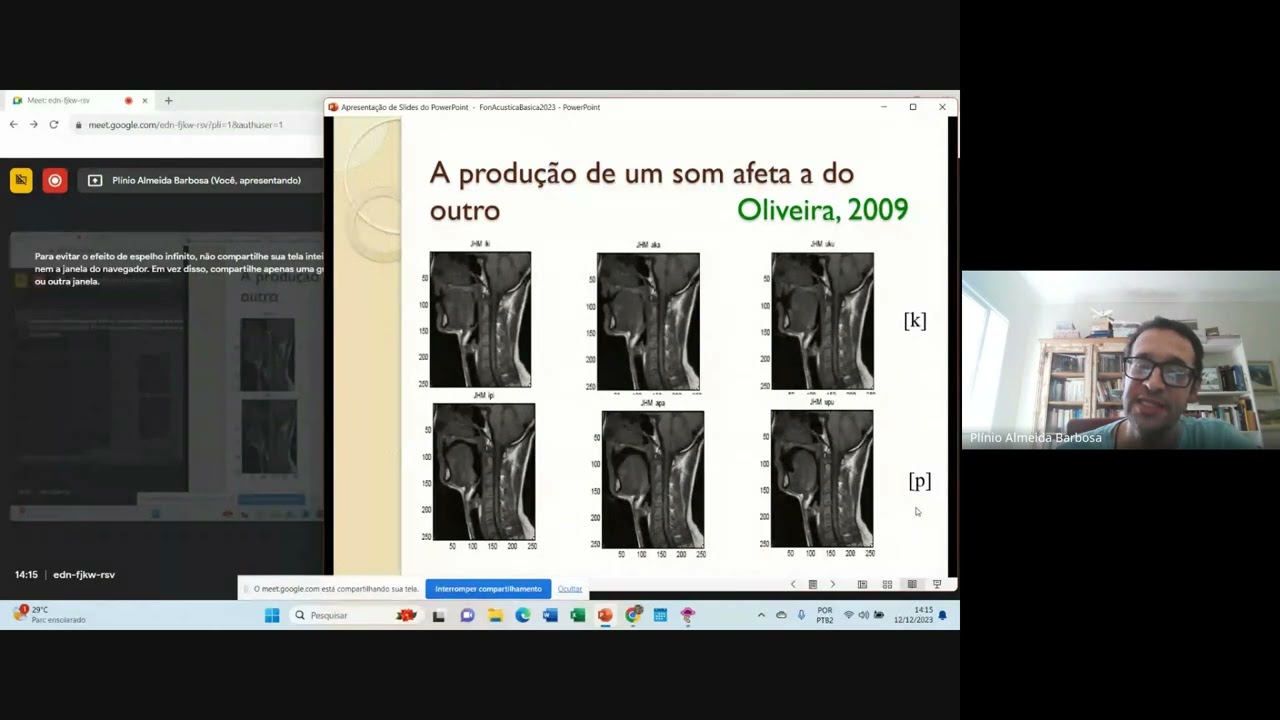
This section covers the physical basis of speech production and analysis. The instructor introduces the three branches of phonetics: articulatory phonetics (studying sound production using instruments like MRI, ultrasound, and electropalatography), auditory phonetics (studying sound perception through experiments with listeners), and acoustic phonetics (studying the physical properties of speech sounds). The source-filter theory is explained: the glottal source (vocal folds) produces harmonics, and the vocal tract filter amplifies certain frequencies (formants). Different vowel configurations create different resonances, with 'a' having formants at approximately 700 Hz (F1), 1200 Hz (F2), and 2300 Hz (F3), while 'i' has a higher F2 (around 2200 Hz) and 'u' has a lower F2 (around 800 Hz). The section covers spectrogram types: wideband shows time precisely but frequency imprecisely (good for identifying voicing onsets), while narrowband shows frequency precisely but time imprecisely (good for identifying formant frequencies). The window length parameter determines this trade-off, as frequency is the inverse of period (f = 1/T). The instructor demonstrates how to measure vowel duration and extract spectral slices to obtain precise formant measurements.
Click to watch →

219.Physiology of Phonation ent #anatomy_physiology #sound
9.8K
The supraglottic vocal tract serves as the resonating system, comprising oral resonance (modified by jaw, mouth opening, tongue, and pharyngeal constriction) and nasal resonance (controlled by velopharyngeal sphincter). Normally closed, the velopharyngeal sphincter directs sound to the oral cavity; when open, nasal resonance adds characteristic timber. Articulators convert vocal sound into recognizable speech through the source-filter model: the vocal folds generate the source sound, while articulators (lips, tongue, soft palate) act as filters. Vowels require no obstruction, consonants require obstruction, and semi-vowels (w, y) require partial obstruction. This transforms raw vocal sound into meaningful speech.
Click to watch →

英語語音學二 19. Introduction to Acoustic Phonetics: Resonance (2021 updated)
348
The source-filter model explains speech production: the vocal folds generate a complex sound (source) with fundamental frequency and many overtones. The vocal tract acts as a filter that selectively amplifies certain frequencies while attenuating others. The source provides the raw material (all frequencies present), while the filter determines which frequencies are emphasized. This model separates the generation of sound from its modification, providing a framework for understanding how different speech sounds are produced.
Click to watch →

The phonetics of male voice change
203.3K
The human voice is produced through the source-filter model, where the vibrating vocal folds (source) determine pitch, while the vocal tract cavities (filter) shape the sound into recognizable speech; male voices typically deepen during puberty when testosterone causes vocal fold lengthening, and voice characteristics can be artificially modified by independently adjusting pitch and formants using software like Praat.
Click to watch →

Yeah. Let's Break Down Miss Chile Death Core Queen.
52.1K
Source-filter theory explains all vocal production: sound sources (vocal folds or structures above them) generate vibrations that travel through filters (the vocal tract). In death metal vocals, sources often come from false folds or epiglottic structures above true vocal folds. The filter's shape dramatically affects timbre—like how tile walls create resonance versus clothes that absorb sound. The performer demonstrates this by changing lip shape and mouth opening while keeping the source constant, creating dramatically different sounds. Elongating the vocal tract enhances lower harmonics, helping female screamers achieve deeper, fiercer tones. Pitch control differs from clean singing: in harsh vocals, pitch shifts through filter changes (mouth/lip adjustments) rather than source manipulation. This creates a dual-edged challenge—filter adjustments for pitch also affect lyric annunciation, making harsh vocals extremely difficult for clear word delivery.
Click to watch →
Deep Dive
An understanding of what formants are and how they relate to vocal tract resonance and vowel quality (e.g., how tongue height and advancement affect F1 and F2).
What are FORMANTS and HARMONICS? VOCAL FORMANTS AND HARMONICS Explained!
71.2K
Formants are the resonance frequencies of the vocal tract, which extends from the vocal folds to the lips/nostrils. Unlike pipe organs with uniform pipes, the human vocal tract is highly adjustable with bends, side branches, and multiple resonating cavities. The lower two formants (first and second) are most relevant to vowel differentiation and are controlled by articulators including the tongue, jaw, lips, soft palate, pharynx, and larynx. The pharynx (largest cavity) resonates at the lowest frequency as the first formant space, while the oral cavity serves as the second formant space. The tongue acts as a movable partition between these spaces. When forming vowels like EE (high front tongue, narrow oral cavity) versus AH (low back tongue, wide oral cavity), the available resonance space changes, altering formant frequencies and allowing listeners to distinguish between vowels based on spectral characteristics.
Click to watch →

The Vowel Space
222.2K
Vowel quality is determined by formant frequencies (F1 and F2) rather than physical vocal tract dimensions. F1 relates to the lower resonance and varies from lowest in /a/ to highest in /i/, while F2 relates to the higher resonance and varies from lowest in /u/ to highest in /i/. Shorter vocal tract tubes produce higher resonances—/e/ has short oral tube and long throat tube, /i/ has short throat tube and longer mouth tube, while /o/ has both tubes longest. These formants can be measured from any recording and synthesized to recreate intelligible vowels, though early synthesis sounded artificial. The horizontal and vertical axes of vowel space correspond to these resonating cavities.
Click to watch →
Speech Acoustics 5 - vowel formants
57.6K
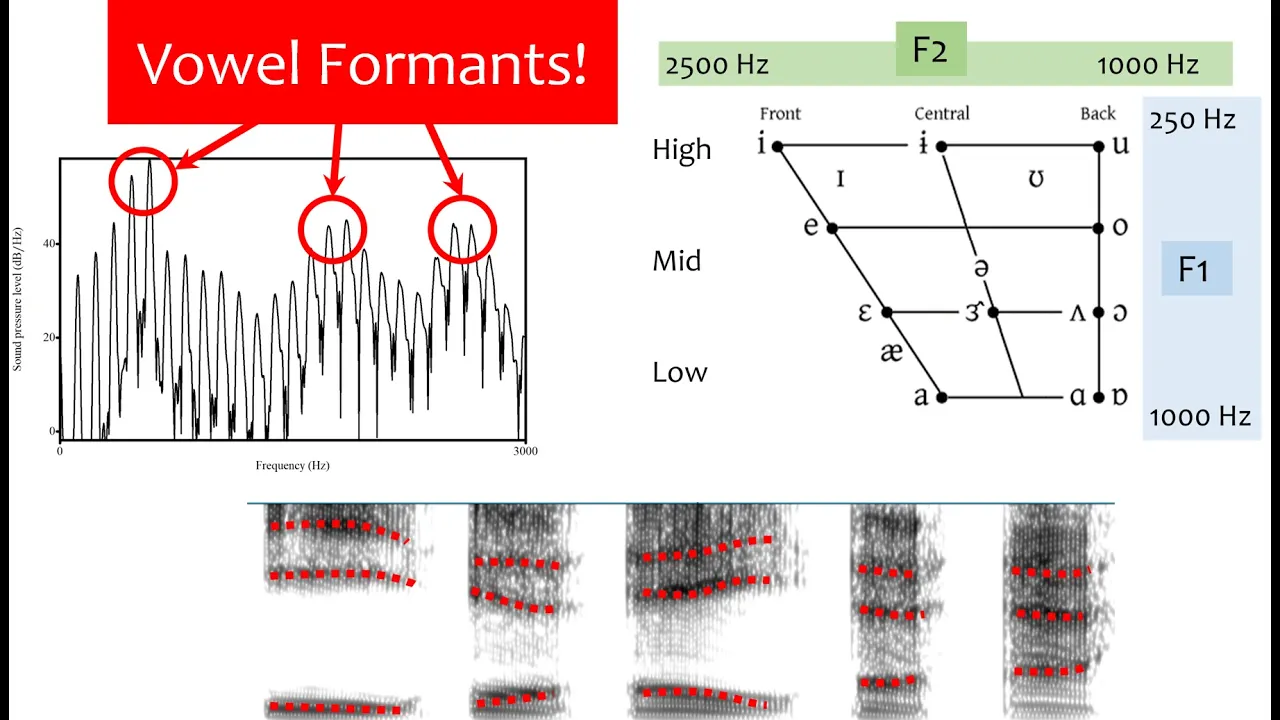
Vowel formants are resonant frequencies of the vocal tract that determine vowel quality; the first formant (F1) corresponds inversely to vowel height (higher F1 means lower tongue position), while the second formant (F2) corresponds to vowel advancement (higher F2 means more front tongue position). These formants can be visualized in spectra as dark energy bands or in spectrograms over time, and plotting F1 against F2 produces a vowel chart that systematically represents all vowel qualities based on their acoustic measurements.
Click to watch →

Formants in Speech: Resonance and Vowel Acoustics Explained
59.5K
The human vocal tract acts as a resonating tube that filters the sound wave produced by vibrating vocal folds, with formants (resonant frequencies) determining vowel quality; higher tongue positions produce lower first formant (F1) values while tongue frontness affects the second formant (F2), and lip rounding extends the vocal tract to further modify these resonances.
Click to watch →

this is a Romance language, trust me bro
36.9K
Formants are the centers of resonant frequencies in a vowel sound, representing the loudest frequencies that determine how we perceive that vowel. The first formant (F1) corresponds to vowel height - higher F1 values indicate more open vowels. The second formant (F2) corresponds to vowel frontness or backness - higher F2 values indicate more fronted vowels. These two formants can be visualized on a graph where F1 is plotted on the Y-axis and F2 on the X-axis, creating the familiar IPA vowel trapezoid diagram.
Click to watch →
Deep Dive
Familiarity with the Praat user interface, including how to open audio files and navigate the Sound editor window.

Praat-ohjelman äänieditori-ikkuna
3.1K
This video provides a brief introduction to the Praat audio editor interface, demonstrating how to open audio files, navigate the object list and dynamic menu, listen to and browse audio samples, edit audio using cut-paste functions, and save audio files.
Click to watch →

praat platform 2 transcription منصة برات للتفريغ الصوتي
475
To open an audio file in Praat, users should click on the 'Open' option and then select 'Read from file'. Users can navigate to their audio file location and select the desired file. If the audio file is in an unsupported format, users may need to convert it to a compatible format like WAV or MP4 before opening it. In Praat, users can create speakers for transcription projects, where each speaker represents a voice in the audio file. Users can add multiple speakers (one, two, or three) and assign names to each. All voices in the audio file are assigned to a single speaker unless specified otherwise. Underlines must be created before adding multiple speakers, as they are conditions that must be established first.
Click to watch →
![Praat & Scripting, Part A, Chap 01, [06_p62], 윤규철 교수](https://i.ytimg.com/vi/B0fZmQQ_XeQ/maxresdefault.jpg)
Praat & Scripting, Part A, Chap 01, [06_p62], 윤규철 교수
101
This tutorial covers the Praat sound editor's interface features including interval display options (showing all intervals, non-empty intervals, or intervals with points), text search and highlighting within intervals, query menu functions for analyzing selected audio portions, keyboard shortcuts for playback control (Tab for play, Escape for stop), precise cursor movement commands (move cursor to/by), scroll step adjustment for navigation, and spectrogram window size settings that affect frequency resolution versus time resolution.
Click to watch →

SLHS 1301 class (10/20) - getting started with praat
5.8K
Praat is a widely-used software for speech and sound acoustics analysis across Linguistics, Phonetics, Hearing Sciences, Music Science, Psychology, and Computer Science. Students must download it from pr.org, selecting their operating system. Audio files for exercises are available in the course Canvas portal under the 'Pro' folder, and should be downloaded simultaneously using Shift-click selection. Sound files open through drag-and-drop or Control+O navigation. The Object List displays opened sounds as temporary copies. The View and Edit button reveals the waveform (raw pressure deviations over time) and spectrogram (frequency content over time). Time information appears with three decimal places for millisecond precision. Clicking and dragging creates selection boxes displaying start time, end time, and duration. Periodic signals like vowels show equally spaced vertical stripes in the waveform, representing repeated glottal cycles. The fundamental frequency equals the reciprocal of the period duration—for a 7.5ms period, this is approximately 133 Hz. Pitch represents the rate of repetition in periodic signals, displayed as a contour showing fundamental frequency over time. Pitch range settings should match the speaker's actual range (typically 70-200 Hz for adult males) for optimal visualization.
Click to watch →
English phonetics and phonology 1: how to open Praat and analyse VOT
5.8K
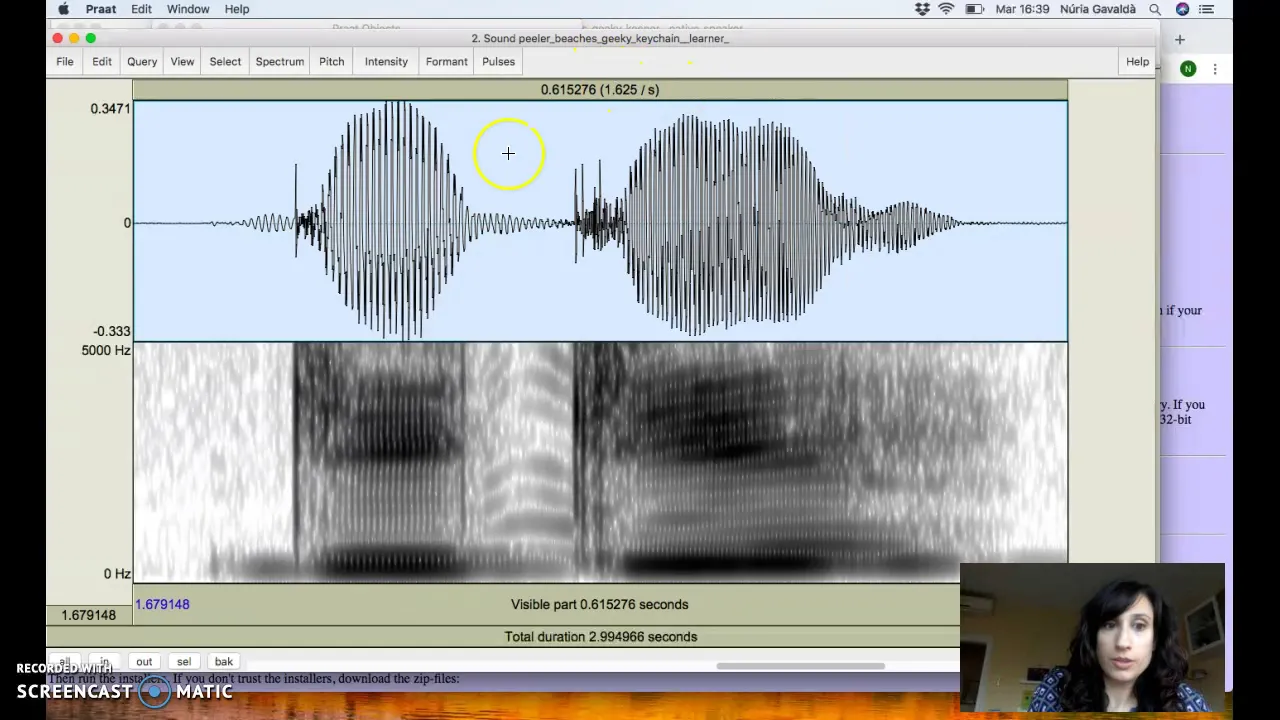
Praat is a free speech analysis software downloadable from Google, available for Windows and Mac. After installation, users access two main windows: a display window (which can be closed) and a 'Praat objects' window for file management. Files are opened via 'Open' > 'Read from file'. Spectrograms are viewed by selecting sounds and choosing 'View & Edit', displaying time horizontally and frequency vertically with intensity shown through color gradients. Zooming is achieved by selecting regions and pressing Ctrl+N. Plosive releases appear as vertical bars in spectrograms, with white spaces indicating complete closures before release.
Click to watch →
Deep Dive
How to read a basic spectrogram, including the representation of time, frequency, and amplitude/intensity.

CSD3084 Spectrogram Basics
22.9K
A spectrogram is a three-dimensional visualization tool that displays speech signals with time on the x-axis, frequency on the y-axis, and darkness (or color) representing amplitude on a dB scale; periodic sounds like voiced speech appear as vertical striations, noise sounds appear as white or light gray areas, and transients appear as brief vertical stripes, with the trade-off between time and frequency resolution determined by the window size used in spectrogram creation.
Click to watch →

10 - Understanding audio data for deep learning
65.3K
A spectrogram is a visual representation produced by the Short-Time Fourier Transform, displaying magnitude as a function of both time and frequency. Time appears on the x-axis, frequency on the y-axis, and color intensity represents the magnitude of each frequency component at each moment. Darker colors indicate stronger presence of specific frequencies at particular times.
Click to watch →

Spectrogram Analysis and Vowel Formants in Praat Tutorial
237.2K
Differences in amplitude (loudness) of frequency components are shown on spectrograms by shading. Components with the highest amplitude values appear as dark black areas, while components with lower amplitude values are displayed in lighter shades of gray, up to white which signifies very low amplitude or silence. This creates a three-dimensional representation showing time on the horizontal axis, frequency on the vertical axis, and amplitude through shading.
Click to watch →
Spectrograms: an Introduction
106.6K
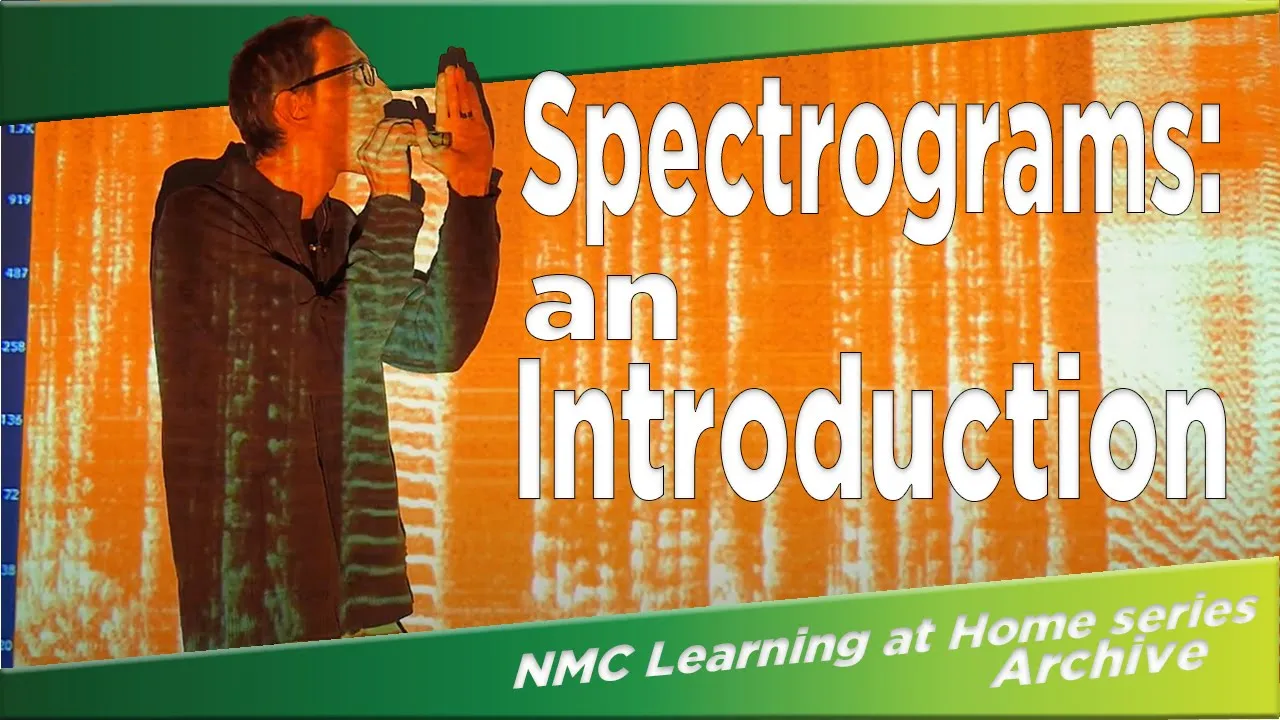
A spectrogram is a visual tool for analyzing sound. The x-axis represents time, showing how sound progresses from left to right. The y-axis represents pitch, with lower pitches displayed at the bottom and higher pitches at the top. Volume is represented by color intensity, where darker colors indicate quieter sounds and lighter colors (such as white) indicate louder sounds.
Click to watch →

Жуткие Послания Скрытые в Песнях из Мультиков (и не только из мультиков) ► коваленко трунь | Реакция
163.4K
A spectrogram is a visual representation of sound that shows the relationship between frequency and time. The horizontal axis represents time, while the vertical axis represents frequency (the pitch of the sound). The color or intensity of the visual elements indicates the loudness or amplitude of the sound at that frequency. Black represents silence, while white or bright colors represent loud sounds. This visualization allows us to see sound patterns that are not audible to the human ear.
Click to watch →
Prerequisite Knowledge
- Concept 01Basic concepts of acoustic phonetics, particularly the source-filter theory of speech production.
- Concept 02An understanding of what formants are and how they relate to vocal tract resonance and vowel quality (e.g., how tongue height and advancement affect F1 and F2).
- Concept 03Familiarity with the Praat user interface, including how to open audio files and navigate the Sound editor window.
- Concept 04How to read a basic spectrogram, including the representation of time, frequency, and amplitude/intensity.
Subsequent Learning
- Step 01Scripting in Praat to automate formant extraction and analysis for large acoustic datasets.
- Step 02Vowel normalization methods (such as Lobanov or Nearey) to control for anatomical differences among speakers.
- Step 03Visualizing vowel spaces (plotting F1 vs. F2) using statistical software like R, Python, or specialized phonetic tools.
- Step 04Analyzing dynamic formant trajectories (such as measuring diphthongs or coarticulation effects over time rather than at a single static point).
Vowel Analysis through Formants
Measuring Formant Values
Vowel Analysis through Formants
0:04Playing Section
- 1
Explains how to identify vowels using spectrogram formants.
- 2
High vowels show lower F1; front vowels show higher F2.
- 3
F3 used for speech contrast discrimination when needed.
Limitations of Static F1/F2 Tracking and the Whole-Spectrum Alternative
While measuring static F1 and F2 at a single time point (typically the vowel midpoint) is the traditional standard in acoustic phonetics, this approach has significant limitations. First, LPC-based formant tracking in Praat is notoriously prone to errors in high-pitched voices (such as children's or high female voices), nasalized vowels, and creaky voice, where the algorithm often merges or misidentifies formants. Second, static measurements ignore 'Vowel Inherent Spectral Change' (VISC)—the dynamic trajectory of a vowel over time—which perceptual studies show is crucial for human vowel identification. Critics and modern phoneticians advocate for alternative methods, such as whole-spectrum analysis (using Mel-Frequency Cepstral Coefficients or spectral moments) and dynamic trajectory tracking. These alternative frameworks argue that vowel identity is encoded in the continuous, global spectral shape of the acoustic signal rather than isolated, static formant frequencies.
Deep Dive
Scripting in Praat to automate formant extraction and analysis for large acoustic datasets.
![Praat & Scripting, Part A, Chap01, [01], 윤규철 교수](https://i.ytimg.com/vi/0LQSzxu47wU/sddefault.jpg)
Praat & Scripting, Part A, Chap01, [01], 윤규철 교수
670
Praat is an open-source speech analysis software that enables users to analyze speech through waveform visualization, spectrogram examination, and formant analysis, with powerful scripting capabilities that allow automated processing of large datasets without manual intervention.
Click to watch →

Praat11:フォルマントを自動抽出するスクリプト解説
760
This video demonstrates how to write a Praat script that automatically extracts formants (F1, F2, F3) from multiple audio files by calculating the midpoint of each interval, creating an analysis window (0.25s before and after the midpoint), and extracting formant values within that window, with results saved to a tab-separated text file.
Click to watch →

Prep06: Praat scripting
541
Praat scripting enables efficient batch processing of multiple audio files by recording GUI operations into scripts, allowing users to automate repetitive tasks like pitch analysis across entire corpora; scripts can be created interactively by recording mouse actions, saved with .praat extensions, and executed either within Praat's GUI or from the command line, with Praat's scripting language supporting basic programming constructs such as loops, conditionals, and variable handling for processing operations on sound and pitch objects.
Click to watch →

Sine waves to complex wave
293
Praat scripts can automate the process of approximating vowels using formants. The script extracts formant frequencies and their corresponding sound pressure levels, converts dB to pascals, creates individual pure tone sounds for each formant, and combines them into a single complex wave. This demonstrates how programming can replicate manual analysis procedures efficiently.
Click to watch →
Make your own vowel chart!
23K
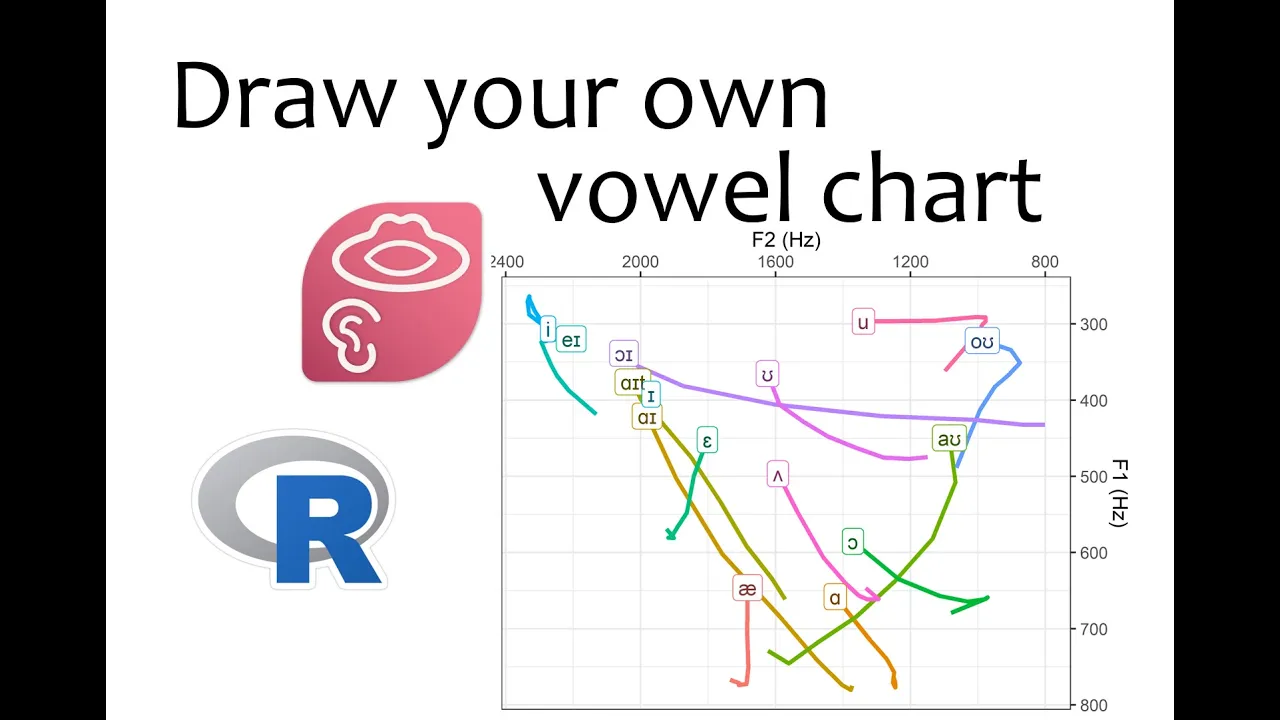
Create a Praat script that analyzes the sound using the Berg algorithm with appropriate settings (e.g., 4200 Hz max frequency, 4 formants, 40ms window). The script should iterate through each interval in the TextGrid, extract formant values at multiple time points within each vowel, and compile results into a table containing time, absolute time, and first, second, and third formant values.
Click to watch →
Deep Dive
Vowel normalization methods (such as Lobanov or Nearey) to control for anatomical differences among speakers.

Lingstats - Homework #3
120
This comprehensive section explains the Lobanov method of vowel normalization developed by Boris Lobanoff in 1971. Students learn to normalize vowel measurements by converting raw scores to z-scores specific to each speaker, calculating means and standard deviations separately for F1 and F2. The process involves extracting individual speaker data, computing z-scores, storing normalized values in new columns using cbind(), and combining multiple speakers' data using rbind(). Students then compare raw versus normalized vowel plots to understand how normalization removes speaker-specific variability while preserving relative vowel positions.
Click to watch →

A New Vowel Normalization for Sociophonetics - (3 minutes introduction)
373
A new vowel normalization method for sociophonetics replaces the mean with the centroid of the convex hull enclosing vowels and uses the standard deviation of convex hull points instead of all points, improving vowel space matching and overlap compared to traditional Lobanov normalization.
Click to watch →

Learning the Variability of Speech from Speech Production
230
Articulatory data collection employs three primary methods: X-ray microbeam photography (gold pellets on vocal tract points), Electromagnetic Articulography (EMA, electromagnetic sensors tracking pellet positions/velocities), and real-time MRI for simultaneous speech-production data. Absolute X&Y positions vary with speaker anatomy, so they must be converted to relative constriction measures using geometric transformations computing distances between articulatory points. This normalization creates speaker-independent features essential for cross-speaker analysis and practical speech recognition applications.
Click to watch →
Noções Básicas de Fonética Acústica: parte 1
835
This section explains individual variation in vowel formants and the need for normalization. The instructor explains that different speakers have different absolute formant frequencies because they have different vocal tract sizes, with women and children typically having higher formant frequencies than men because their vocal tracts are smaller. To compare vowel formants across different speakers, researchers normalize the formant frequencies by subtracting each speaker's mean F1 and F2 values and dividing by the standard deviation. This creates a normalized space where each speaker's vowel system is centered at (0,0), removing the effects of individual vocal tract size. The section explains perceptual normalization in speech perception: listeners do not use absolute formant frequencies to identify vowels; instead, they use the relative relationships between vowels within a speaker's system. The brain learns the typical vowel system of each speaker and identifies vowels based on their position relative to other vowels in that speaker's system.
Click to watch →

Алексей Лобанов профессионал во всем.
85K
Alexey Lobanov (1978-2020) was a talented Russian theater actor who spent 20 years at the Irkutsk Academic Drama Theater, creating diverse and nuanced roles by finding the unique atmosphere and psychological depth of each character; he was remembered by colleagues as a professional, sensitive, and soulful artist who tragically died at age 41 in 2000 while fishing on Lake Baikal.
Click to watch →
Deep Dive
Visualizing vowel spaces (plotting F1 vs. F2) using statistical software like R, Python, or specialized phonetic tools.
Lingstats - Homework #3
120
This section covers creating vowel space plots in R by plotting F2 on the x-axis and F1 on the y-axis with reversed axes. Students learn to distinguish male and female vowel patterns, where males cluster lower due to longer vocal tracts. The process includes adding multiple groups to scatter plots using points() with different colors, creating legends, and understanding how vowel formant frequencies determine vowel identity. This foundational skill enables visual analysis of acoustic vowel data.
Click to watch →
The Vowel Space
222.2K
Vowels exist in a continuous acoustic space rather than as discrete categories, similar to how colors exist in a continuous spectrum; this vowel space is defined by formant frequencies (F1 and F2) which correspond to the resonating cavities in the vocal tract, with the three corner vowels representing maximally distinct mouth shapes (spread open and rounded), and modern technology allows for objective measurement and synthesis of vowels by measuring these formant frequencies rather than relying on subjective articulatory descriptions.
Click to watch →
Speech Acoustics 5 - vowel formants
57.6K
Plotting F1 and F2 values on a coordinate system reveals systematic vowel patterns. After flipping both axes vertically and horizontally, back vowels cluster on one side while front vowels occupy the opposite region, mirroring traditional vowel chart layouts. The horizontal axis represents F1 (corresponding to vowel height/tongue elevation), while the vertical axis represents F2 (corresponding to vowel advancement/tongue position). This visualization demonstrates that vowel charts reflect actual acoustic measurements rather than arbitrary conventions. The systematic arrangement of vowels in this space provides an objective, quantifiable representation of vowel quality based on physical properties of the vocal tract.
Click to watch →

Phonetics - Vowels: Crash Course Linguistics #9
263.2K
The vowel space is represented visually as a trapezoid because the jaw moves like a hinge, creating more space at the front and top than at the back and bottom. This two-dimensional representation allows linguists to plot all possible vowel sounds based on their tongue height and frontness/backness features. Since the vowel space is continuous, this diagram shows how different vowel qualities relate to each other in a systematic way.
Click to watch →
Ling 441 - Advanced Phonetics - Perturbation Theory, part 1
1.6K
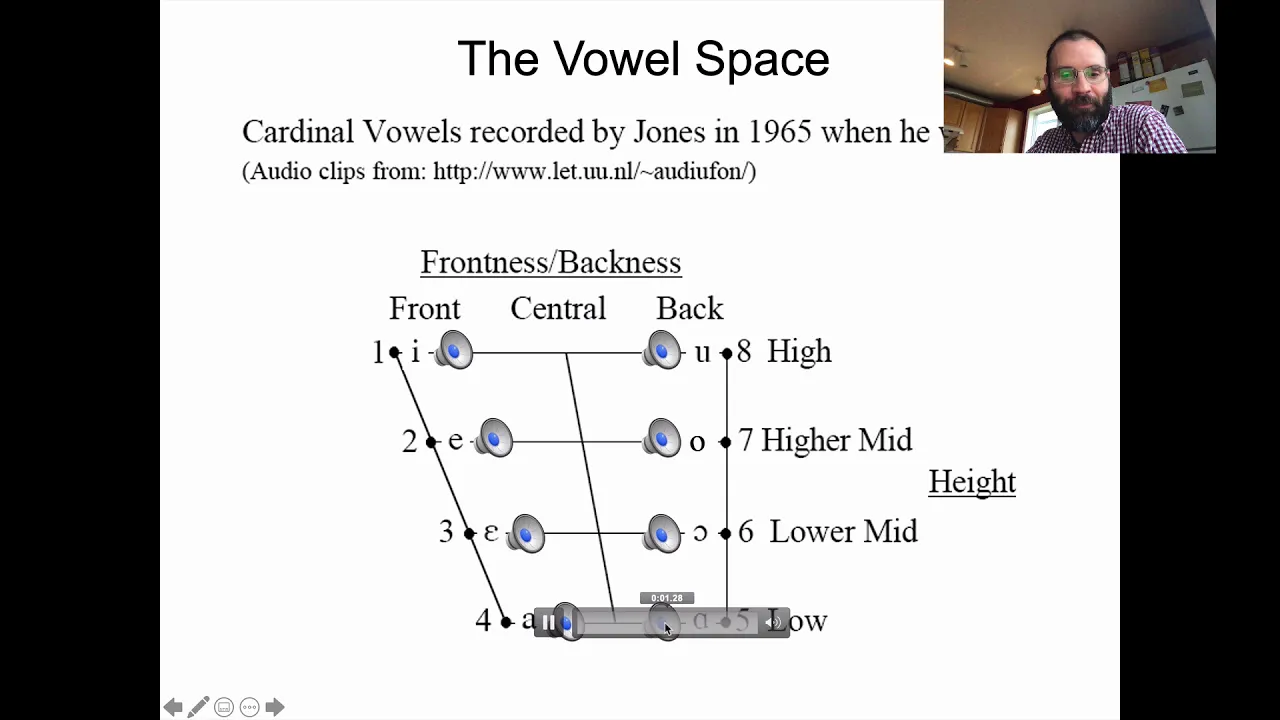
Vowels are primarily distinguished by their first two formant frequencies (F1 and F2). F1 corresponds to vowel height—lower F1 indicates higher vowels, while higher F1 indicates lower vowels. F2 corresponds to front-back position—higher F2 indicates front vowels, lower F2 indicates back vowels. This creates an inverted coordinate system where high vowels plot at the top (low F1) and front vowels plot at the right (high F2). For a typical speaker with ~17.5 cm vocal tract length, schwa has F1 ≈ 500 Hz and F2 ≈ 1500 Hz, serving as a central reference point. This mapping allows prediction of vowel quality from formant measurements and vice versa.
Click to watch →
Deep Dive
Analyzing dynamic formant trajectories (such as measuring diphthongs or coarticulation effects over time rather than at a single static point).

Praat formant measurement
32.7K
When measuring formants for monopthongs (vowels that don't change with time position), you should not measure at the start or end of the vowel because these areas are affected by co-articulation effects. The initial consonant (like the 't' sound) affects the beginning of the vowel, and any following word affects the end. Instead, measure in the middle section where the formants are steady and appear as horizontal lines on the spectrogram.
Click to watch →
Noções Básicas de Fonética Acústica: parte 1
835
This section demonstrates how to extract spectral slices from spectrograms to measure formant frequencies and explains coarticulation effects. The instructor shows how to use the spectral slice function in Praat to extract the spectrum at a specific point in time, explaining that this is useful for obtaining precise formant measurements. The instructor demonstrates extracting the spectrum from the middle of a vowel to avoid coarticulatory effects from neighboring sounds, explaining that coarticulation refers to the influence of neighboring sounds on the articulation of a sound. The instructor explains that consonants affect the formant frequencies of adjacent vowels, and that when measuring vowel formants, it is important to sample from the middle of the vowel to minimize coarticulatory effects. The section also discusses how different speakers have different absolute formant frequencies because they have different vocal tract sizes, with women and children typically having higher formant frequencies than men.
Click to watch →

Reconsidering commonly used stimuli in speech perception experiments
920
Vowels are not static in time and cannot be thoroughly described by spectral measurements taken at a single point. Even though vowel charts appear to show static formant positions, vowel dynamics are especially important in English and form an entire research area. Researchers can create vowel charts with static formant positions, but tracking the movement of those formants over time provides a clearer picture of vowel distinctions and helps distinguish between dialects.
Click to watch →

БИГФУТ - МИСТЕРИОЗНОТО ЧУДОВИЩЕ (1975)
517
A formant track is a newer and better way to do voice print analysis on a computer. It looks at the movement of frequencies and can say something about the articulatory flexibility during the sound recording. The analysis showed that the creature did not have the ability to make the 'e' sound, which requires moving the tongue forward in the mouth. Since gorillas have their neck at a different angle and cannot move their tongue forward to make the 'e' sound, this suggests the creature was more man than ape.
Click to watch →

What if English actually SOUNDED like this??
241.1K
The FACE diphthong in Received Pronunciation does not move in a close front direction at all, according to Gimson's chart. It starts just below cardinal vowel 2 (which sounds like the DRESS vowel) and then the tongue raises and retracts, moving from e to ɪ (eɪ). This trajectory is quite strange compared to what one might expect for a front vowel diphthong. This demonstrates how diphthong trajectories can vary significantly across languages and accents.
Click to watch →
Vowel Analysis through Formants
Measuring Formant Values
Vowel Analysis through Formants
0:04- 1
Explains how to identify vowels using spectrogram formants.
- 2
High vowels show lower F1; front vowels show higher F2.
- 3
F3 used for speech contrast discrimination when needed.
Limitations of Static F1/F2 Tracking and the Whole-Spectrum Alternative
While measuring static F1 and F2 at a single time point (typically the vowel midpoint) is the traditional standard in acoustic phonetics, this approach has significant limitations. First, LPC-based formant tracking in Praat is notoriously prone to errors in high-pitched voices (such as children's or high female voices), nasalized vowels, and creaky voice, where the algorithm often merges or misidentifies formants. Second, static measurements ignore 'Vowel Inherent Spectral Change' (VISC)—the dynamic trajectory of a vowel over time—which perceptual studies show is crucial for human vowel identification. Critics and modern phoneticians advocate for alternative methods, such as whole-spectrum analysis (using Mel-Frequency Cepstral Coefficients or spectral moments) and dynamic trajectory tracking. These alternative frameworks argue that vowel identity is encoded in the continuous, global spectral shape of the acoustic signal rather than isolated, static formant frequencies.
Basic concepts of acoustic phonetics, particularly the source-filter theory of speech production.
An understanding of what formants are and how they relate to vocal tract resonance and vowel quality (e.g., how tongue height and advancement affect F1 and F2).
Familiarity with the Praat user interface, including how to open audio files and navigate the Sound editor window.
How to read a basic spectrogram, including the representation of time, frequency, and amplitude/intensity.
Scripting in Praat to automate formant extraction and analysis for large acoustic datasets.
Vowel normalization methods (such as Lobanov or Nearey) to control for anatomical differences among speakers.
Visualizing vowel spaces (plotting F1 vs. F2) using statistical software like R, Python, or specialized phonetic tools.
Analyzing dynamic formant trajectories (such as measuring diphthongs or coarticulation effects over time rather than at a single static point).
44.5K views486likes3:11@linguistiklaboralbert-ludw3514Original Release: 2019-05-04
for this example we're going to measure the height front vowel e Pratt measures vowels through the information found in the shades of the spectrogram of a vowel sound the gray shades show us the intensity of the resonance frequencies in the sound wave which are called formant be we can identify a vowel by the periodic waves of voicing found in the wave form in order to see the formants click on formants and then show formants we will now see a series of dotted lines in the spectrogram the first dotted line represents the first formant its position is inversely related to vowel height since this is a high vowel the value of the first formant is lower ii dotted line represents the second formant its value is directly related to the degree of prominence or badness of the vowel since this is a front vowel the value of the second formant is higher we normally only need the values of f1 and f2 to measure vowels f3 is normally useful in the discrimination or identification of speech contrasts depending on the quality of our sample we might need to modify the settings so that we can find the clear dotted lines of each formant to measure the formant we want to click on the center of the duration of the vowel however for this example we will try to pick a spot where the formants are stable and flat for a while to see the value of each formant we click on format and then format listing Pratt will display a pop-up window with the information of the time of the spot we selected as well as the values of each formant we can also modify the settings of the spectrogram to obtain a clearer view of each formant
Up Next

21:16
Speech Acoustics: Acoustic Signatures of Consonants (Phonetics)
@listenlab_umn
33.5K views•2020-10-26
36:52
Constraint Interaction in Optimality Theory: Epenthesis & Deletion
@Vidyamitra
180 views•2018-08-20

8:59
Forensic Linguistics: How Language Solves Crimes | PBS
@pbsstoried
1M views•2024-01-25

21:32
Accent Expert Explains U.S. Regional Dialects | Part 1
@WIRED
9.3M views•2021-01-21
Related Study Plans & Knowledge Roadmaps
Structured learning paths in Linguistics
linguistics
Optimality Theory: Tableaux & Constraints
01Phonological Basics: Sounds, Syllables & Rules
02Foundations of Optimality Theory: GEN, CON, and EVAL
03The Constraint Inventory: Markedness vs. Faithfulness
+ 2 more learning modules
15h5 modules
Explore Roadmap
linguistics
Morphosyntactic Alignment: S, A & P Systems
01Foundations of Syntax: Transitivity and Arguments
02The Linguistic Variables: Mapping S, A, and P
03Nominative-Accusative Alignment
+ 3 more learning modules
12h6 modules
Explore Roadmap
linguistics
Analyzing Sign Language: Phonology & Syntax
01Foundations of Sign Language Linguistics
02Phonology: The Five Parameters of a Sign
03Morphology: Word Formation and Classifiers
+ 2 more learning modules
14h5 modules
Explore Roadmap
linguistics
Pragmatics: Speech Acts, Grice & Politeness
01Introduction to Pragmatics: Meaning in Context
02Grice’s Cooperative Principle & Implicature
03Speech Act Theory
+ 2 more learning modules
14h5 modules
Explore Roadmap