![Phonetics: Intro to linguistics [Video 2]](https://i.ytimg.com/vi_webp/GLBsvdaR_ow/maxresdefault.webp)







![하현우 보컬 순수 물리학적 분석[Physics of voice]](https://i.ytimg.com/vi/SbkkYFosJuw/maxresdefault.jpg)

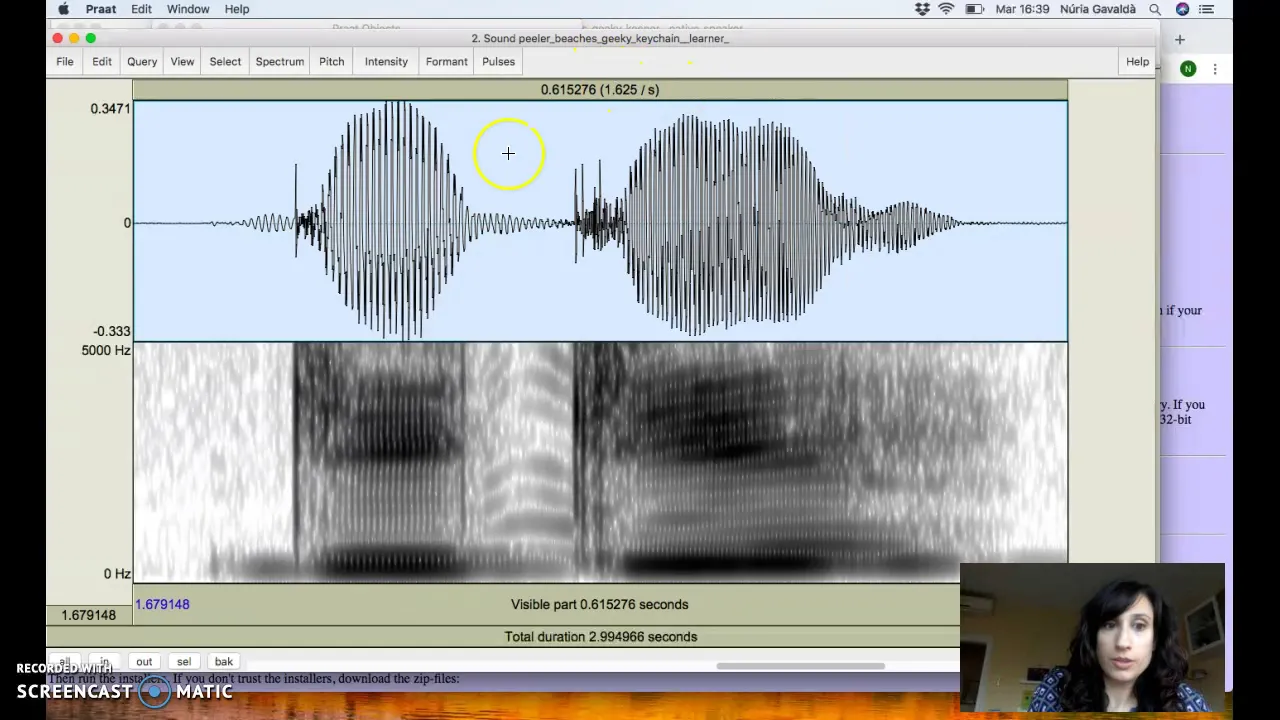


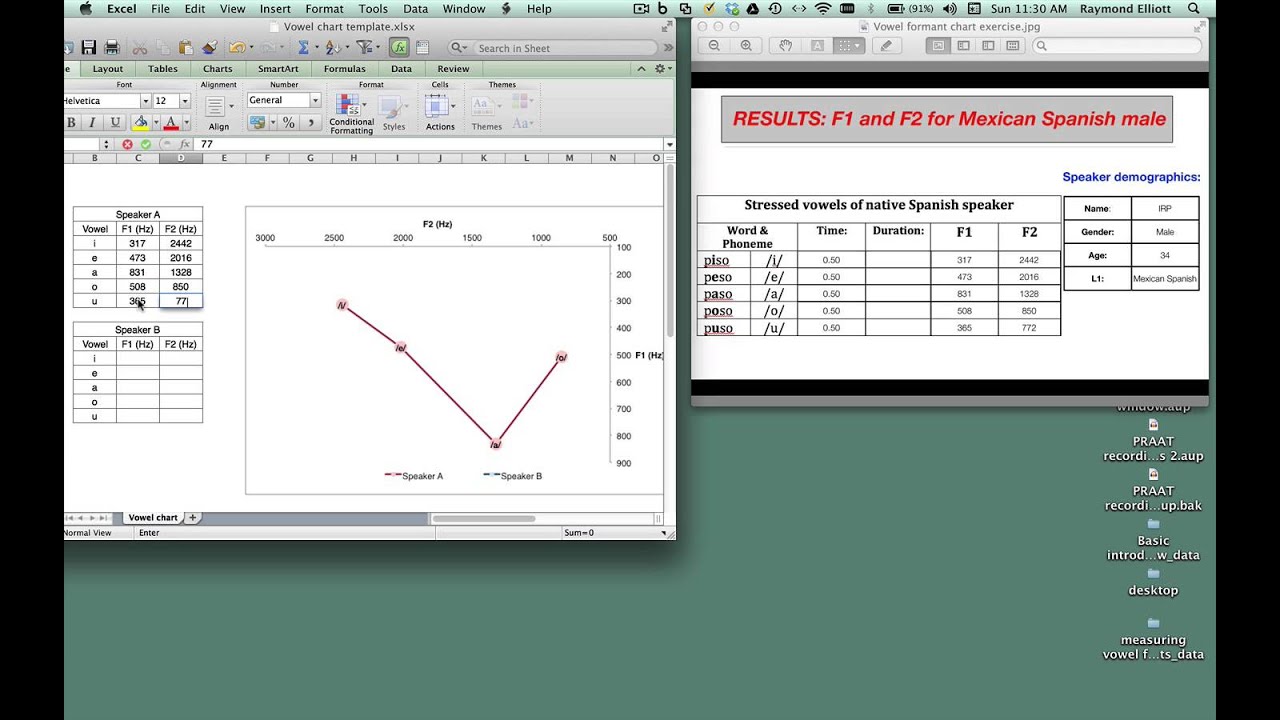
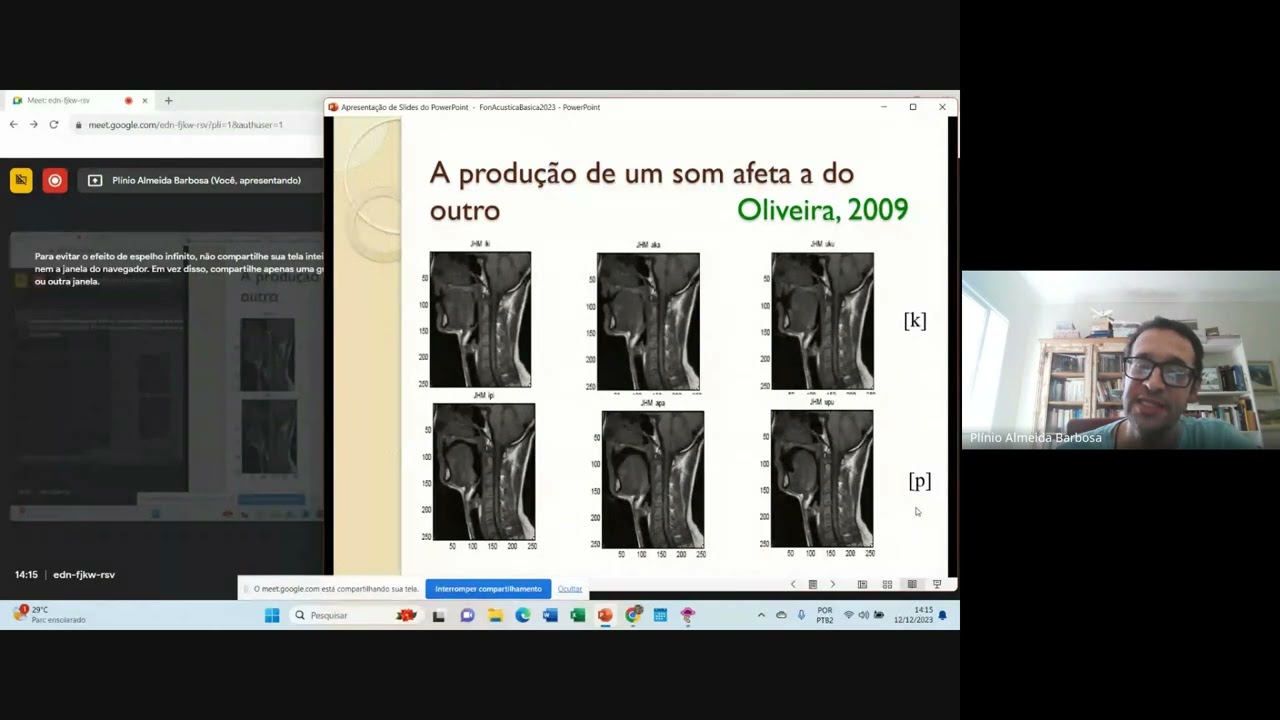





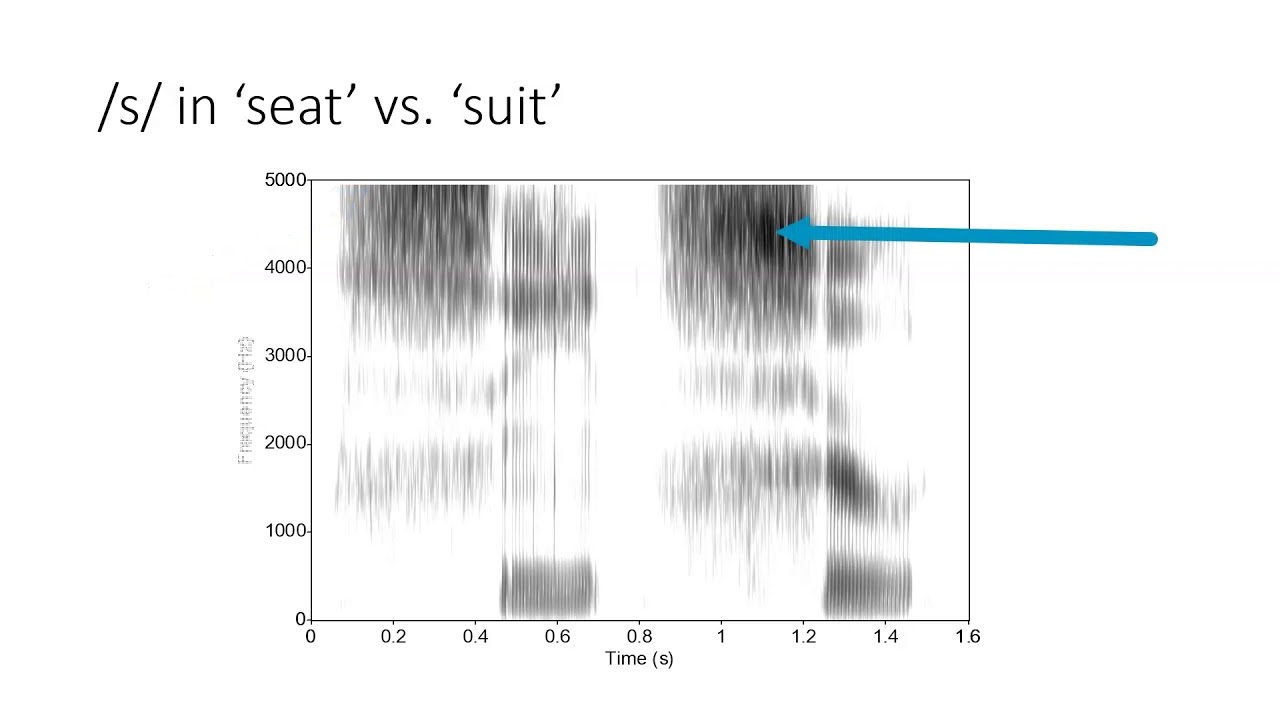
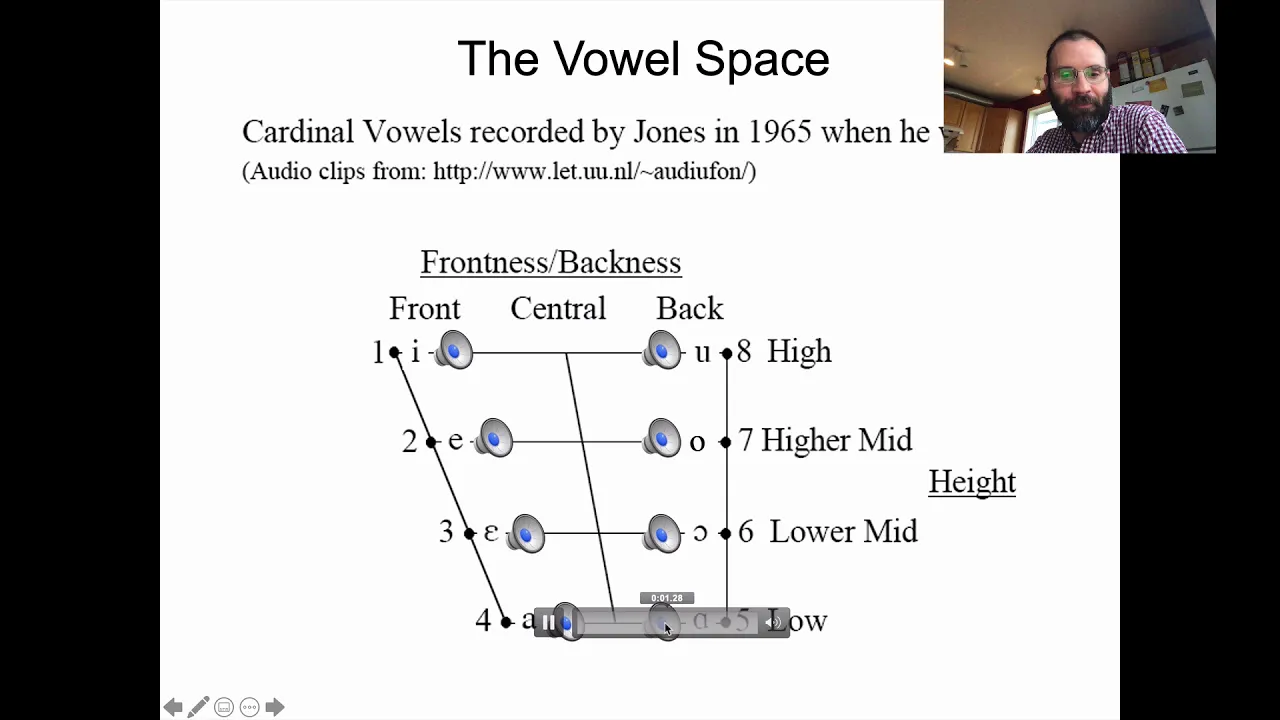
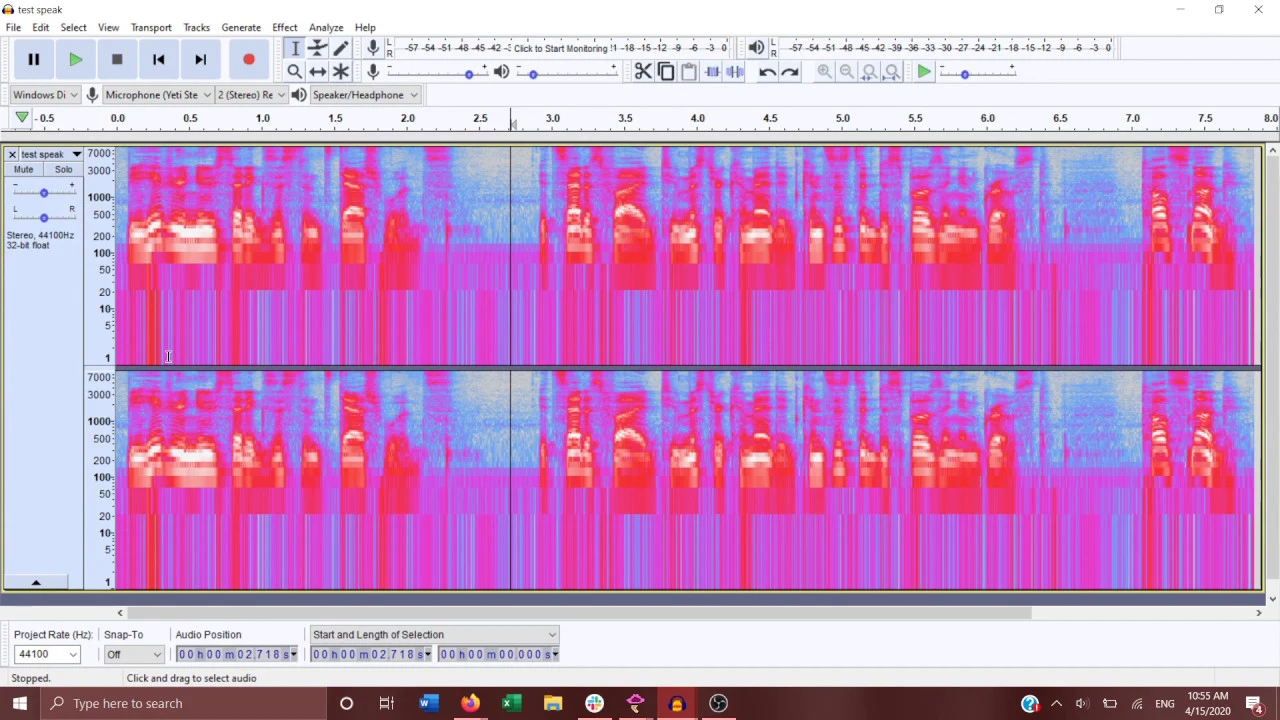
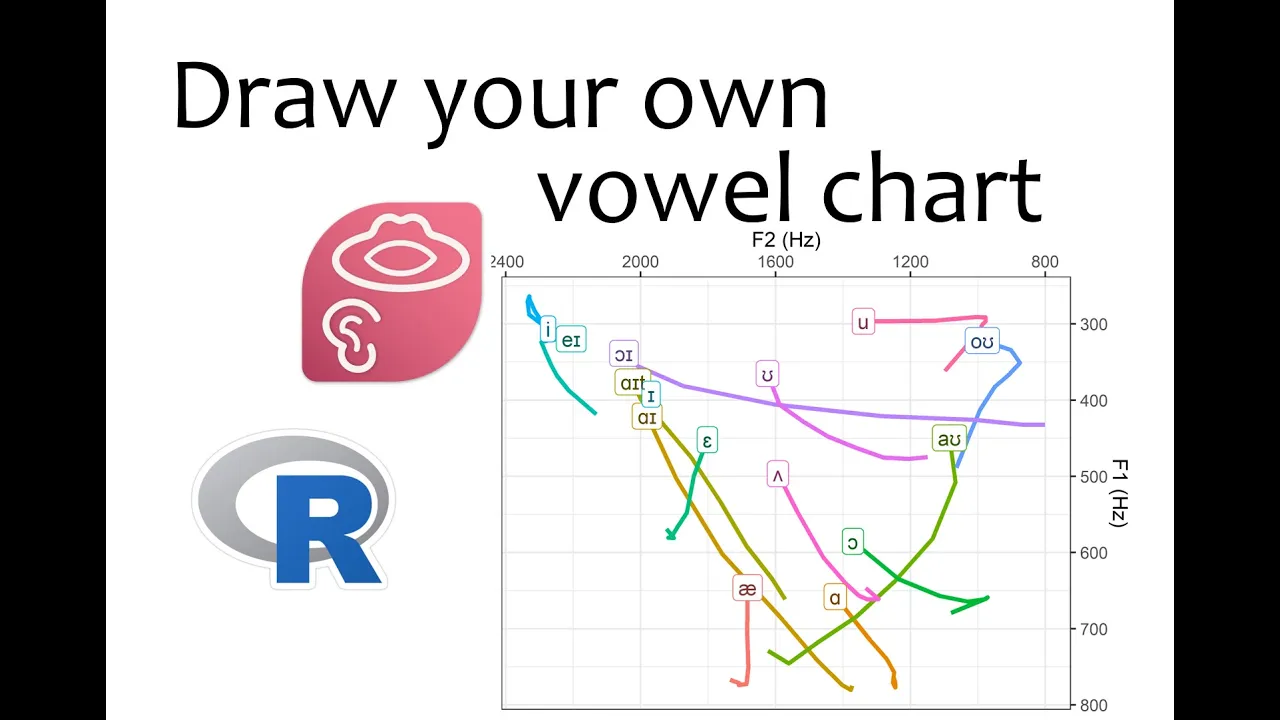

A spectrogram is a visual representation of sound that displays time on the horizontal axis, frequency on the vertical axis, and amplitude through shading, enabling analysis of vowel quality by measuring formant frequencies (F1 and F2) which correspond to tongue position and vowel height/frontness; Praat software allows users to record speech, generate spectrograms, and measure formant values to objectively analyze vowel articulation.
Spectrogram Analysis and Vowel Formants in Praat Tutorial
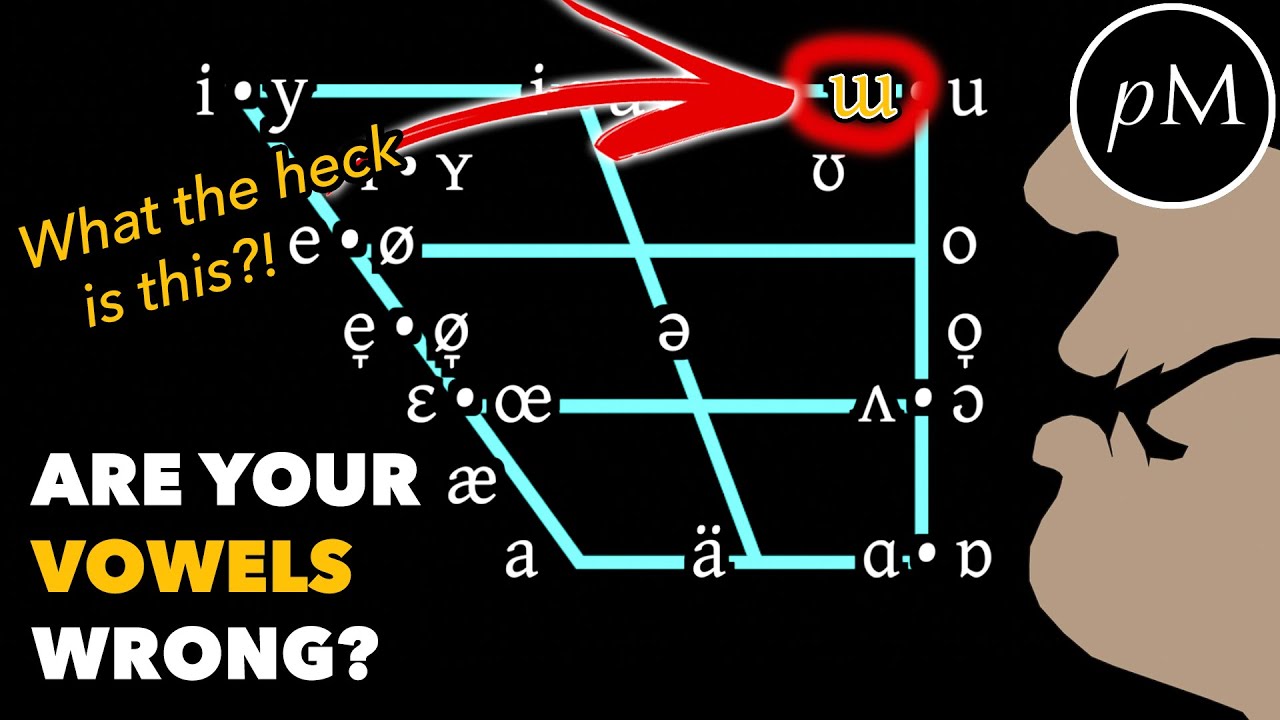
Added:Understanding of basic articulatory phonetics, specifically how tongue position (height and backness) and lip rounding shape different vowel sounds.
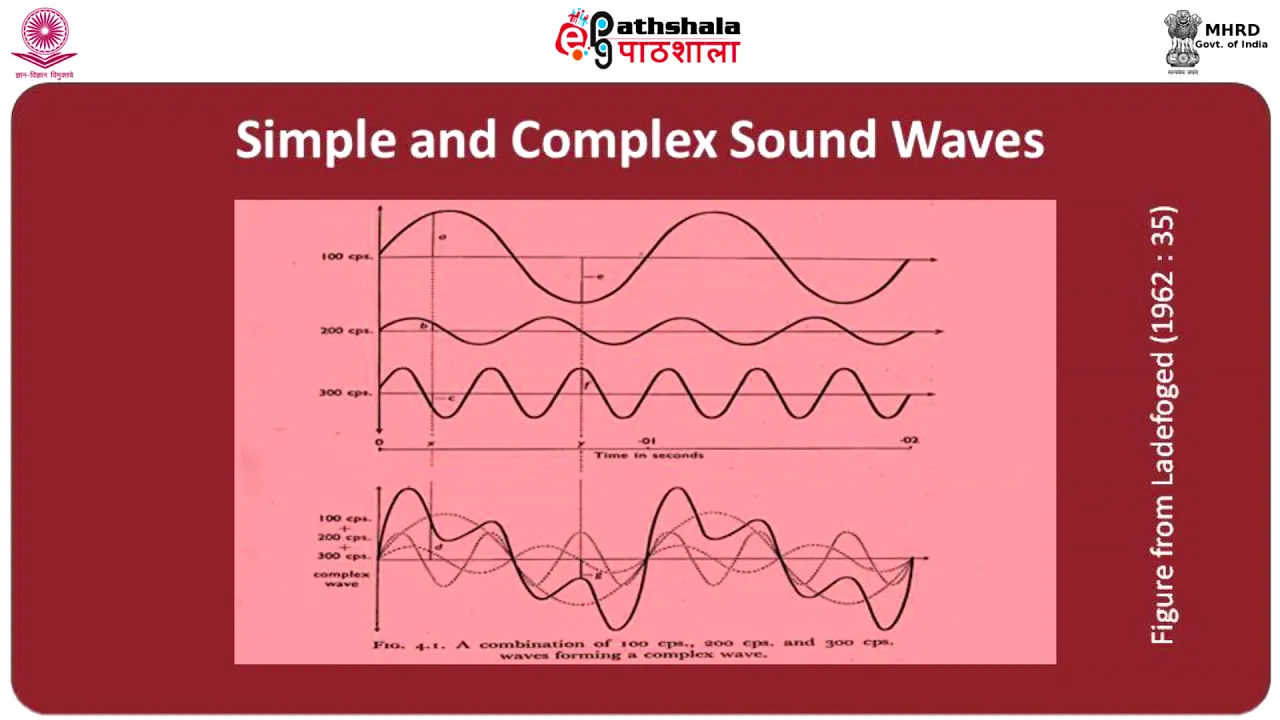
Fundamental concepts of acoustic phonetics, including sound waves, frequency (measured in Hz), amplitude, and the difference between periodic and aperiodic sounds.
A conceptual definition of 'formants' as the acoustic resonances of the vocal tract, and their general relationship to vocal tract shape.
Basic familiarity with the Praat software user interface, including how to open audio files and display a basic waveform.
Vowel space plotting and normalization techniques (e.g., Lobanov or Nearey methods) using tools like R or Excel to compare vowel systems across different speakers.
Advanced Praat scripting to automate the extraction of F1 and F2 frequencies across large speech corpora.
Analyzing formant transitions to study coarticulation and the acoustic cues of neighboring consonants.
Applying vowel formant analysis to practical fields such as sociolinguistic dialectology (e.g., mapping vowel shifts) or clinical speech-language pathology.
237.2K views2.3Klikes11:20Original Release: 2011-12-08
hi I'm Charles J pinc in this video I'll show you what a spectrogram is and how you can use it to analyze vowels I'll also teach you some rudimentary skills for working in prot a free and open- Source program for phonetic analysis if you've never heard of a spectrogram before it's a visual representation of sound or any signal it displays the amplitude of the frequency components of the signal over time you may already be familiar with another visual representation of sound known as the waveform which appears on the left side of this slide a waveform shows variations in air pressure over time this waveform was made from a synthesized recording of a pure tone at 200 htz for 10 seconds this is a window of the waveform for the first 100 milliseconds and you can count that there are 20 cycles of the period in the 100 millisecond window hence 200 Hertz the spectrogram of this same recording which appears on the right is Created from a mathematical algorithm called a fast forer transform or fft this algorithm takes the signal and decomposes it into its frequency components a spectrogram displays time on the horizontal X AIS and frequency on the vertical y AIS the spectrogram on the right of the slide is windowed from 0 Hertz up to 1,000 Hertz we see a solid black line at the 200 htz Point indicating that the signal consists of a 200 htz component as we saw in the waveform spectrograms also show changes in frequency values of the components of a signal over time here's a spectrogram of a 3second frequency Glide from 400 HZ to 800 HZ which sounds like this the spectrogram reflects the change in frequency in the signal spectrograms are especially useful with complex signals those that contain more than one frequency component here we see the waveform and spectrogram of a signal composed of a 200 HZ sine wave and a 400 HZ sine wave combined those components cannot be discerned from a visual examination of the waveform but they are obvious when we look at the spectrogram this spectrogram like the one in the previous slide extends from 0 Herz to 1,000 Hertz on the vertical axis and we see solid black lines at 200 HZ and 400 HZ in many cases especially speech the components that make up a complex signal do not share the same amplitude value for our purposes amplitude refers to the loudness of the components differences in amplitude are shown on a spectrogram by shading that is the frequency components with the highest amplitude values are shown in dark black components with lower amplitude values are displayed in lighter Shades of Gray up to white with white signifying very low amplitude or silence in this way a spectrogram is three-dimensional it shows time on the horizontal axis frequency on the vertical axis and amplitude by shading there are several software products that will display spectrograms to your computer monitor but one of the most versatile programs is prot prot is free and open-source software designed for phonetic analysis you can download it for Windows Mac or Linux operating systems at the website on this slide prot can create spectrograms by loading audio files on your computer or you can record directly through Pro if you have a microphone you see a waveform and spectrogram when you click on The View and edit button I'll walk you through a few features with Pro these are screenshots of version 5.3 of pro on Windows 7 the graphical interface may look slightly different on other prot versions and operating systems but there should be enough similarity to follow along here when you open prot you'll see two windows the one on the right is for printing images you create impr for example you can save waveforms and spectrograms to EPS files to include in papers but if you're not going to save any images you can close this window the left window is your prot control panel it contains a list of all the recordings you're working with which is empty now let's create a recording of two English vows if you have an external microphone it needs to be plugged in before you open prot so that prot knows it's connected go to new record mono sound the default sampling rate is 44,000 100 Hertz in a moment you can practice using Pro by recording yourself saying the English vowels a as in rock and e as in C you will press record to start the recording and stop when you're done say the two vows with a short pause in between like this a e make your recording now then give it a name and click save to list and close to view the waveform and spectrogram of the recording you just made make sure it's selected and click View and edit the spectogram should look something like this if you don't see the red dots that's good if your spectogram does have these red dots you can toggle them off by going to forat show formats if your spectrogram doesn't resemble this at all you may have to restore the default settings in Pro by going to Spectrum spectrogram settings standards okay let's take a closer look at the spectrogram of these two vows unlike the previous examples we saw of spectrograms with only one or two frequency components vows have energy at many frequencies be aware that these spectrograms extend from 0 to 5,000 Herz whereas the examples we saw before only reached 1,000 HZ but the same concept ceps apply that is time on the horizontal axis frequency on the vertical axis and amplitude by the degree of shading notice the dark black bands at certain frequencies of these vows the frequencies at which they occur in the a vow are different from those in the E vow these concentrations of acoustic energy in vows are called forments or natural resonances the shape of the vocal tract that is the position of the affects the frequencies at which formants occur so since A and E are articulated with the tongue in different positions the forant frequencies are different as well the lowest two formants known as F1 and F2 show the greatest variation based on tongue position let's measure fub1 and F2 of A and E there are two common ways of doing this in Pro one way is to click on one of the formats and pro draws a horizontal line at the location of the cursor and marks the frequency you can do this for F1 and F2 of both fs and write down the frequencies Pro displays alternatively you can turn on the forat tracker in Pro and ask Pro to measure the format values for you go to format show formants highlight a portion of the Val you want to measure and go to formant get first formant a window pops up within Pro with the value for F1 this is more accurate than the previous method you can save time by highlighting The Vow and pressing the F1 key on the top row of your keyboard and prot tells you the value of F1 without having to click through the form menu similarly you can get the value of F2 by highlighting the part of the Val and pressing the F2 button on your keyboard now let's do a practice exercise that will show us an interesting feature of F1 and F2 values record yourself saying several different English vows then measure the frequency values of F1 and F2 for each vow and write them down on a piece of paper paper after you've measured several valves draw the axes for a scatter plot as you see them on the screen with the horizontal axis at the top spanning from 500 htz to about 2500 htz and the vertical axis on the right from 0 Herz to 800 H Herz notice that the values on the axes increase as they depart from the upper right corner now plot the valves from your recordings according to their F1 and F2 values use the vertical axis for F1 and the horizontal axis for F2 for example according to hillenbrand at all 1995 The Vow U produced by an average male American English speaker has an F1 value of 378 Hertz and an F2 value of 997 Herz so we'll plot it here the form values of your vs will show some variation based on your dialect as you plot more vales you'll start to notice a trend by plotting the valves by their F1 and F2 values they start to resemble the valve quadrilateral as it appears in the chart of the International Phonetic Alphabet more specifically F1 indicates the height of the vowels with greater F1 value signifying lower or more open articulations and F2 indicates the frontness of the V where greater F2 two values mean articulations closer to the lips these qualities of the first and second formance of vowels have many applications for example you can measure the F1 and F2 of a vow that you don't recognize from a foreign language and determine the tongue position of its articulation you can also measure the formance of vowels you produce from a second language and compare them to format measurements of native speakers articulations to see how your Productions match up and practice different tongue configurations until you come close to Native articulations F1 and F2 measurements are commonly used in phonetics and phonological research as an objective measurement of Val quality if you'd like to know more about spectrograms and Val forance here are some good resources that are accessible to beginner and advanced Scholars alike
Up Next
72:30
Your Voice Speaks Volumes: The Science of Speech and Accent Prejudice
@Abralin
2K views•2020-05-24
36:52
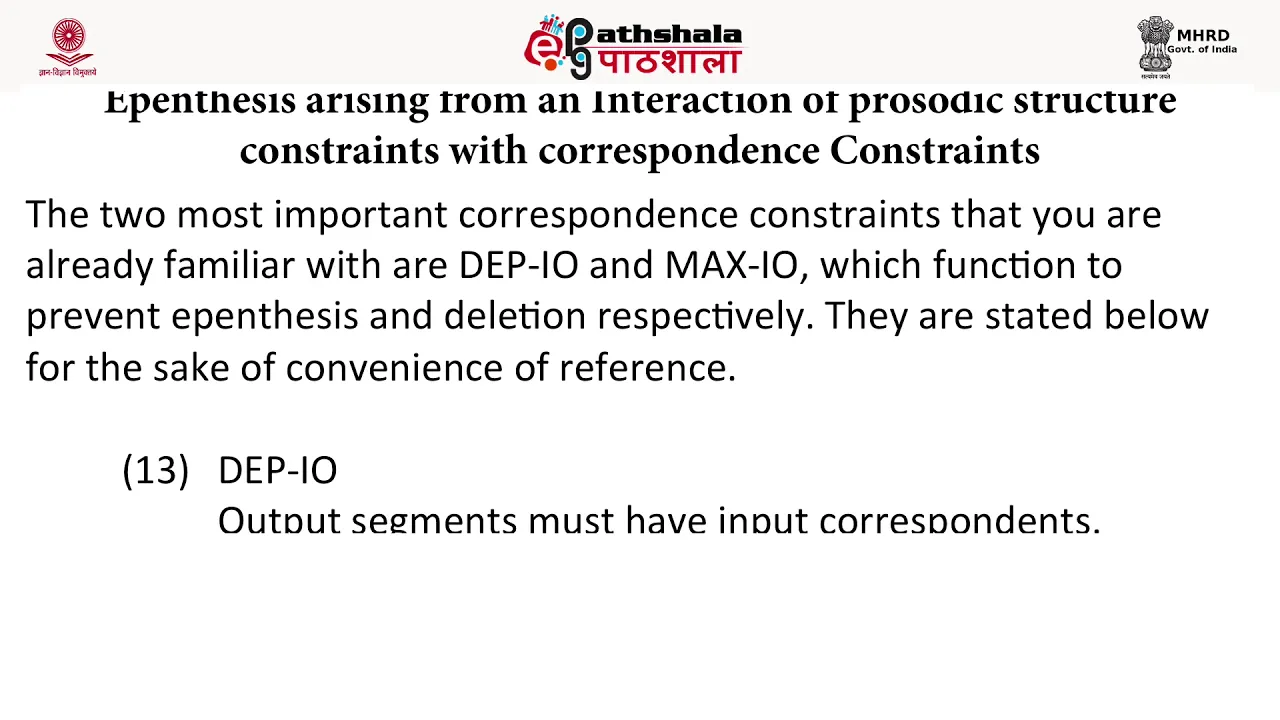
Constraint Interaction in Optimality Theory: Epenthesis & Deletion
@Vidyamitra
180 views•2018-08-20

8:59
Forensic Linguistics: How Language Solves Crimes | PBS
@pbsstoried
1M views•2024-01-25

21:32
Accent Expert Explains U.S. Regional Dialects | Part 1
@WIRED
9.3M views•2021-01-21
Related Study Plans & Knowledge Roadmaps
Structured learning paths in Linguistics
linguistics
Optimality Theory: Tableaux & Constraints
01Phonological Basics: Sounds, Syllables & Rules
02Foundations of Optimality Theory: GEN, CON, and EVAL
03The Constraint Inventory: Markedness vs. Faithfulness
+ 2 more learning modules
15h5 modules
Explore Roadmap
linguistics
Morphosyntactic Alignment: S, A & P Systems
01Foundations of Syntax: Transitivity and Arguments
02The Linguistic Variables: Mapping S, A, and P
03Nominative-Accusative Alignment
+ 3 more learning modules
12h6 modules
Explore Roadmap
linguistics
Analyzing Sign Language: Phonology & Syntax
01Foundations of Sign Language Linguistics
02Phonology: The Five Parameters of a Sign
03Morphology: Word Formation and Classifiers
+ 2 more learning modules
14h5 modules
Explore Roadmap
linguistics
Pragmatics: Speech Acts, Grice & Politeness
01Introduction to Pragmatics: Meaning in Context
02Grice’s Cooperative Principle & Implicature
03Speech Act Theory
+ 2 more learning modules
14h5 modules
Explore Roadmap