


![[Introduction to Linguistics] Phonetics and Basics of Transcription](https://i.ytimg.com/vi/-FHQJEo38Vk/maxresdefault.jpg)








![[EE126] - 01 - VA - Introdução aos Sinais e Sistemas](https://i.ytimg.com/vi/ymfSfAzvpgs/hqdefault.jpg)





![[토크ON세미나] 딥러닝 기반 음성합성(1) 2강 - 음성 모델링 II - Speech Production (Source-Filter Model) | T아카데미](https://i.ytimg.com/vi/oYopmaJ_2nw/sddefault.jpg)
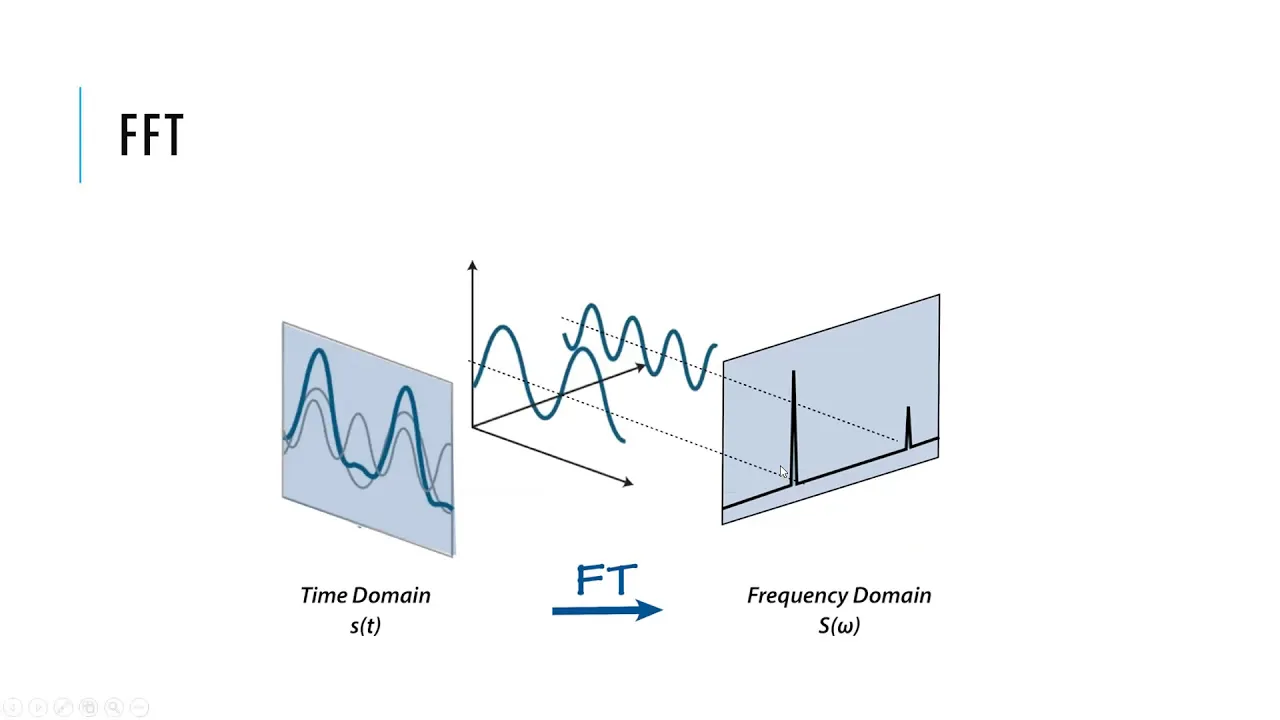

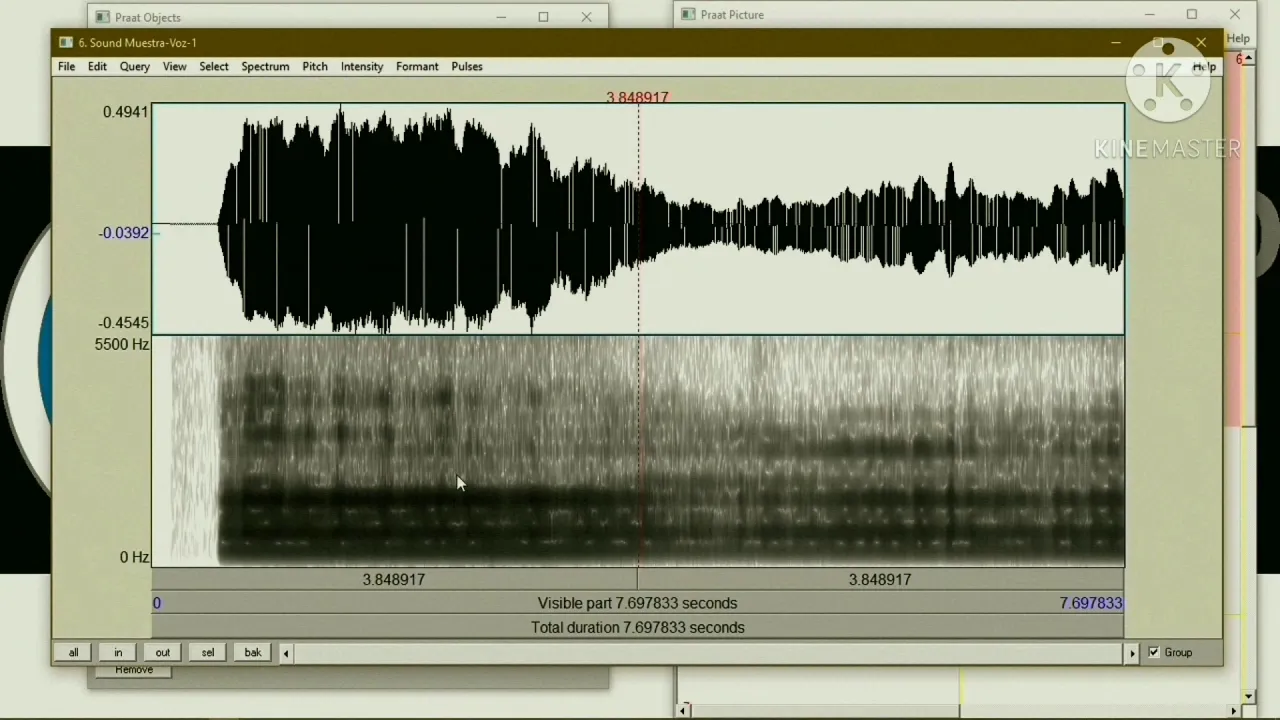




Acoustic phonetics uses three main visualization tools—waveform views showing amplitude over time, frequency spectra displaying frequency-amplitude relationships at single time points, and spectrograms (the most important tool) showing spectral data over time with amplitude represented by darkness or color. Spectrograms reveal vowel formant structures (F1 and F2 frequencies associated with vocal tract cavity sizes), consonant characteristics including voicing, friction noise, and closures, and transitions between sounds. Vowels are classified by their first two formants, with F1 corresponding to pharyngeal cavity size and F2 to front oral cavity size, allowing construction of an acoustic vowel chart that mirrors the articulatory vowel chart but differs in methodology.
Speech Analysis: Sound Waves, Spectrograms & Formants
Added:hello again in the following I will introduce you to the analysis of sound waves in fact there are several ways of presenting Soundwave information there is for example The waveform View then we have the frequency spectrum and last but not least there's the spectrogram probably the most important display of Soundwave information for the analysis of linguistic sounds let us look at these ways of sound analysis in more detail the wave form view provides a general view of the Soundwave and displays the amplitude information over time here is the waveform for the short sound sample acoustic phonetics and as you can see we have various portions of silence for example small portions of Silence that signal some sort of closure during articulation so these typically occur before posive consonants then we have longer portions of Silence most obviously between words acoustic phonetics and we can see well visible portions of friction noise associated with fricatives such as the s in acoustic the F in phonetics and the final s again in phonetics and even voicing as complex periodic sound waves can be identified especially when you zoom into such a wave form okay so much for the waveform the frequency spectrum as shown here is a two-dimensional plot of the Soundwave at a point in time the horizontal axis shows the frequency the vertical axis the amplitude of each frequency line a frequency spectrum is highly detailed in its frequency information however it is only one snapshot of the linear sequence of acoustic information at a given time with modern visualization techniques frequency Spectra can be animated like this phonetics again phonetics or if I move the slider very slowly you can see what happens at a given point in time phonetics so with modern visualization techniques such frequency Spectra can be be animated and thus can display detailed temporal information the most important technique for the acoustic analysis of speech is however the spectrogram it displays the exact forance structure of speech sounds as shown here in the spectrogram that again displays the phrase acoustic phonetics acoustic phonetics the patterns we can see on the spectrogram enable us to differentiate vowels from one another and may help us to identify the character of an adjacent consonant before we look at the spectrographic information in detail however let us go back to the early days of acoustic phonetics because the availability of spectrographic information goes back to the 20th century and to using the spectrograph during the 1940s the sound spectrograph in its original version it was called K sonar graph well this sound spectrograph was designed to analyze and to display speech Spectra the machine recorded speech analyzed the sound waves into their frequencies by means of an array of electronic filters and then presented the result on a special electrosensitive paper the paper had to be placed around a drum so that a stylus could make its marks on it due to the size of the drum recordings were limited to only about 2 seconds but what am I telling you here is a short video we recorded in our department of phonetics about 10 years ago they still had a kaph then until recently spectrograms were produced using the k sonograph a device invented in the 1940s that analyzes a soundwave into its component frequencies and displays the frequency spectrum on paper with a sonograph spectrograms were generated according to the following Steps step one live recording of a sound of about 2 2 seconds step two calibration and monitoring of the recorded sound step three location of the onset of the recording on the drum step four placing of electrosensitive paper around the drum step five setting the filtering and drawing levels step six drawing the spectrogram the result of this procedure is a black and white presentation of the Soundwave with the relative intensity of each component frequency shown by the darkness of the mark well today this sound of spectrograph is obsolete since computer-based techniques allow the making of spectrograms in real time let us illustrate this here is an example I have a software here and will now record acoustic phonetics in real time and you can see the spectrogram being created Live Here We Go acoustic phonetics and here you can see the spectrogram acoustic phonetics but what does a spectrogram like the ones shown display well basically a spectrogram displays the spectral data over time with the amplitude shown in different colors or as shown here in different Shades of Gray in particular the horizontal axis displays the duration of a sound in seconds or milliseconds the the vertical axis shows the frequency values and most importantly we can identify the intensity of the various resonance frequencies the formance by means of the degree of Darkness or in terms of colored spectrograms by means of a particular predefined colored so let's mark a few aspects on this spectrogram before we go into a detailed analysis for example all vowels have a forant structure here we have the vowel e with F1 down here and a very high value for the second formant FS2 fub1 or we can identify portions of friction noise for example friction noise for the fricative sir we can identify closures here is a portion of closure before the posive C and so on and so forth so the spectrogram is the most common representation technique in acoustic phonetics since it contains almost all data necessary for the analysis and the acoustic description of speech allowing the relatively precise analysis of vows and consonants in terms of their acoustic in terms of their acoustic structure so let us look at vowels and consonants in detail and let's start with the vowels here are the spectrograms of four cardinal vowels which I produced earlier on I said e a a and u and this is what the spectrograms look like like all vowels these vowels can be classified by means of their first two forments forant one F1 and for 2 F2 these resonance frequencies can very roughly be associated with the size of specific cavities in the vocal tract F1 is always associated with the fenal cavity so let's mark F1 in yellow and let's associate F1 with the respective faral cavity size so here is the cavity for e a very large cavity and not surprisingly fub1 is relatively low for R well the cavity for a sorry for a the cavity is about here and well F1 is a little bit higher probably here for R we have an almost identical situation again this is the Fingal cavity and the value of of F1 again is a bit higher than the one of e but similar to the one of a and for U well the fenal cavity is relatively small so not surprisingly we have a very low value of fub1 again so these are my forant one values let's now look at the second formant which is normally associated with the front with the oral cavity so let's mark that using a different color for E we have a very small front cavity leading to a high frequency of F2 very high for a we have a relatively large cavity front cavity this part here leading to well a mediocre value for a something like here for o the cavity is quite similar perhaps a little bit lower than for a and for U well there we only have a very narrow cavity leading to a low frequency value for FS2 perhaps around here and again let's let's write down the F2 value so these are forant characteristics for the for Cardinal vowels let's now plot these frequencies on a specific acoustic chart where we plot the frequency of F1 on a vertical axis against the frequency of FS2 on the horizontal axis let's do it the frequency values the formant frequency values for E are something like 300 Herz for F1 and 2,600 Hertz for F2 so here is our Cardinal vowel e o by contrast has a very low F2 value only 900 Herz roughly but the F1 value is pretty similar so we have it over here in looking at a we find that a has about 700 Hertz for F1 well and roughly 1,200 1,300 Hertz for F2 well and Cardinal number four or is quite similar only the value for F2 is a little bit lower so we have this position well if we combine these four cardinal vows we get a picture like this does that ring a bell well it looks like the pattern of cardinal vows on the Cardinal vow chart take a look here you are this is the acoustic vowel chart this is the auditory vowel chart based on articulatory principles however the match is not exact because the articulatory chart is based on the point of greatest tongue constriction only whereas the acoustic chart takes its data from all vocal tract resonances okay let's now continue with consonants before we do that perhaps you should find out the values for the other Cardinal vows and you will see that they somehow match these lines so you would have e a here would have o and O so the acoustic vowel chart is quite similar to the Cardinal vowel chart with the differences however that I mentioned earlier on let's now take some consonants and look at their spectrograms here are are recorded some consonants in the environment of cardinal 1 EC e She e and well and consonants however cannot be classified on the basis of a well-defined formant pattern here we have to take into account voicing noise frequencies for and Transitions and portions of Silence let us look at our consonants here well for the two trick atives for example we can identify clear-cut portions of noise for the sir the noise frequency is pretty high between 3,500 Herz for sure it's a bit lower so it goes down from 500 to about 2,000 or 1,500 Hertz and this is a remarkable difference between these two consonants the frequency of friction noise plosives typically involve a portion of Silence especially when they occur between vowels such as e key and this portion of Silence of course is associated with the closure that we create in the vocal tract and then in the case of voiceless plosives they also involve friction noise for the little puff of air that is released when we open the closure and which we call aspiration in articulatory phonetics the two consonants ir and IM are different because they are voiced and so first of all voicing continues so these portions down here denote the fact that the vocal cords continue to vibrate I is quite interesting because here you can see typically the closures and openings in terms of well very short spikes that occur in the spectrogram nasal continent by contrast have some sort of forant pattern the forant pattern however is not steady state it is associated with the place of articulation for E the closure between the lips creates a sort of transition of F2 down and up again whereas fub1 remains well relatively stable so nasals have some sort of formant pattern which takes up the formant of the surrounding vowels okay that should be enough in this e-lecture as a result of what I told you you should now have some basic understanding about the analysis of acoustic data using modern sound analysis tools and in particular you should understand the analysis of spectrographic information you may find this very difficult at the beginning but in our spectrogram analysis videos that are either freely available in our YouTube channel or that are associated with the virtual sessions of our classes on the virtual Linguistics campus you can familiarize yourselves with this technique of acoustic phonetic analysis that's it for now thanks for your attention
Up Next

Did Shakespeare Write His Plays? Stylometry Explained
@TEDEd
1.1M views•2015-02-24
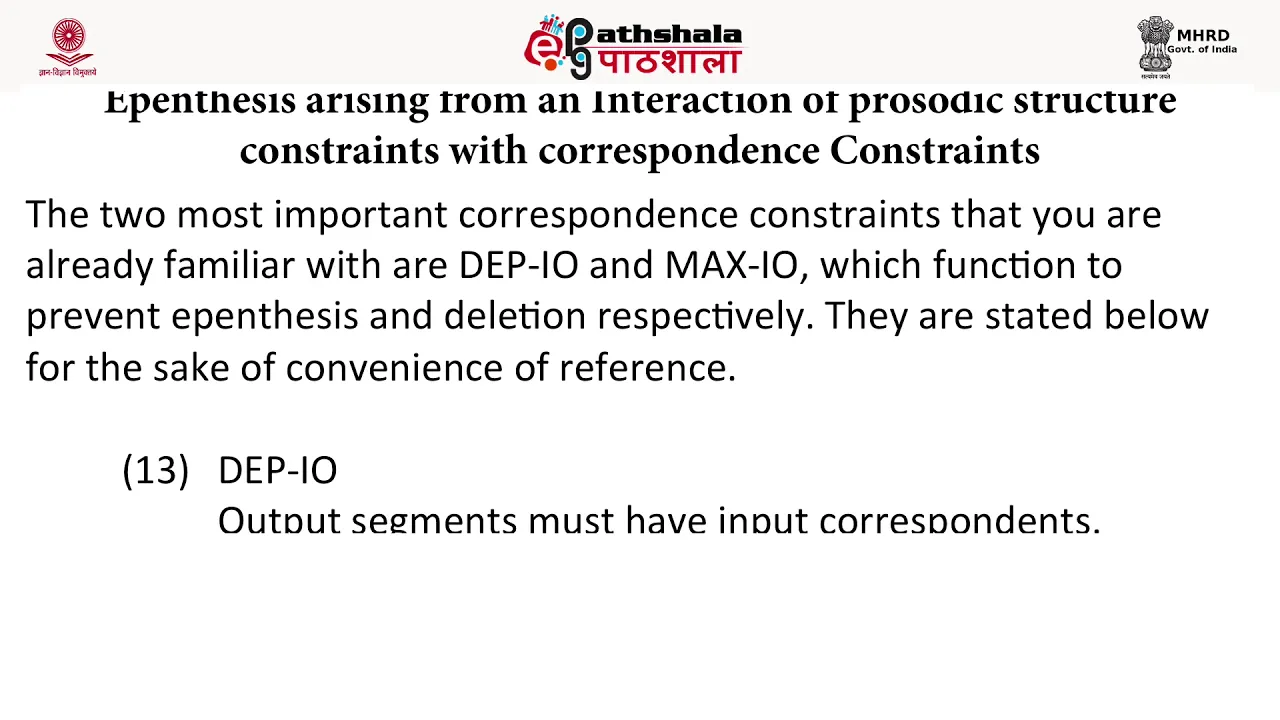
Constraint Interaction in Optimality Theory: Epenthesis & Deletion
@Vidyamitra
180 views•2018-08-20
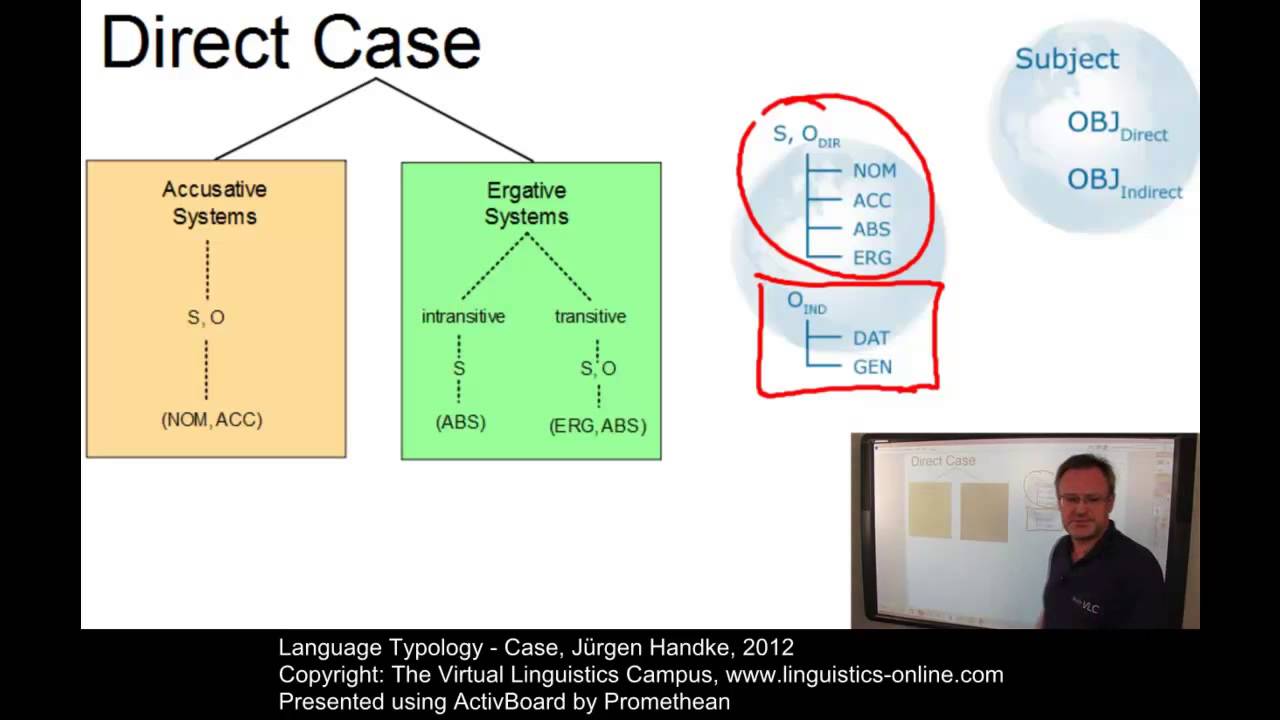
Understanding Grammatical Case: A Cross-Linguistic Study
@oer-vlc
13K views•2012-10-30

Accent Expert Explains U.S. Regional Dialects | Part 1
@WIRED
9.3M views•2021-01-21
Related Study Plans & Knowledge Roadmaps
Structured learning paths in Linguistics