






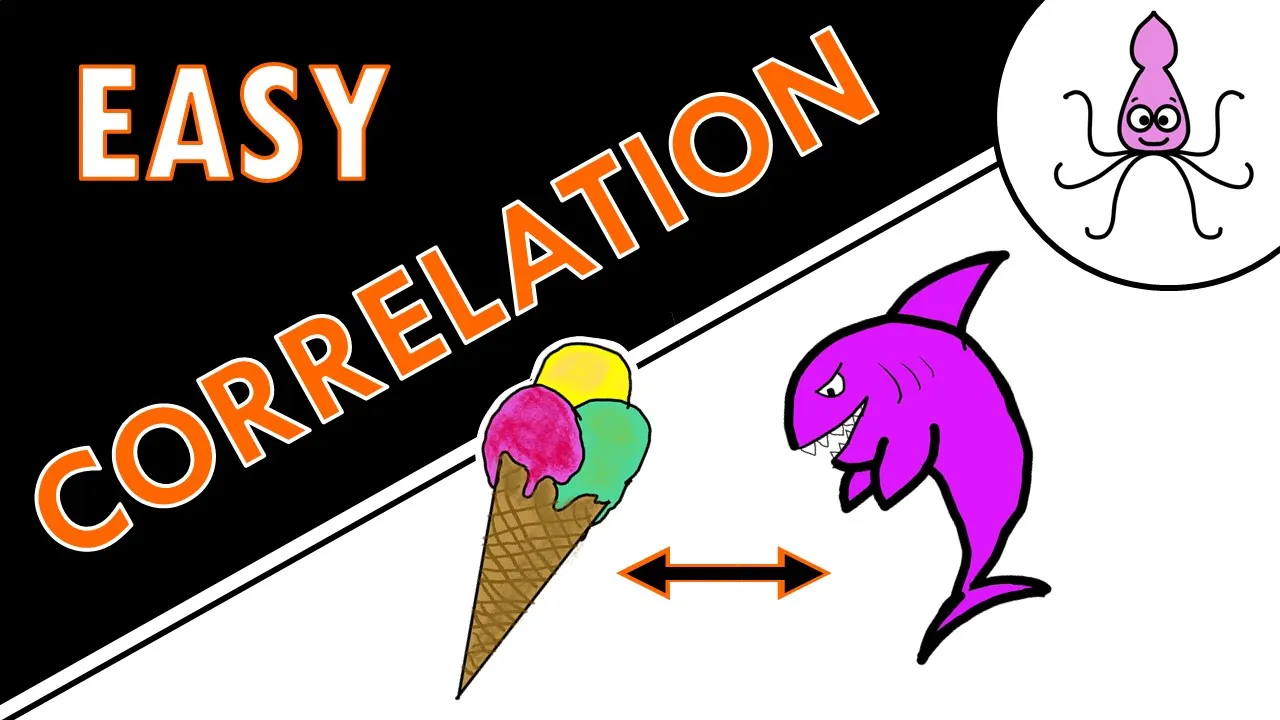
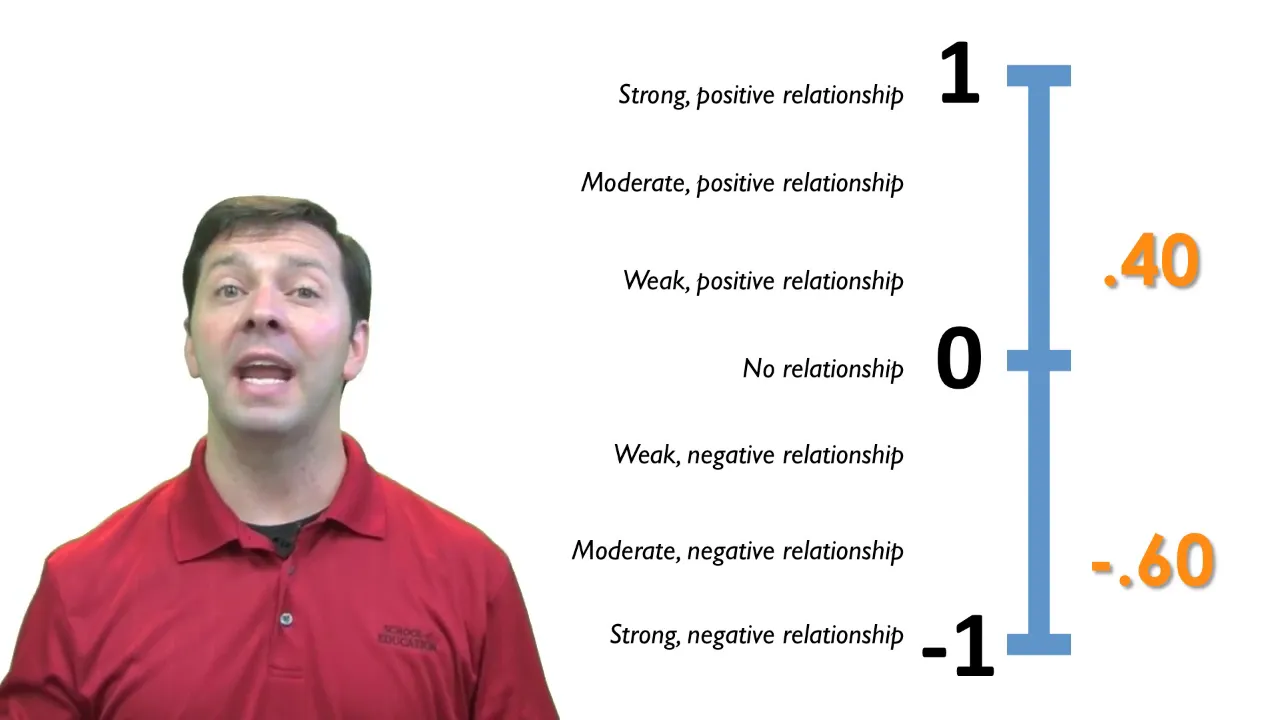





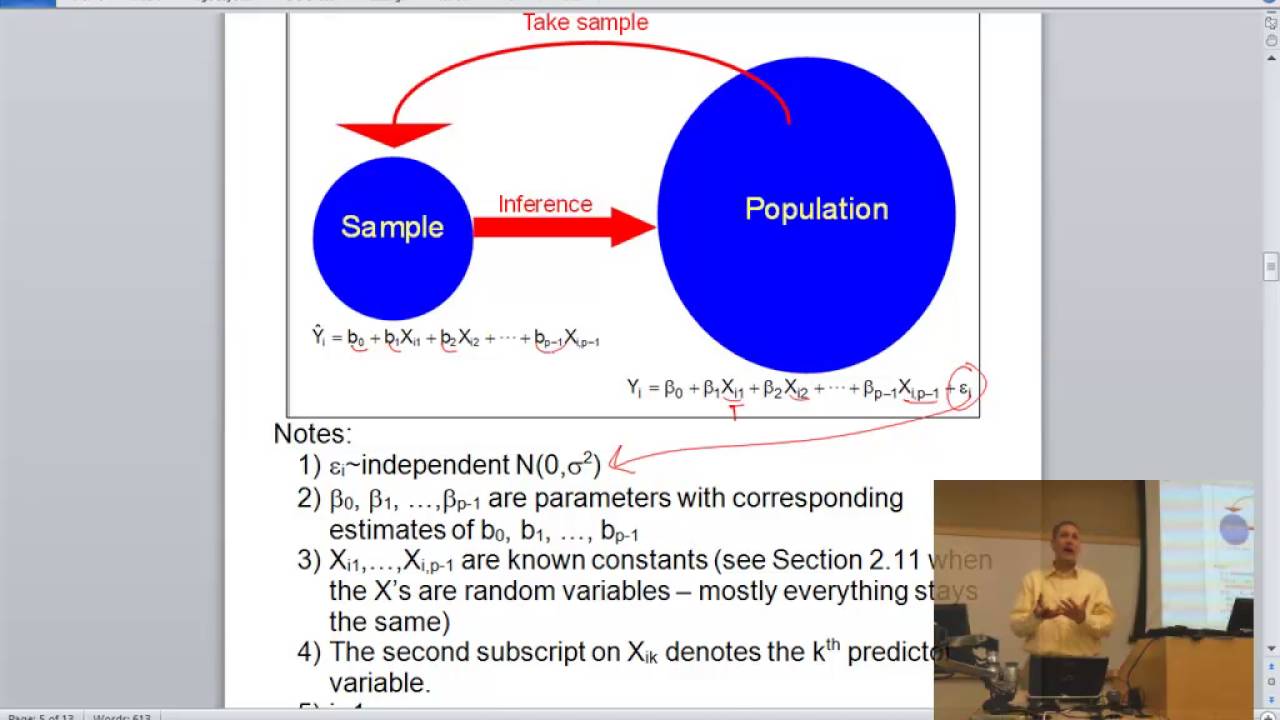
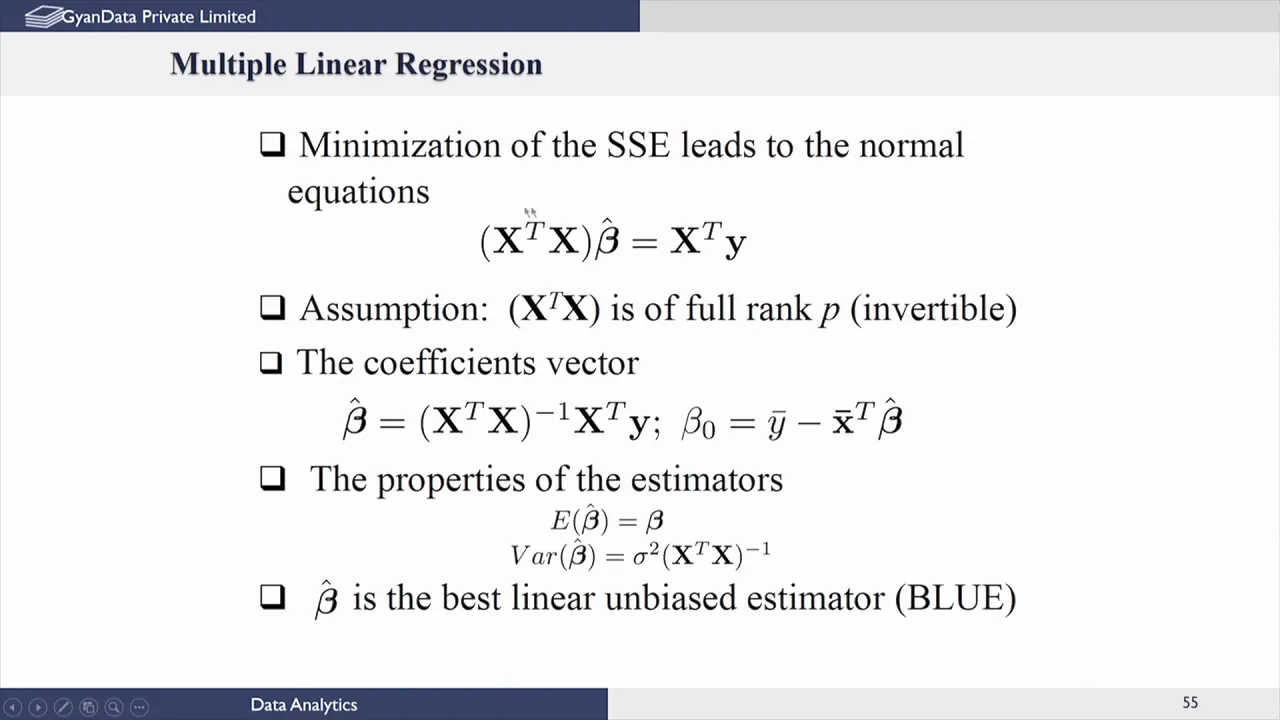
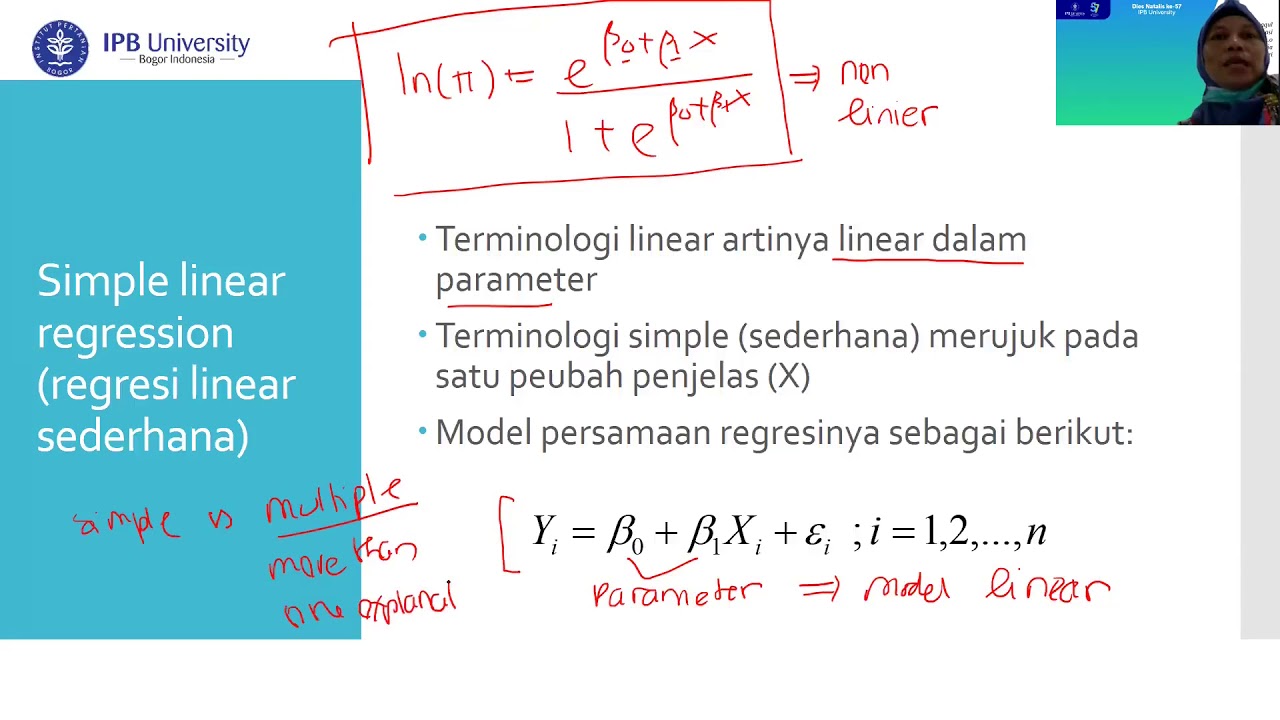
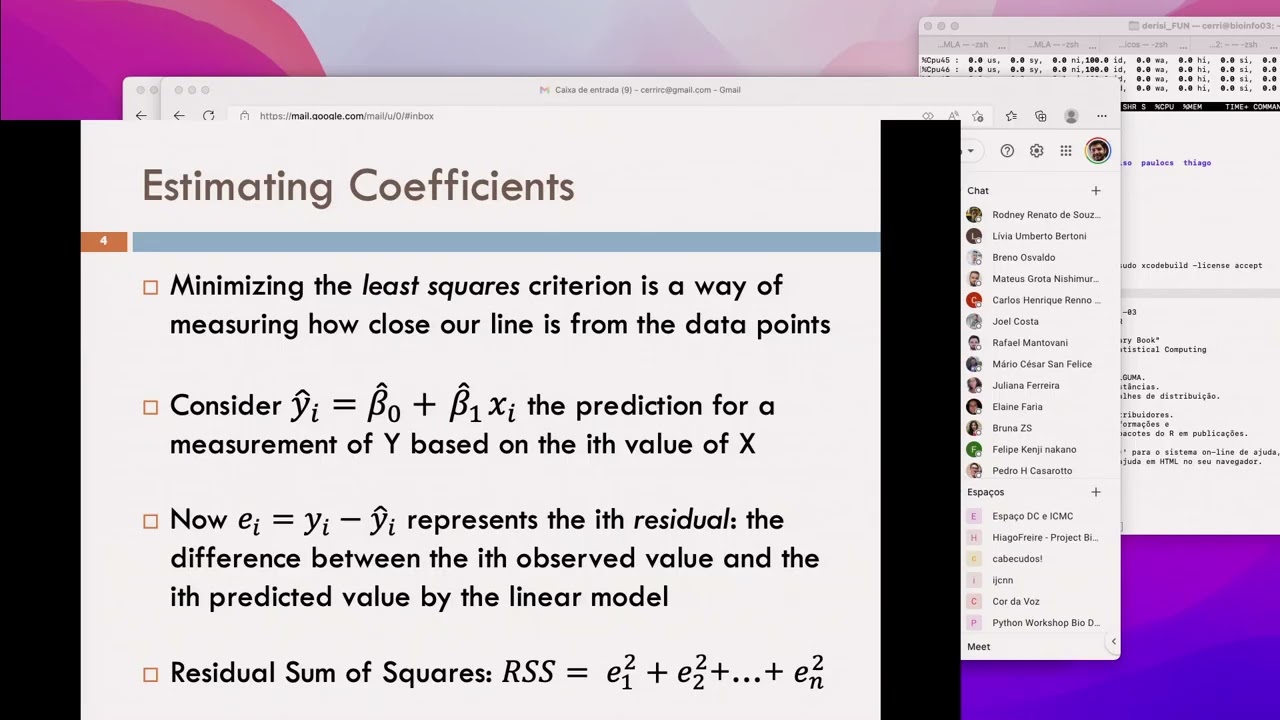












Linear regression quantifies relationships between variables through three key components: (1) Least squares estimation fits a line by minimizing the sum of squared residuals (distances between data points and the line), yielding an intercept and slope; (2) R-squared measures how much variation in the dependent variable is explained by the independent variable(s), calculated as (variation around mean minus variation around fit) divided by variation around mean, ranging from 0 to 1; (3) A p-value assesses whether the observed R-squared is statistically significant, derived from the F-statistic which compares explained variance to unexplained variance, with degrees of freedom accounting for the number of parameters estimated. Together, a high R-squared and low p-value indicate a meaningful relationship.
Linear Regression Explained: Least Squares & R-squared
Added:sailing on a boat headed towards statquest join me on this boat let's go to stat Quest it's super cool hello and welcome to stat Quest stat Quest is brought to you by the friendly folks in the genetics department at the University of North Carolina at Chapel Hill today we're going to be talking about linear regression AKA General linear models part one there's a lot of parts to linear models but it's a really cool and Powerful concept so let's get right down to it I promise you I have lots and lots of slides that talk about all the Nitty Gritty details behind linear regression but first let's talk about the main ideas behind it the first thing you do in linear regression is use least squares to fit a line to the data the second thing you do is calculate r squared lastly calculate a p-value for r squared there are lots of other little things that come up along the way but these are the three most important Concepts behind linear regression in the stat Quest fitting a line to data we talked about fitting a line to data duh but let's do a quick review I'm going to introduce some new terminology in this part of the video so it's worth watching even if you've already seen the earlier stat Quest that said if you need more details check that stat Quest out for this review we're going to be talking about a data set where we took a bunch of mice and we measured their size and we measured their weight our goal is to use mouse weight as a way to predict Mouse size first draw a line through the data second measure the distance from the line to the data Square each distance and then add them up terminology alert the distance from the line to the data point is called a residual third rotate the line a little bit with the new line measure the residuals Square them and then sum up the squares now rotate the line a little bit more sum up the squared residuals etc etc etc we rotate and then sum up the squared residuals rotate then sum up the squared residuals just keep doing that after a bunch of rotations you can plot the sum of squared residuals and corresponding rotation so in this graph we have the sum of squared residuals on the y-axis and the different rotations on the x-axis lastly you find the rotation that has the least sum of squares more details about how this is actually done in practice are provided in the stat Quest on fitting a line to data so we see that this rotation is the one with the least squares so it will be the one to fit to the data this is our least squares rotation superimposed on the original data bam now we know why the method for fitting a line is called least squares now we have fit a line to the data this is awesome here's the equation for the line least squares estimated two parameters a y-axis intercept and a slope since the slope is not zero it means that knowing a mouse's weight will help us make a guess about that Mouse's size how good is that guess calculating r squared is the first step in determining how good that guess will be the stat Quest r squared explained talks about you got it r squared let's do a quick review I'm also going to introduce some additional terminology so it's worth watching this part of the video even if you've seen the original stat Quest on r squared first calculate the average Mouse size okay I've just shifted all the data points to the y-axis to emphasize that at this point we are only interested in Mouse size here I've drawn a black line to show the average Mouse size bam sum the squared residuals just like in least squares we measure the distance from the mean to the data point and square it and then add those squares together terminology alert we'll call this SS mean for sum of squares around the mean note the sum of squares around the mean equals the data minus the mean squared the variation around the mean equals the data minus the mean squared divided by n n is the sample size in this case n equals 9.
the shorthand notation is the variation around the mean equals the sum of squares around the mean divided by n the sample size another way to think about variance is as the average sum of squares per Mouse now go back to the original plot and sum up the squared residuals around our least squares fit we'll call This Ss fit for the sum of squares around the least squares fit the sum of squares around the least squares fit is the sum of the distances between the data and the line squared just like with the mean the variance around the fit is the distance between the line and the data squared divided by n the sample size the shorthand is the variation around the fitted line equals the sum of squares around the fitted line divided by n the sample size again we can think of the variation around the fit as the average of the sum of squares around the fit for each Mouse in general the variance of something equals the sum of squares divided by the number of those things in other words it's an average of sum of squares I mentioned this because it's going to come in handy in a little bit so keep it in the back of your mind okay let's step back a little bit this is the raw variation in Mouse size and this is the variation around the least squares line there's less variation around the line that we fit by least squares that is to say the residuals are smaller as a result we say that some of the variation in Mouse size is explained by taking mouse weight into account in other words heavier mice are bigger lighter mice are smaller r squared tells us how much of the variation in Mouse size can be explained by taking mouse weight into account this is the formula for r squared it's the variation around the mean minus the variation around the fit divided by the variation around the mean let's look at an example in this example the variation around the mean equals 11.1 and the variation around the fit equals 4.4 so we plug those numbers into the equation the result is that r squared equals 0.6 which is the same thing as saying 60 percent this means there is a sixty percent reduction in the variance when we take the mouse weight into account alternatively we can say that mouse weight explains 60 percent of the variation in Mouse size we can also use the sum of squares to make the same calculation this is because when we're talking about variation everything's divided by n the sample size since everything's scaled by n we can pull that term out and just use the raw sum of squares in this case the sum of squares around the mean equals one hundred and the sum of squares around the fit equals 40. plugging those numbers into the equation gives us the same value we had before r squared equals 0.6 which equals 60 percent 60 percent of the sums of squares of the mouse size can be explained by mouse weight here's another example we're also going to go back to using variation in the calculation since that's more common in this case knowing mouse weight means you can make a perfect prediction of mouse size the variation around the mean is the same as it was before 11.1 but now the variation around the fitted line equals zero because there are no residuals plugging the numbers in gives us an r squared equal to one which equals one hundred percent in this case mouse weight explains 100 percent of the variation in Mouse size okay one last example in this case knowing mouse weight doesn't help us predict Mouse size if someone tells us they have a heavy Mouse well that Mouse could either be small or large with equal probability similarly if someone said they had a light Mouse well again we wouldn't know if it was a big mouse or a small Mouse because each of those options is equally likely just like the other two examples the variation around the mean is equal 11.1 however in this case the variation around the fit is also equal 11.1 so we plug those numbers in and we get r squared equals 0 which equals zero percent in this case mouse weight doesn't explain any of the variation around the mean when calculating the sum of squares around the mean we collapse the points onto the y-axis just to emphasize the fact that we were ignoring mouse weight but we could just as easily draw a line y equals the mean Mouse size and calculate the sum of squares around the mean around that in this example we applied r squared to a simple equation for a line Y equals 0.1 plus 0.78 times x this gave us an r squared of 60 percent meaning 60 percent of the variation in Mouse size could be explained by mouse weight but the concept applies to any equation no matter how complicated first you measure square and sum the distance from the data to the mean then measure square and sum the distance from the data to the complicated equation once you've got those two sums of squares just plug them in and you've got r squared let's look at a slightly more complicated example imagine we wanted to know if mouse weight and tail length did a good job predicting the length of the mouse's body so we measure a bunch of mice to plot this data we need a three-dimensional graph we want to know how well weight and tail length predict body length the first Mouse we measured had weight equals 2.1 tail length equals 1.3 and body length equals 2.5 so that's how we plot this data on this 3D graph here's all the data in the graph the larger circles are points that are closer to us and represent mice that have shorter tails the smaller circles are points that are further from us and represent mice with longer tails now we do a least squares fit since we have the extra term in the equation representing an extra Dimension we fit a plane instead of a line here's the equation for the plane the Y value represents body length least squares estimates three different parameters the first is the y-intercept that's when both tail length and mouse weight are equal to zero the second parameter 0.7 is for the mouse weight the last term 0.5 is for the tail length if we know a mouse's weight and tail length we can use the equation to guess the body length for example given the weight and tail length for this mouse the equation predicts this body length just like before we can measure the residuals Square them and then add them up to calculate r squared now if the tail length or the z-axis is useless and doesn't make the sum of squares fit any smaller than least squares will ignore it by making that parameter equal to zero in this case plugging the tail length into the equation would have no effect on predicting the mouse size this means equations with more parameters will never make the sum of squares around the fit worse than equations with fewer parameters in other words this equation Mouse size equals 0.3 plus mouse weight plus flip of a coin plus favored color plus astrological sign plus extra stuff will never perform worse than this equation Mouse size equals 0.3 plus mouse weight this is because least squares will cause any term that makes sum of squares around the fit worse to be multiplied by zero and in a sense no longer exist now due to random chance there is a small probability that the small mice in the data set might get heads more frequently than large mice if this happened then we'd get a smaller sum of squares fit and a better r squared here's the frowny face of sad times the more silly parameters we add to the equation the more opportunities we have for random events to reduce sum of squares fit and result in a better r squared thus people report an adjusted r squared value that in essence scales are squared by the number of parameters r squared is awesome but it's missing something what if all we had were two measurements we'd calculate the sum of squares around the mean in this case that would be 10 then we'd calculate the sum of squares around the fit which equals zero the sum of squares around the fit equals zero because you can always draw a straight line to connect any two points what this means is when we calculate r squared by plugging the numbers in we're going to get 100 percent 100 percent is a great number we've explained all the variation but any two random points will give us the exact same thing it doesn't actually mean anything we need a way to determine if the r squared value is statistically significant we need a p-value before we calculate the p-value let's review the main Concepts behind r squared one last time the general equation for r squared is the variance around the mean minus the variance around the fit divided by the variance around the mean in our example this means the variation in the mouse size minus the variation after taking weight into account divided by the variation in Mouse size in other words r squared equals the variation in Mouse size explained by weight divided by the variation in Mouse size without taking weight into account in this particular example r squared equals 0.6 meaning we saw a 60 reduction in variation once we took mouse weight into account now that we have a thorough understanding of the ideas behind r squared let's talk about the main ideas behind calculating a p-value for it the p-value for r squared comes from something called f f is equal to the variation in Mouse size explained by weight divided by the variation in Mouse size not explained by weight the numerators for r squared and for f are the same that is to say it's the reduction in variance when we take the weight into account the denominator is a little different these dotted lines the residuals represent the variation that remains after fitting the line this is the variation that is not explained by weight so together we have the variation in Mouse size explained by weight divided by the variation in Mouse size not explained by weight now let's look at the underlying mathematics just as a reminder here's the equation for r squared this is the general equation that will tell us if r squared is significant the meat of these two equations are very similar and rely on the same sums of squares like we said before the numerators are the same in our Mouse size and weight example the numerator is the variation in Mouse size explained by weight and the sum of squares around the fit is just the residuals squared and summed up around the fitted line so that's the variation that the fit does not explain these numbers over here are the degrees of freedom they turn the sums of squares into variances I'm going to dedicate a whole stat quest to degrees of freedom but for now let's see if we can get an intuitive feel for what they're doing here let's start with these P fit is the number of parameters in the fit line here's the equation for the fit line in a general format we just have the y-intercept plus the slope times x the y-intercept and the slope are two separate parameters that means P fit equals two p mean is the number of parameters in the mean line in general that equation is y equals the y-intercept that's what gives us a horizontal line that cuts through the data in this case the y-intercept is the mean value this equation just has one parameter thus p mean equals one both equations have a parameter for the y-intercept however the fit line has one extra parameter the slope in our example this slope is the relationship between weight and size in this example P fit minus p mean equals 2 minus 1 which equals one the fit has one extra parameter mouse weight thus the numerator is the variance explained by the extra parameter in our example that's the variance in Mouse size explained by mouse weight if we had used mouse weight and tail length to explain variation in size then we would end up with an equation that had three parameters and P fit would equal three thus P fit minus p mean would equal three minus 1 which equals two now the fit has two extra parameters mouse weight and tail length with the fancier equation for the fit the numerator is the variance and mouse size explained by mouse weight and tail length now let's talk about the denominator for our equation for f denominator is the variation in Mouse size not explained by the fit that is to say it's the sum of squares of the residuals that remain after we fit our new line to the data y divide sum of squares fit by n minus P fit instead of just n intuitively the more parameters you have in your equation the more data you need to estimate them for example you only need two points to estimate a line but you need three points to estimate a plane if the fit is good then the variation explained by the extra parameters in the fit will be a large number and the variation not explained by the extra parameters in the fit will be a small number that makes f a really large number now that question we've all been dying to know the answer to how do we turn this number into a p-value conceptually generate a set of random data calculate the mean and the sum of squares around the mean calculate the fit in the sum of squares around the fit now plug all those values into our equation for f and that will give us a number in this case that number is 2.
now plot that number in a histogram now generate another set of random data calculate the mean and the sum of squares around the mean then calculate the fit and the sum of squares around the fit plug those values into our equation for f and in this case we get f equals three so we then plug that value into our histogram and then we repeat with yet another set of random data in this case we got f equals one that's plotted on our histogram and we just keep generating more and more random data sets calculating the sums of squares plugging them into our equation for f and plotting the results on our histogram now imagine we did that hundreds if not millions of times when we're all done with our random data sets we return to our original data set we then plug the numbers into our equation for f in this case we got f equals 6.
the p-value is the number of more extreme values divided by all of the values so in this case we have the value at f equals 6 and the value at f equals 7 divided by all the other randomizations that we created originally if this concept is confusing to you I have a stat Quest that explains p-values so check that one out bam you can approximate the histogram with a line in practice rather than generating tons of random data sets people use the line to calculate the p-value here's an example of one standard F distribution that people use to calculate p-values the degrees of freedom determine the shape the red line represents another standard F distribution that people use to calculate p-values in this case the sample size used to draw the red line is smaller than the sample size used to draw the blue line notice that when n minus P fit equals 10 the distribution tapers off faster this means that the p-value will be smaller when there are more samples relative to the number of parameters in the fit equation triple bam hooray we finally got our p-value now let's review the main ideas given some data that you think are related linear regression quantifies the relationship in the data this is r squared this needs to be large it also determines how reliable that relationship is this is the p-value that we calculated with f this needs to be small you need both to have an interesting result hooray we've made it to the end of another exciting stat Quest wow this was a long one I hope you had a good time if you like this and want to see more stat quests like it want to subscribe to my channel it's real easy just click the red button and if you have any ideas of stat quests that you'd like me to create just put them in the comments below that's all there is to it all right tune in next time for another really exciting stat Quest
Up Next
Mathematics of Gradient Descent Explained | Machine Learning Tutorial
@TheCodingTrain
253.8K views•2017-06-05

Elliptic Curve Cryptography Explained: ECC, ECDSA, ECDH
@PracticalNetworking
28.5K views•2024-10-21

Mutual Information Explained: A Clear Step-by-Step Guide
@statquest
164.6K views•2023-02-06

The Mathematical Impossibility of Accurate World Maps
@Vox
23.3M views•2016-12-02
Related Study Plans & Knowledge Roadmaps
Structured learning paths in Mathematics