



























Antibody testing for SARS-CoV-2 infection uses nucleocapsid protein antibodies to detect natural infection, as spike protein antibodies can also be produced by vaccination; antibody levels wane over time, meaning seroprevalence surveys represent minimum estimates of actual infections rather than accurate counts, and long-term immunity depends on B and T memory cells rather than antibody levels alone.
COVID-19 Seroprevalence: Antibody Data Analysis Explained
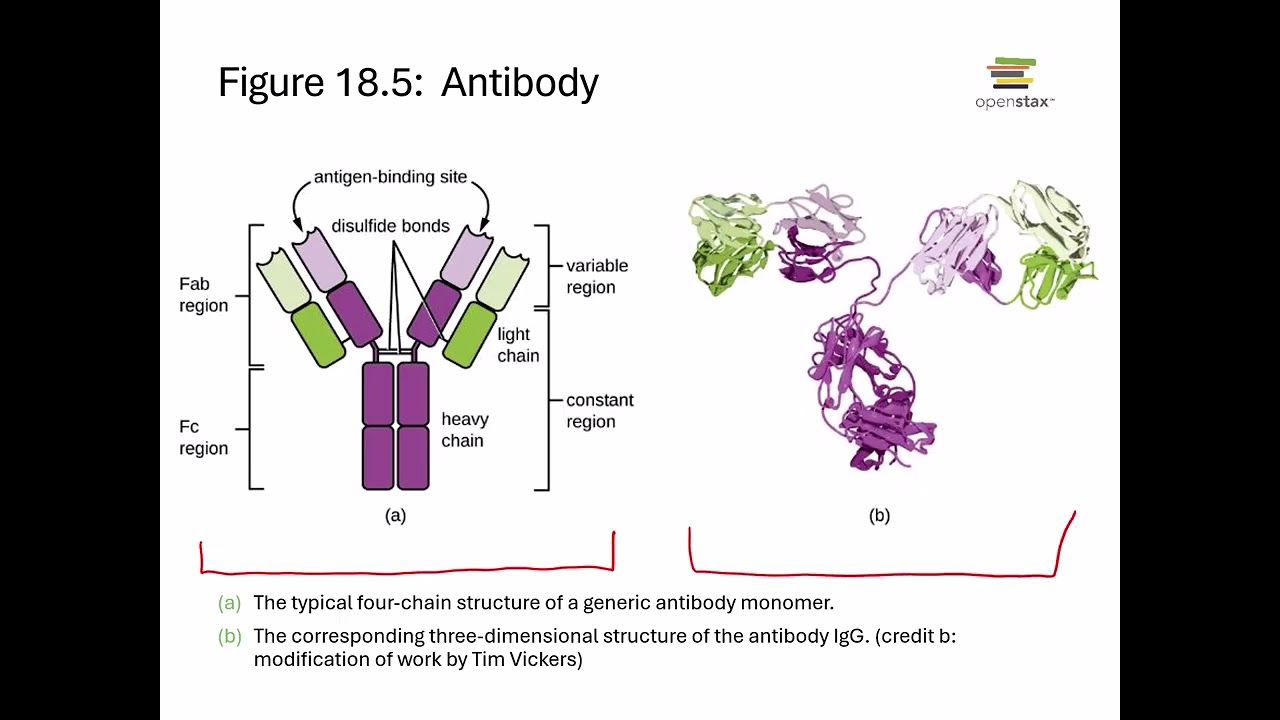
Added:Basic immunology concepts, including the definition of antigens, antibodies (specifically IgG and IgM), and how the adaptive immune system responds to viral pathogens.
The epidemiological definition of 'seroprevalence' and how it differs from active infection surveillance metrics like PCR or rapid antigen test positivity.
The fundamental differences between natural immunity (acquired via infection) and vaccine-induced immunity at a molecular level.
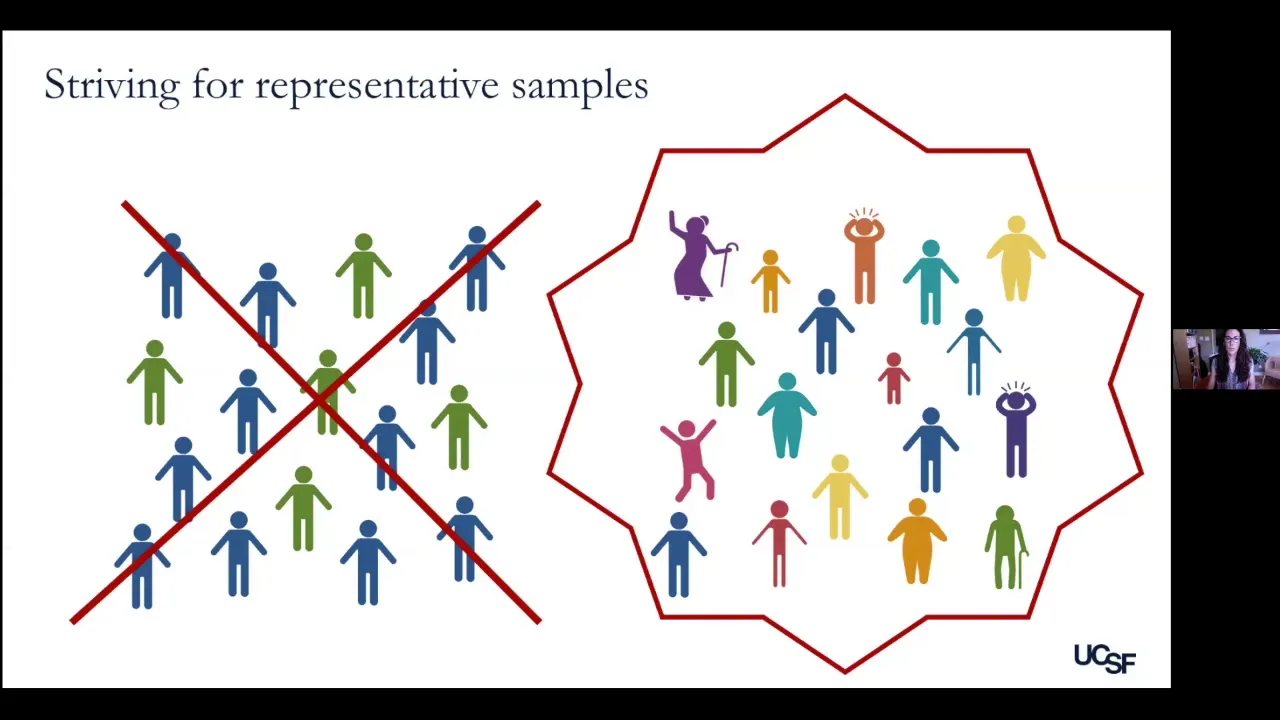
Basic principles of biostatistics, including sample sizes, representativeness, and how localized data is scaled to estimate national trends.
Advanced study of antibody kinetics, including antibody waning rates and the role of memory B-cells and T-cells in long-term immunity.
The application of seroprevalence data in calculating herd immunity thresholds and formulating national vaccination and booster strategies.
Comparative analysis of global public health surveillance systems, examining how the US, UK, and Australia differ in health data infrastructure and reporting.
Epidemiological modeling and forecasting, using historical serological data to predict the impact of emerging viral variants on population-level immunity.
308.8K views9Klikes24:36Original Release: 2022-03-04
now let's go and look at the united states now so the headlines 140 million americans have had their coronavirus serial prevalence from commercial laboratories now this is looking at infection induced antibodies so of course we can look at different antibodies the production of which is of course stimulated by the various proteins so spike protein antibodies could be the vaccine or the um or the virus but the one this survey is looking at is the nucleocapsid protein which means that the person has been exposed to the inside part of the virus so it's only occurring as a result of natural infection now 58 of up to 17 year olds of uh have have antibodies indicating that indicating they've actually had the infection they've been exposed to the virus itself now this data's from 72 000 blood samples taken in january so it's clearly a bit out of date already and it's a percentage in the united states resolving or past infection with saskarona virus too or so so they are saying but in fact because it's looking at antibodies people that had the natural infection early on in the pandemic may well no longer have detectable levels of antibody so this is an absolute minimum number so the actual 140 million is a completely minimum number and that's one of the reasons why it's the minimum number so not how much antibody is present and then this is a direct quote do not necessarily indicate the percentage of people with sufficient antibody protection against infected reinfection i mean really are they are they really saying here that the factor in reinfection is antibody levels i i would have thought the longevity of protection is determined by the b and t cells so now given this is coming from the cdc a bit disappointing that they they seem to be implying that because we know that vaccination will dramatically increase antibodies in the short term but what we're interested in is long term immunity with the um the b and the t memory cells so quite widely put that in like that is a bit difficult to determine these percentages do not include people who have been vaccinated against sales coronavis to it and have no history of infection so that's natural infection uh 140 million from there now they they have a paper linked to a paper here so i clicked on that link and i thought oh that's good they've got a paper i'll go direct to that and get the results but that took us to a paper that was dated to september 2020.
so really really i mean the the cdc here are referring to as a to as a paper from 2020 and they're strongly implying that immunity is determined by antibody levels not impressed to be quite honest given the amount of money you poor taxpayers in the united states are paying these guys not really impressed so far at all anyway so i went directly to the to the site which was up to date well when was it up to date it's rather hard to tell but certainly no later than january and of course this is with six weeks minimum of six weeks later into omicron now so the number of infections there could easily have doubled easily so it could be it could be 280 million people have been exposed to the virus quite easily that is quite in my view that's quite feasible but the zero prevalence estimates in january uh 43.3 percent of the american population number of estimated infections 140 million number of cases in underwater the time that the times has been detected and again that that's just until the end of january um 74 million so it's kind it's kind of a times two isn't it um but as we've said this number is is a minimum for the number of people that have been real actually infected because when you're looking for antibodies an antibody cover will wane and as we said that's looking at the nucleocapsid antibody um zero prevalence by demographics quite interesting in the states here um so this one is zero prevalence by demographic so age so here we see uh naught 20 40 60 80 in numbers these are the sample sizes so they've taken 20 000 there 16 000 there 22 000 there 14 000 in that age group so if we take no to 17 year olds have taken 14 000 samples and they've found that the prevalence there is uh is around about 60 so it's higher the prevalence is higher in younger people of natural infection older people have had lower levels of natural exposure at least as of january male female as you'd expect you wouldn't really expect a difference there would you estimated zero prevalence estimates percentages here so again we do see this going up quite dramatically to about the 43 we are now but if that's kind of uh that's october november december so this is kind of january so this is only according to this graphic kind of mid-january so as i say could easily be way much so much higher now could could be double that now so this is giving a if you like an out-of-date somewhat pessimistic view of the level of natural immunity that will have been developed as a result of exposure in the states so they do seem to be um yeah they get the giving they're giving the minimum levels of protection i think here now there's another study in the states from blood donations and this one is looking at uh uh infection by vaccine national carbon 19 infection and vaccinations this is infection and vaccination so in other words they're looking for any antibodies whether it's caused by the spike protein or the nuclear caps capsid program or the others uh the percentage of 16 year olds developing antibodies against coronavirus two from vaccination or infection so this is both and as of december 2021 so i can hopelessly out of date what are these well why don't they keep this vaguely up to date dear me anyway 94.7 now in the in the uk we know this figure is 95.5 so in the uk basically everyone's been exposed to the virus now virtually everyone in the states a little bit lower persons age greater than 16 years of age with more than one covered 19 vaccine dose 70 again that will be slightly higher now cumulative reported covered 19 cases per 100 14.7 specimens tested 136 000 so um pretty disappointing really the um the quality of data we're getting from the states now let's move on to australia which is really pretty interesting so here we have the uh this is the shape of the uh the omicron wave so that's taking us some january this is the omicron wave in australia scooted up and going down now now it's going to probably carry on at about this level for a period of time now because western australia has just opened its border so basically everyone in western australia will be getting exposed to the virus if they haven't been already in the next few weeks it's going to take a little longer to get to the rural areas but places like metropolitan perth it's going to spread around it really pretty quickly so that's the shape what we would expect really in australia that kind of shape um now this is um this graphic here shows the this is the active cases and this is the uh that well basically they're all locally they're all locally enquired they're basically all now locally acquired so active cases and new cases um so we see i'll show you on this one actually i've got it on and got it on here um what we see on this is australia overall uh capital territories um that's that's in in the east new south wales well that's obviously not correct there's a data drop out there northern territories queensland south australia tasmania victoria so still going on in the east but what's happening now western australia's just opened up so these numbers in western australia will be going up they will be going up well they'll be going up now as we speak they'll be going up now current covered 19 cases in hospital and intensive care in australia so this is the country overall and here we see the effect of omicron on a highly vaccinated population and it's not it's not great but it's nothing like some of the previous waves absolutely nothing like it so that's this is australia overall hospitalized uh we've got 1684 not an itu 105 in itu 1753 for the whole country so as i say because of the phase of the pandemic i'm expecting the new south wales figures to stay flat then start going down soon same for the queensland figure same for the victoria figures but the western australia figures will be going up because they've just opened up they are a bit behind hopefully not very much at all because as we said it's a highly vaccinated population but they will be going up somewhat unfortunately but i'm optimistic not beyond the ability to to cope with it i'm not expecting a hong kong situation because the older demographic in western australia is fairly highly vaccinated now finally today we'll look at the office for national statistics data just before i look at some graphics let's look at this um how the prevalence i was just talking to tim spector about this yesterday and the prevalence is still high there's still a lot of covered around but thankfully not going into hospitalizations and deaths or reducing numbers so in england during during the week of course this is all with this is always the week behind weekend in the 19th of february what's a couple of weeks behind isn't it but but there you go that's what we've got um one in 25 people in england had it one in 30 in wales one in 14 in northern ireland one in 20 actually had the infection that week so we still see that the prevalence is really high and you could argue that this is good news because this is inducing a lot of um natural immunity so england percentage testing positive is starting to go down somewhat now round about the just under four percent mark as we've noticed scotland still going up curious scotland's still going up i'm expecting that to level off pretty soon but potentially remain at this reasonably high level for a period of time tim spector yesterday thought that we might be stuck with these kind of levels for for a period of time didn't quite say how long but potentially till the better weather arrives but if people aren't getting sick and it's producing more immunity then how big a problem is that now this is ba2 and ba1 now this is still surprising so again this latest data is showing that ba2 is not not displacing ba1 very quickly at all in england it has done somewhat in northern ireland why the difference there is not clear now ba2 is more common than ba1 in northern ireland but why we're not following the denmark pattern and ba2 is taking over rapidly is is curious it is curious and there's no obvious reason for that i i can't think of an obvious reason and i haven't seen one postulated really either the hospital admissions well this is this is good news that they are going down i mean there's a steady reduction in hospital admissions which we're delighted to see now this is quite interesting this is like a comparative graphic so these are infections so alpha became dominant beta became dominant uh sorry delta alpha became dominant beta was only in south africa delta became dominant let's go and say we'll get it right there you go delta became ominous and omicron became a dominant and here we see percentage testing positive so by far the highest number of people testing positive okay the testing was somewhat better at least for the early stages testing's gone off now quite a lot but but actually take that back this is not based on testing this is the office for national statistics data so the the number of cases officially in the uk has gone down dramatically but the coverage symptom tracker data is still showing relatively high numbers and these numbers here are from the office of national statistics survey so the survey data is staying high while the official numbers of cases are going down because they're not being reported so this is actually good survey-based data so we can say that the level of infection was higher during omicron than in the previous waves we don't have the data for back here really on that but uh it's looking likely but then if we look at if we go down and we look at say the hospitalizations when alpha became prevalent very high delta became prevalent hospitalizations here lower because of the uh higher vaccination status that was around and some developing natural immunity as well whereas omicron yes there has been some increase in hospitalizations but that's going down as we've seen quite nicely now that has affect infected huge numbers of people based on the ons survey data so that is the closest thing to real numbers that we have really so that's quite an interesting comparator and deaths likewise deaths when alpha became prominent deaths went very high delta became prominent in this period here but good vaccination status so desperate nothing like as high had it not been for vaccination we could have seen this curve all over again in times of uh delta but we didn't and this slight uptick in deaths that we've seen in terms of omicron purely because of the large numbers of people all were all infected at the same time that was quite interesting deaths well you can see the waves there and they're going down so encouraging that the deaths are currently going down in the uk now people seem determined to misunderstand this deaths with covered and deaths from covered and i really don't see why why the emotion is there i say one little thing about it and people like jump at me for it but but um let's let's look at the definitive data just so as we've done 100 times on this channel so covered 19 was the underlying cause of the majority of deaths where covered 19 was mentioned anywhere on the death certificate england and wales so we see that roughly 75 percent of cases that's a 75 line there at the moment are deaths from a covered that means this other 25 are deaths with a covered in other words the infection was coincidental to the cause of the death so we see three quarters of the deaths where covered is mentioned on the death certificates are actually caused by covered in other words these people would have gone on living for days weeks months years or potentially a decade or two longer although the average age of death is still around about 82 so we're probably talking months to several years longer but nevertheless um we do see that this is clearly reflected in the data so most of these deaths three-quarters of these deaths are deaths from covered 25 are deaths with covered um i don't think that's too hard to understand and the these are the main co-morbidities this is the percentage so diabetes um chronic lower respiratory disease high blood pressure urinary system ischemic heart disease uh ill-defined conditions dementia heart failure complications cardiac everything has malignant neoplasms in the blood carbon 19 with no pre-existing conditions still around about the 17 mark so hopefully that now is clarified and i think that's the only uh that's the last slide i think we had on that now i'm just going to show you one more thing today this is a letter i i don't know really what i can show you here but this is um this is a letter from a british member of parliament to their constituent about the issue of aspiration um so the the constituent uh wrote to their mp as i asked people to the green book which is our vaccination book states is not necessary to aspirate as part of the process of vaccination because there are no large blood flow of vessels at the recommended injection sites now i i might as well show you these again soon we're here this is the injection site and as we see here's some large blood vessels um can you see that yeah there's some large blood vessels there around about the injection site so unless that anatomy is wrong but there we see some more deep in the muscle these are blood vessels and they're uh and they're co-combinant uh veins convenient v-neck v-neck coming antis the veins that go over the artery so we clearly see in that area there we have these large blood vessels and here we see the anterior circumflex humeral artery and the veins that go with that just not illustrated in this and here we see other large vessels there's the artery going into the deltoid and there's the vein taking blood away from the deltoid and those last three pictures are all from grey's anatomy so the green book states it's not necessarily aspirated part of the process of vaccination because there are no large blood vessels well i think we've just disproved that at the injection site i am assured that the uk health and security agency regularly reviews and updates the green book well i'm pleased you're reassured by that the world health organization are people actually still referring to the world health organization as a definitive authority looks like they are also that aspiration should not be done during intramuscular injections well i don't think the world health organization does actually say that um miss or mr or ms mp um i think that's referring specifically to vaccination so um without being predatory and it's it's not it's not a mood point because if you take things like uh depo phenothiazines for antipsychotics injections or depot contraceptives which are still used these are in oil and if you don't aspirate those and they go into a blood vessel then you can cause a pulmonary white out you'll get you'll get a pulmonary fat embolism which of course goes without saying is remarkably serious so i'm not sure the world health that organization should not be done during intramuscular injections i don't think that's true anyway but the reason the reason the world health organization give um for not aspirating during injections is this may increase pain due to longer contact time and lateral movement of the needle well all i can say to that is not if i'm doing it if you're doing it properly the needle doesn't wobble around when you give it i mean that's that's just a ridiculous thing to say technique can stabilize the needle there's no data to justify uh there's a present no data justify aspiration no evidence to suggest that this process could have an impact on the outcome of blood clots following vaccination in that case miss or ms or mr mp why have germany just changed the guidelines why have denmark changed the guidelines under the under the guidance of professor hoyby months and months ago moreover this this bit listen listen to this this takes the biscuit this really does take the biscuit really um moreover should a vaccinator aspirate and draw blood well how can they draw blood did you not just say there's no blood vessels in that area so so what you've just said is completely impossible if there's no large blood vessels in the area then it's completely impossible to draw blood but now you're saying should they draw blood you're contradicting yourself miss mr mr politician here completely moreover should a vaccinator aspirate blood obviously impossible but should they should should the impossible occur they would be required to dispose of the needle and shot vaccine they were using which would be an unjustified waste of vaccine of precious vaccine supplies in other words this mp is saying it's better to give the vaccine intravenously than waste of the shot let me say that again this is implying to me that they are saying this politician is saying that it's better to give the vaccine into the wrong place potentially causing unknown damage to the individual it's better to do that better to potentially ruin the life or even take the life potentially of an individual than to waste one dose of vaccine so it takes the biscuit on two score two squats first of all should you draw back blood which is contradiction themselves because they say it's impossible but of course we know it's not and then they say you'd have to waste a dose of vaccine rather than give the drug in the wrong place all nurses are taught to give the right dose of the right drug via the right route to the right patient at the right time it's got to be via the right route these vaccines must be intramuscular but this letter is saying oh well if you do happen to give it intravascularly into a blood vessel then that's better than wasting it is that what they're saying if i'm wrong mr or miss mp come on and tell me please um seriously because this sort of what i see is fobbing off is just completely uh unacceptable okay that's um that's a bit of a run but it's not really it's based on so it's based on grey's anatomy for goodness sake and and that that that illogical non-sequelae argument is just bizarre um now don't forget um a few of you have been asking books are still available completely free um download them uh my books one on how the body works one and how the one on how the body works one on how the body goes wrong get it right john um uh this one there's still hard copy available if you want that in hard copy this one i need to get around to reprinting it but it's just a matter of getting around to it but they're both available in um for free free uh free pdf download for all the you know you can not once a bad epilepsy there for example so um yeah download them there's a mobile phone friendly version download them put them on your phone next time you're bored get out your mobile phone and you won't be bored anymore hopefully right okay that says which camera remind that's it thank you for watching
Up Next
8:14
Drug Metabolism Explained: Phase I and Phase II Reactions
@PillWhiteboard
283.6K views•2017-09-23

50:12
Bacterial Communication: Quorum Sensing and Biofilm Formation Explained
@JHUAAP
12.6K views•2011-06-28

5:35
Enteric Nervous System Explained: The Gut's Brain | Neurobiology Lecture
@alumniu6029
438 views•2018-09-12

7:08
Bacteriophages: Earth's Deadliest Killers and Future Antibiotics
@kurzgesagt
34.6M views•2018-05-13
Related Study Plans & Knowledge Roadmaps
Structured learning paths in Biology
biology
RNAi: Biogenesis, RISC & Gene Silencing
01Molecular Biology Foundations: DNA to Protein
02Introduction to RNA Interference (RNAi)
03Molecular Biogenesis of miRNA and siRNA
+ 2 more learning modules
10h5 modules
Explore Roadmap
biology
Mycorrhizae: Signaling, Biophysics & Ecology
01Foundations of Mycorrhizal Symbiosis
02Molecular Signaling and Root Colonization
03Biophysics and Bioenergetics of Nutrient Exchange
+ 1 more learning modules
11h4 modules
Explore Roadmap
biology
Circadian Clocks: TTFL, SCN & Periphery
01Foundations of Molecular Biology & Gene Expression
02Introduction to Chronobiology and Actograms
03The Core TTFL: Molecular Architecture of the Clock
+ 3 more learning modules
14h6 modules
Explore Roadmap
biology
Population Genetics: Math, Drift & Selection
01Genetic & Probability Foundations
02The Hardy-Weinberg Principle and Baseline Models
03Mathematical Modeling of Natural Selection
+ 3 more learning modules
18h6 modules
Explore Roadmap