




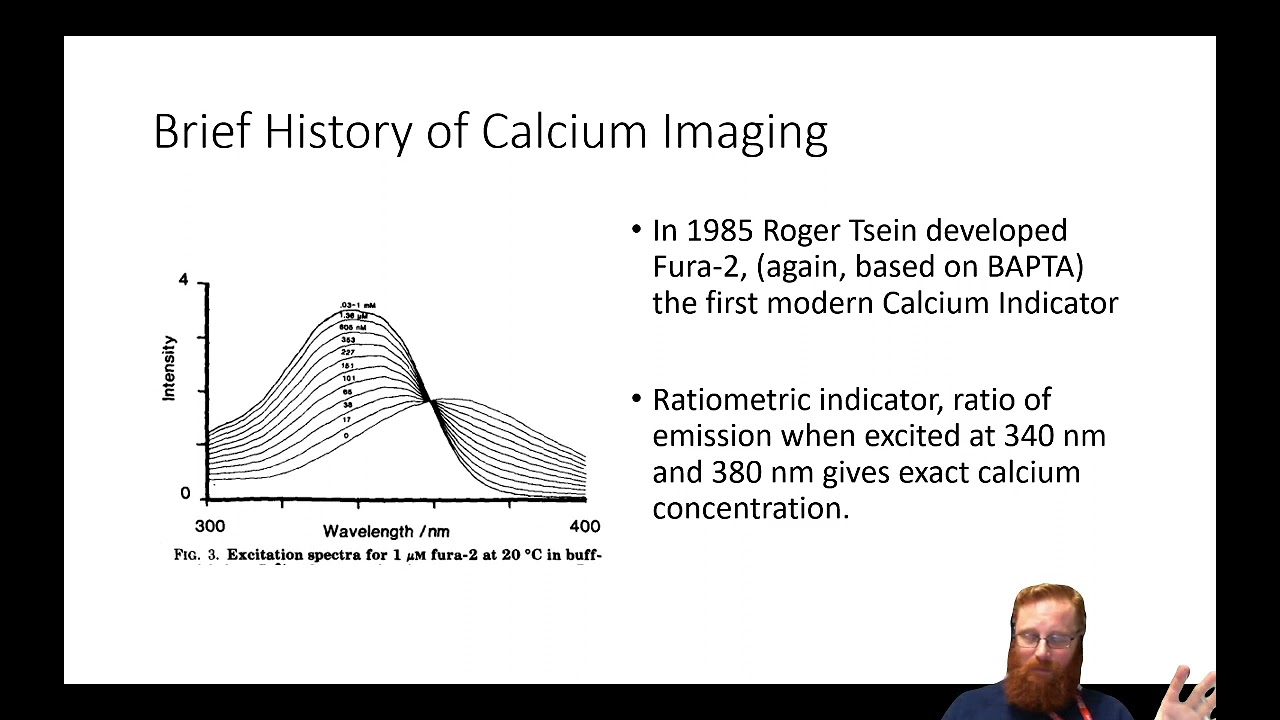





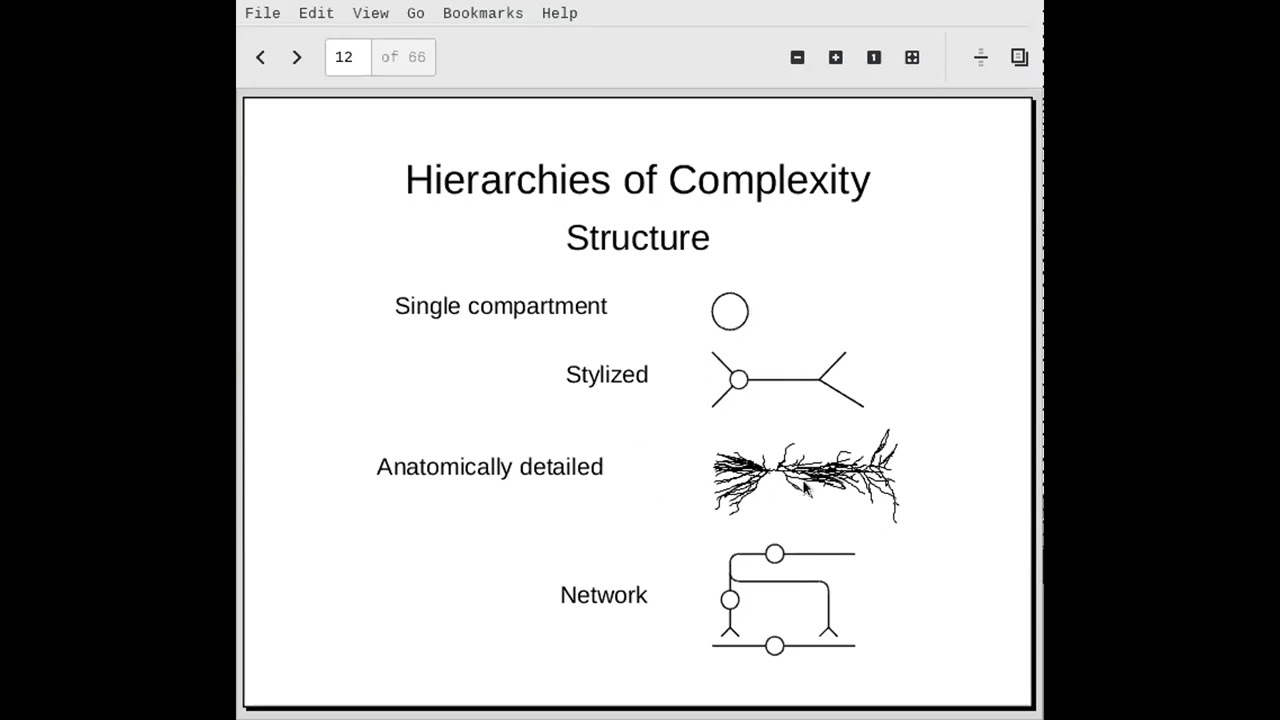
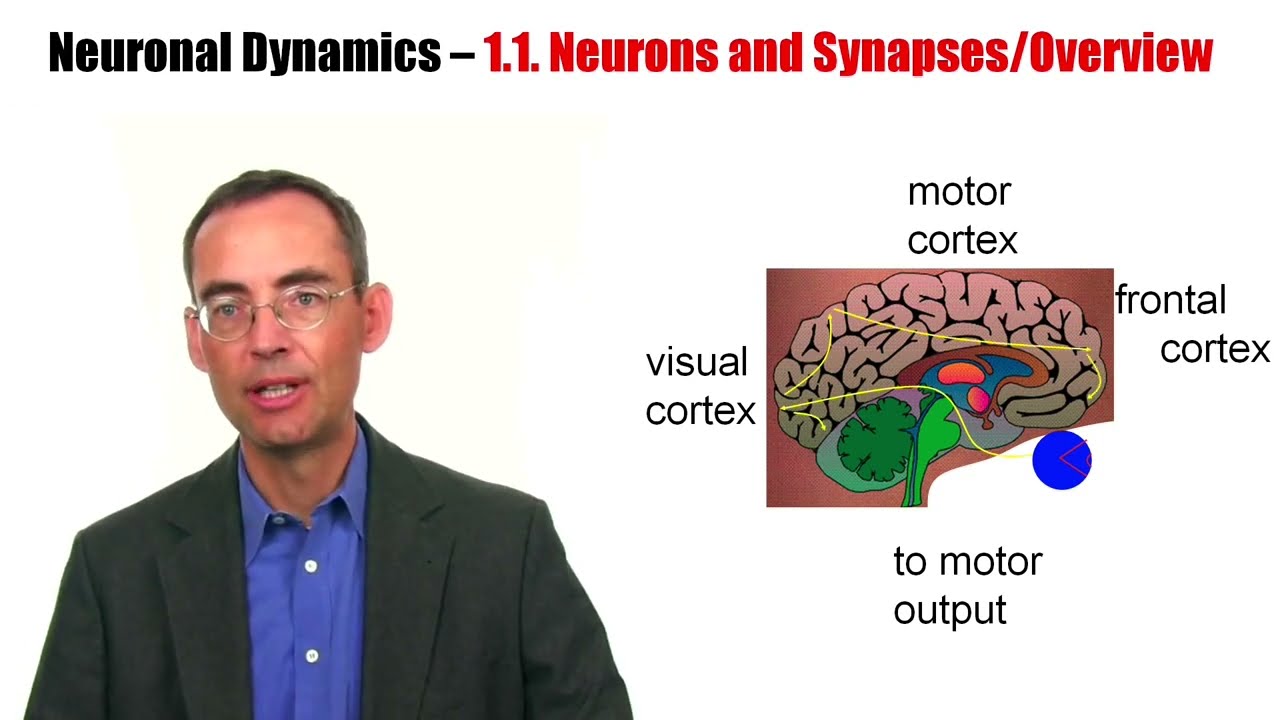




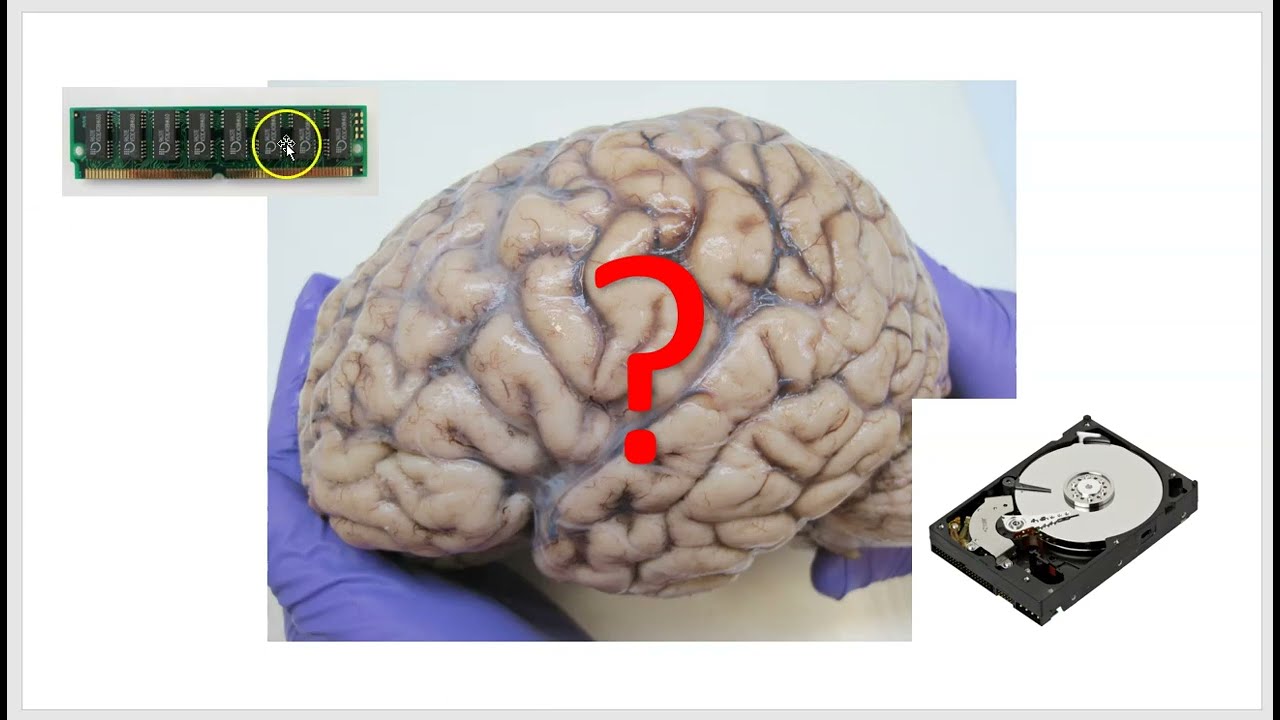

















Understanding complex neural circuits requires integrating multiple complementary approaches: large-scale imaging to observe neural activity patterns, connectomics to map synaptic connections, and computational modeling to generate and test hypotheses about circuit function. In the case of the zebrafish oculomotor neural integrator, researchers combined calcium imaging to identify active neurons during eye movements, electron microscopy connectomics to reconstruct neural circuits, and computational models to predict how connectivity generates persistent activity. This integrated approach revealed that recurrent excitation within each side of the brain maintains persistent activity, while recurrent inhibition coordinates the two sides, demonstrating how combining physiological, anatomical, and computational methods provides deeper mechanistic understanding of neural systems than any single approach could achieve alone.
Cracking Neural Circuits: High-Res Physiology & Connectomics
Added:we're delighted to bring you this seminar presented by lab roots and in collaboration with the National Institute of Health welcome to our track on the NIH brain initiative a multidisciplinary approach to neuroscience we're glad you can join us for today's panel presentation titled cracking and neural circuits function through high resolution physiology connectomics and computational modeling it's my pleasure to introduce a panel of experts who will be speaking on the topic of advancing human neuroscience for a full listing please click on the tab at the top of your screen if any questions arise during the presentation we encourage you to submit them in the Q&A box our speakers respond back to you via email as a reminder this presentation is educational and offers free continuing education credits click on the continuing education credits tab located at the top right corner of the presentation window and follow the process to obtain your credits please join me in welcoming our panel of experts thank you for joining us my name is Imran oxide a few things become abundantly clear when we look at these beautiful drawings from ramona qahal of Golgi stain neurons in the brain one call is a master obviously - the brain is extremely beautiful three neurons and the networks in which they are embedded are frighteningly complex one of the Grand Challenges today I think is to understand this complexity understanding this complex complexity is important not only for our ability to be able to better treat diseases like epilepsy or Alzheimer's but also to make advances in artificial intelligence where artificial neural networks are inspired or derived from our understanding of biological networks networks or our exploration of neuroscience now has a number of tools available to it on the physiology side we can use auto physiology opto physiology can use quantitative behavioral analyses a variety of anatomical tools and a range of computational modeling tools however each one of these tools by itself only looks at a facet of the complexity of the nervous system our approach has been to treat these tools as complementary and to try to apply the tools and as much as possible the same setting so that the results from the efforts with one tool can be quickly translated to the results and compared with the results of efforts with another tool this tightly coupled approach of course requires a tightly coupled and integrated team my laboratory focuses on physiology and behavior large-scale imaging targeted perturbations our efforts in laboratory for this project and what we're going to present today has been contributed primarily by Alex Ramirez Sebastian Seung's laboratory uses the tools of serial section electron microscopy and connect omics and we're joined today by one of the principal individuals in his laboratory who has led that work Ashwin Vishwanatha mark Coleman's laboratory focuses on computational models and network inferencing and we'll hear today from Mark about a lot of the work that Alex Sood has done the plan for today is that first mark will provide an overview of the questions that were most interested in and a theoretical background and the theoretical underpinnings of our experimental efforts i will then build off of some of the predictions and background that he gave and give you recent results on the physiology and large-scale imaging that we've been able to accomplish in the zebrafish that will feed directly into the efforts of the CERN laboratory that will be presented on connectomics links between various neurons and within populations and then Mark Coleman will come back and incorporate these data into the models that were introduced generating new predictions I will then summarize and the end with a few words Marco Luque so the core scientific question we're going to be addressing today is how did neural circuits hold on to a short-term memory to motivate this I want to show an experiment from Renault fo Roma's lab on delay activity in the prefrontal cortex in this experiment a monkey had a vibration of a given frequency applied to its fingertip there was then a delay period during which it needed to remember the frequency of this stimulus because after the delay period the monkey was presented a second vibration to its fingertip and it needed to say whether the second vibration frequency was higher or lower in frequency than the first vibration during these experiments they recorded from the prefrontal cortex and I'm showing you this activity here so shown in red is the trace of one neuron recording the prefrontal cortex the white dots on the top of the graph are individual raster's from many different trials of individual neuronal firing the red trace is showing the average of that smooth out and what you see is that during the delay period there is this persistent neural activity which we believe is holding on to a memory of the vibration frequency applied to the finger chip before times zero the reason that we think this persistent activity is encoding for the vibration frequency is because when they record following different frequencies of vibration applied to the fingertip that's shown here so for this neuron that was recorded following a low frequency vibration applied to the fingertip there was a low sustained firing rate and following a high frequency vibration applied to the fingertip there was a high frequency of firing a high rate of firing and you can see the traces in between where for intermediate vibration frequencies that had to be remembered again so that they could be compared to the and stimulus so this example actually illustrates the type of activity we'll be looking at and the Roma group and collaboration with Christian Machens and Carlos Brody also built a model for this which i think is illustrative of the history of the field and the basic conceptual idea for what we think is the mechanism for maintaining such persistent activity the key idea is that when a brief command like the vibration to the fingertip is applied and applied it causes currents to flow into a neuron but a typical neuron in isolation its firing that would go up in response to such an input but then it would come down quickly on some neuronal or synaptic timescale which is typically of order hundreds of milliseconds or less as opposed to the six second delay period that you saw in the task but of course we know that neurons are not in isolation they're part of networks and the basic theory of how this persistent activity is maintained is that when a command input comes into a neuron as looking at the neuron on the Left it begins firing but then that neuron can convey convey signals to its neighbors and receive feedback from those neighbors through positive feedback pathways these positive feedback pathways can be in two forms there can be recurrent excitation where the neurons that were initially activated activate themselves and other similarly tuned neurons and there also can be a double negative form of positive feedback where the neuron pool on the Left inhibits the neuron pool on the right which had previously been inhibiting them therefore causing a double negative form of disinhibition and again allowing persistent activity to be maintained and is shown in the bottom trace is a neuron receiving such Network positive feedback when a prep really tune can maintain persistent activity for a long duration much longer than the time constant of an individual neuron or sent ups so that's a motivating example we're going to actually show you work in a related system in terms of storing a short term memory but it's another type it's a different type of analog memory system and it's known as a neural integrator so just to review from calculus when I say integration I mean integration in the sense of calculus so shown the top of this graph is an input stream shown in red and then this goes through an integration and then the output shown in the bottom is the integral of this input and a reminder that an integral from calculus is just a running total or a sum sometimes just called an accumulator in the cycle lot in the psychology literature so when you see this first brief pulse of input go in the integrator accumulates that and then and then at the next time time period there is no input so accumulating nothing is staying still another input comes in it accumulates that then there's nothing coming in so it stays still and so on and so forth and the accumulation can be a positive inputs or negative which would correspond to inhibitory inputs as shown at the end so the key focus that we want to have today is that in the absence of input an accumulator holds on to its running total that is it holds a memory of the running total of its past inputs so integrators have been found to be encrypt incredibly prevalent in the brain underlying many different types of core behaviors in decision-making we believe that the core process of the decision-making is to accumulate noisy evidence over time we see evidence of this an individual neuron recordings and then the idea is that a decision is made when this accumulated evidence reaches a threshold likewise in navigation one of the key determinants of our position in the world is believed to be the integration of velocity signals indicating our movement through the world for the rest of the talk we're going to focus on a particular integration in the brain in the motor system and it's going in an area of the brain known as the oculomotor neural integrator and I'm going to show you a video of this activity here in the video what you will see is the movement of the goldfish's eyes the camera will zoom in and you will see that when there is no visual stimulus for the for the fish to track and its head is still you'll see that it moves in a period in a sequence of cicadas and fixations cicadas are rapid eye movements that move the eyes between one place and another and the fixations are just when the eye is held still video please okay so in the video I just showed you you saw the animals eyes moving back and forth this is a cartoon of the oculomotor neural integrator system for the control of eye position on the bottom is shown an eye trace corresponding to what you just saw the fish holds its eyes at one position then there's a rapid saccade to a neighboring position that's held then a rapid saccade again and so on and so forth these the Cod's are created by high velocity coding command neurons which have brief bursts of firing in this cartoon I have just indicated in a positive direction excited the output of excitatory burst neurons which move the eyes one direction and indicated with a negative pulse the output of inhibitory pathways which move the eyes the other direction what I'd like to focus on here is that in order to maintain the eyes which have spring-like muscles there needs to be a constant force in the absence of any signal that is to say when there is no bursts input when there's no eye velocity command in order to maintain the eyes at a given position there needs to be some persistent driving signal generated from the nervous system and it was identified many years ago that this is carried by an area of the brain known as the oculomotor integrator neurons and I'm showing a recording of one of these neurons here in the middle panel and what I'd like you to notice is that every time an input comes in the firing rate is mathematically integrating that is accumulating that signal to me to then go up to a higher persistent level of activity so again persistent activity in this system can be maintained an analog set of levels corresponding to the analog range of AI positions that can be maintained and it's storing the running total of the eye velocity input commands now for the rest of the talk I won't show you the firing rate traces but I'll rather show you tuning curves where we plot for any given I fix station the firing rate of a neuron as a function of I position so for an example neuron each of the dots here corresponds to one i fixation and you can see that the firing rate is very linear as a function of sustained eye position and I should note that all of the recordings shown are done in the dark so this activity is generated without visual feedback so it needs to be that the activity is internally generated okay so this is showing you one tuning curve of one neuron but in fact there's a whole population of neurons and there's a beautiful organization in the fish oculomotor system where the right side neurons are like the ones I showed you that is the firing rates increases the eyes move from left to right and then on the opposite side of the brain on the left side the firing rates decrease from left to right statistically the firing rates are equivalent here I have literally just done a mirror image of the right side neurons and we've done a mirror image of them to show the left side neurons but really they're statistically the same there's also we think from gross anatomy a beautiful organization of these cells so the cells are arranged on either side of the brain on either side of the midline there is an excitatory and inhibitory population on either side the end the interesting thing about these is they have exactly the connections one would expect from the theory of positive feedback leading to persistent activity that is to say on any given side of the brain there are recurrent excitatory connections that are the ones that we think could maintain excitatory positive feedback in between the two sides of the brain there are recurrent inhibitory connections those shown in blue here and that means that one side of the brain can inhibit the side of the brain that was previously inhibiting it again forming a double negative form of positive feedback pathway so given these this gross organization of the anatomy and given the known physiology at the time this was done in the goldfish we'll move forward to showing you our more recent work in the zebrafish we built a model trying to understand exactly how this type of persistent activity is generated and particular try to understand rate predictions for what the microstructure of this architecture is as well as understanding the core macro structure in other words is it the recurrent excitation which is the primary driver of the persistent activity or is it the recurrent disinhibition and I'll say that the history of the field had proposed for theoretical reasons that it was disinhibition but I'm going to show you that in fact we believe is two recurrent excitation within one side of the brain which is the answer in system so our model is sketched out here so in the upper right you see just a caricature of the model with again the four populations of neurons that I showed you there are about a hundred neurons in this brain region there's about we made 25 neurons per population and the key thing that we wanted to model was the firing dynamics of each neuron that is how does a firing rate change over time dr/dt and each of these terms corresponds to one contribution of that so there are intrinsic properties of the cells court characterized by the intrinsic leak that's minus F of r and then what's offsetting is intrinsic link and driving the cells is same side excitation we model that as a weighted sum with weight W IJ going through a synapse which can have a non-linearity s of the input R that is an input R is driving an input arch from neuron J is driving the output of neuron I through first to synaptic non-linearity and then an overall strength of that connection and we sum that up for all inputs likewise that we send that from the anatomy there is inhibition coming from the uppers from the opposite side which we model in the same way there is also tonic background inputs coming in to these and the burst commands represents those Socata commands which move the eyes from one place to another so the question is how out of a set of equations like this can one get an integrator and I and in particular how can one maintain persistent activity in the absence of reverse command that is when the burst command is zero we want to have persistent activity persistent activity would correspond to dr/dt equals zero no change over time in the firing rate and that occurs when all of these terms up to the burst command must sum to zero when they sum to zero dr/dt equals zero there's persistent activity in the absence of the burst command but what I'd like you to notice is if these terms all sum to zero then we have that the derivative of the firing rate is proportional to the burst command and if we have that the derivative of the firing rate is proportional the burst command then from calculus we have that the firing rate is proportional to the integral of the burst command so we fundamentally think that this is how integrators are kriya in the brain that is to say that integrators are created when there is a balance of excitatory inhibitory in recurrent chronic recurrent inputs and off that sorry recurrent inputs that offset the intrinsic leak and therefore allow persistent activity to be maintained and burst commands to be integrated so we set out to be to fit this model to data from the goldfish we actually built a conductance based model that was fit by a cost function approach and the cost function I won't go through the details but it had different terms in it which penalized different errors in modeling different aspects of the experiments so we have intracellular current injection experiments that I will not show the database of single neuron tuning curves that I showed you and firing rate drift patterns following focal lesions and we wanted to bring all these together within one modeling framework to be clear the knowns in this framework are the recorded firing rates and the intrinsic responses f of R from the single neuron current injection experiments the unknowns as in many systems are the synaptic weights and the external inputs also unknown is the exact form of the synaptic or dendritic nonlinearities at excitatory and s inhibitory and I refer you to our paper from 2013 to see the details of the fitting method what I want to show you here is just that the fitting method works so this is actually showing you on the top an example model in there on voltage trace from the full conductance base model you can see a psychotic input coming in with a brief pulse that drives an immediate change in firing rate of the neuron but then importantly what I want you to notice is before that first akattak pulse the firing rate was zero after the pulse you can see the persistent activity a second pulse comes in and following that second pulse it has been integrated because there is a higher rate of persistent activity we then just plotted the firing rates of neurons like this like this one it's actually I'm showing you a different neuron and that's shown in the lower left and the lower left you see firing rate as a function of time gray was the raw firing rate in the model black is what you would see in most experimental papers where we've run this through a smoothing filter just to make it clear what the pattern is and green is just highlighting a perfect integral so the MA is perfectly integrating the external inputs we could actually do this and nearly perfectly fit the tuning curve of every single neuron in our database of recordings and that's shown in the lower lower right so the lines in this case are the tuning curves from the data that I showed you the boxes are at each individual I position that the simulated I went to what the firing rate was plus the noise because we also tried to model the variability in this system which is a different story I will not talk about today okay so I want to now step to what insights did we get from this modeling exercise and the insights came most strongly from the following experiment and it was the inactivation experiment so in this set of experiments which came from which were done by Emery oxide and David tanks lab they inactivated the left side of the integrator while recording neurons on the right side of the integrator and what you see on the right side of the slide is the drift firing pattern caused by this now I want to remind you that the connections between the two sides of the circuit are mediated by inhibition so we said that to maintain persistent activity there needed to be a balance of excitation net excitation offsetting the intrinsic leak so if there was a balance of inputs allowing persistent activity removing the inhibition coming from the contralateral side of the circuit onto a given neuron we would expect to make the firing rates drift upwards because now they have bent their inputs are imbalanced by having a lot lack of inhibition so we expect again the find rates to increase and that's exactly what we saw at low firing rates however puzzlingly at high firing rates you can see that the activity maintained its persistence and that was not to be expected because again we expected to have a loss of inhibitory in a removal of inhibitory input and therefore we expected to have a firing rate drift upwards at all possible firing rates well we found that we could reproduce this in the model which is being shown here below under certain conditions so we found that we basically reason that when the neurons on the right side of the circuit are at high firing rates recall the tuning curves that right side neurons increase their firing rates as the eyes move from left to right left side neurons decrease their firing rates as the eyes move from left to right therefore when a right side neuron is at high firing rates that means the left side neurons in a fully intact circuit would have been at low firing rates so these high firing rates occur when the inactivated side would be at low firing rates however there still would be firing rates and there still would be activity so what the modeling suggested is that such low rates are below a threshold for contributing that is removing low rate firing is not sufficient to disrupt the persistent activity and there are many biophysical mechanisms that we considered for this for example a strong presynaptic facilitation could contribute postsynaptically something like an NMDA channel which is known to be prevalent in this circuit may need to be present in order to cause a NMDA spike and again that would have a threshold so there are many biophysical processes but for this talk what I really want to emphasize is that the low rates appear to be below a threshold for contributing and that allows stable firing act of activity at high frame or firing rates then importantly what this says is that each side of the integrator independently can maintain persistent activity on its own at high firing rates what we think the inhibition does is coordinates the two sides so that really the high firing rate side is the driver of activity and then that is just holding the other sides at its low firing rates and really the the low fine right side is the follower I now I wanted to step back and put this all together and say what does this imply about the question that I open with is it recurrent excitation or recurrent inhibition which maintains persistent activity in this system so consider as shown here network activity when the eyes are directed rightward when the eyes are directed rightward what we just said is the right side neurons are at high firing rate and above threshold for transmitting to their neighbors so this means that for example the right side recurrent excitatory loop would be press and that would be a form of positive feedback contributing to persistent activity but now consider those left side neurons those left side neurons we just argued are below threshold for contributing therefore even though anatomically they are there is a projection from the left of the right side we believe that when the eyes are directed rightward as highlighted by these dashed lines the functional connectivity is such that there is no connectivity going from the left to the right again the left side is at low rates that we believe are below threshold that means there is no mutual inhibitory feedback loop between the two sides at any given point in time and therefore we believe that in a decent abyssion or the double negative potential form of positive feedback loop is not present so the conclusion is that excitation not inhibition maintains persistent activity and inhibition is anatomically recurrent but functionally forward visa is functionally feed-forward and this is actually going to guide some of our future experiments the other thing I want to point out is this picture right here is just a gross reduction of the circuit to just four populations as for lump sums but we wanted to understand what about the rich micro circuitry within each of these populations and when we want to do that we realized there was a potential problem and the potential problem is that there are about a hundred neurons in this circuit and therefore there are about 10 100 times 100 or 10,000 potential synaptic connections so that means in terms of modeling there's going to be a greatly over specified model what we call a non identifiability problem so we wanted to be able to say well what features of the connectivity are important and what features the connectivity are not important and can we formally say something about that from the experiments that have been conducted so what we did is we did a sensitivity analysis to determine which features of the connectivity are most critical and the idea is our model I mentioned was built through a cost function and this is just showing a cartoon cost function showing potential to the model cost function surface for two hypothetical parameters in this case the green direction if that parameter of the model which you could think of is something like a synaptic weight was changed that caused a great error in the model fit there is a strong curvature on the other hand in the red direction that is a direction which is insensitive if that parameter of the model has changed almost nothing happens in the cost function and that one is insensitive and could be tuned at many different values and still lead to the same approximately the same model performance the way we capture such curvature in a cost function is through the hessian matrix of second derivatives v squared cost v wi DW j where each of those w's is one of the individual weight parameters of which there are 5000 potential connections 10000 up to restrictions of neurons having to go to one side which reduces that by 2 what you can do to find out what the important sensitive directions are is do a principal components analysis of this matrix that is find the eigenvectors so an eigen vector of this Hessian matrix identifies the patterns of weight changes to which the system is most sensitive the most sensitive ones are the ones with the largest eigen values which corresponds from the strongest curvature and when we did this surprisingly we found that there were only four most sensitive components that a per neuron so for the fits to any given neuron and the fits and the components I should say were quite similar across the neurons so essentially what this is saying is there are really only four combinations of weights not individual age but four combinations or patterns of weights that were really important to maintain the tuning of this circuit and be able to reproduce the experimental data and that's highlighted in the next slide I'm going to go through this briefly but briefly speaking here is showing some of the sensitive sensitive directions and what is being shown in the top row here so take the top left it's the first principal component what this says is positive is making connections more or more excitatory or less inhibitory so the numbers 1 through 50 on the bottom is describing for one postsynaptic neuron it has 50 pre synaptic inputs 25 of those are excitatory 25 are inhibitory and what's being done in this principal component is raised is increasing the excitatory connections and decreasing or removing in addition from the inhibitory connection strengths and you can see below this if you perturb that direction by making this change in the weights it causes the fine race to run off to a saturation level the second most important component was what happens if one decreases excitation and then also decreases inhibition that led to what we can call a leaky integrator where you can see all of the activities below look like they are exponentially decaying to a single steady state and then there were two components components three and four which related to the specific thresholds of the neurons high threshold neurons versus low threshold neurons low threshold neurons firing throughout the eye position range high threshold ones ones that recruited only only through part only were recruit is the eyes move from left to right after the eyes and move through part of the range and in that case there were distinct patterns that if you perturb those disrupted those patterns that also led to drift patterns like the one you see below what I'd really like to highlight for you is on the right this is the tenth most important component out of the 50 components and you can see that clusters of excitatory and clusters of inhibitory connections were either turned up or turned down nevertheless perturbing but exactly the same magnitude vector magnitude as the other perturbations I'm showing you led to almost no change in the persistent activity and that seemed below why is that well ultimately that's because there are offsetting effects so if you think of a given neuron what we've done is we've effectively turned up excitatory input and turn up inhibitory input in a way that those cancel or maybe turned up some excitatory inputs and turn down other excitatory inputs and again a way that those cancel and when you think about these insensitive components it has a tremendous implication for how we think about circuits and what we really can conclude from any given circuit model often in modeling we like to put out our best fit our maximum likelihood model and I wanted to show you what do we think maybe is is you know a real issue for doing that and maybe how we instead should think about what the important sensitive directions are and really distinguished let those be what's important and just English that from directions that are insensitive and this you know whole framework we think really lets you say what was important what isn't important and this slide here really emphasizes what isn't important so what I've laid out here is the connectome you know in our model neuron this is again a hundred neurons they're organized in groups the red connections are the excitatory populations the blue are the inhibitory populations the first 50 neurons are on the left side of the brain the second 50 neurons on the right side of the brain so for example the upper left block would be talking about left side neurons connecting recurrently to each other and the examples connect them I show you on the left it is statistically something like all the all connectivity there's a little you know there are some details in there but basically everything is connecting to everything by contrast look at the circuit on the right in this case this is a circuit with very local connectivity and here we actually assign anatomical locations to each neuron in anticipation of the zebrafish experiments that you'll see momentarily and here this one you can see that the connectivity is clustered around the diagonal of each block for excitation so that corresponds to look spatially local recurrent connectivity now I want to show you the responses of neurons on the bottom so what I'm showing you here is actually just a pooled responses summing up all the right side neurons in black or summing up all the left side neurons in gray but it actually holds for individual neurons as well and again in both networks it integrates the pink and orange traces are just indicating a perfect integral and I would challenge you in a psycho physics experiment to be able to distinguish between these two literally every nook and cranny of these traces is essentially identical and that says that fundamentally here are two extremely different network architectures leading to nearly identical performance how can we explain some data like this and what's going on in the model and the way we explain it as we go back to thinking of our sensitive and are insensitive directions so what we do it did is we actually took the difference between the connectivities we took the connectivity on the Left subtracted it subtracted the connectivity in the right and then the differences between the two connectivities along the sensitive insensitive eigenvector directions and that's shown here so this is showing the difference between the circuits along each components so what you'll notice is that recall that there were only four sensitive directions that were important for determining the function in the output of this circuit and matching the experiments and these first four components that were important between these two circuits that I'm showing their difference is exponentially small note that the y-axis in this graph is logarithmic that means that the difference between these two circuits is someplace between e to the minus 8 and e to the minus 10 in difference that is these are virtually identical in terms of what's important for determining the function of the circuit the other components that are more different between them and lead to the visual differences in the Topman the topographic differences are along the insensitive directions the other thing that I want to point out is this says that we need to clearly dive in and do more experiments if we really want to understand how this circuit works we now have two very very different architectures and nearly all - all connected Network on the left and a very locally modularly connected network on the right so to summarize our lessons learn from this part of the talk first in terms of the gross anatomy and the gross structure of this architecture what we have shown is that recurrent excitation we is what we believe generates persistent act firing and the recurrent inhibition is used to coordinate the two sides that can generate their persistent activity independently but if we want to understand just what generates the persistent activity we really only need to understand one half of the network and we can look at one half the network in isolation because we know it generates persistent activity on its own that is a motivation for some of the experiments that we'll follow the second key conclusion from this part of the talk is that we clearly need much richer anatomical information to understand truly what patterns of excitation underlie the persistent fun thank you mark I think very nicely summarizes a long series of experimental work that allowed us to develop by a physically realistic and rich model of the system which then has led to predictions that really now forces us experimentally to take things to another level and to go to a high throughput strategy where we can look at the activity of many cells and the connectivity of many cells really in one brain at one time to do this what we have done is to transition to the larval zebrafish preparation where the small size of the animal the robust behavior of the animal in combination with tools like two-photon microscopy as shown on the Left have allowed us now to look at large-scale at mini neurons at high resolution so on the video we're gonna see at the right we're gonna show you multiple planes taken through the zebrafish brain in the live animal the green channel will show the nuclear localized G cam signal which is a calcium sensor a fast calcium sensor that serves as a good proxy for the firing rate activity of with a particular cell and you're also going to have on the red channel an indication of where the excitatory neuron the Goethe motoric neurons are located so with this now exquisite resolution and spatial coverage of large regions of the brain we can build beautiful dynamical maps of the activity throughout the oculomotor circuit during a behavior in this video we're going to see now we're going to look at the activity projected across the brain onto the horizontal plane at top and then onto the sagittal plane from all the neurons on the left and all the neurons on the right as the eye position is transitioning from one location to the other and I'll get into the details of what individual neurons are doing next but this is simply to illustrate the power of this approach along the broad distribution of activity profiles that you saw there one of the major classes were these neurons that show a step like change in activity or firing rate as the eyes move from one position to another of course a large contribution to that population comes from the integrator neurons there are also neurons associated with the motor system that we'll talk about in a second the traces at the top show the raster's associated with individual psychotic events from single neuron as you move from the right to the left and in the second row second box we're looking at movements from the left to the right the rapid transitions at time zero then are somewhat filtered due to the dynamics of the calcium buffering within the system but we know from simultaneous recordings with firing rates that these transitions are accurately reflecting the underlying changes changes in the action potentials next slide in the next slide then we see another type of activity that's prevalent within this population or in this oculomotor region and those are the neurons associated with psychotic events and they show a burst response very transient and very sharp at each individual psychotic event and through this exploratory process we have also discovered novel cells that we have not expected for example these neurons that show a long ramp in activity ahead of a saccade and we know from work that alex ramirez has done that these are involved and the planning of the next psychotic event itself by doing this large-scale approach we are now able to look at where these different activity associated neuron behaviorally associated neurons where they're located and that allows us then to start to specify the functional identity in the oculomotor circuit which allows it annotations that inform then they connect homeless work that we're going to see next so in this video what you're going to look at is the locations of cells that are increasing their firing rates with every movement to the left and increasing and maintaining the activity throughout the leftward fixation with some of the neurons that we see in that three-dimensional map we're able to identify simply based on the locations so for example the neurons that are at the right side of this image this particular claim taken fairly ventral in the zebrafish brain our cells that are residing within the inferior olive which is easily identified through its location other populations like the abducens motor neurons can be identified through registration between the functionally imaged brain and brains where neurons associated with different transgenic lines have been identified and where previous work has specified what type of role that neuron plays so here we can look at the mmx1 GFP line where motor neurons have been identified where we can see also the nerve that presents to the lateral rectus muscle that controls the eyes themselves and so the overlap that you're seeing in the lower portion of the brain suggests to us that the neurons associated with leftward activity and overlap with the teal signal of the cyan signal are in fact the motor neurons themselves other regions of the brain have not as well been as characterized as well those populations then we need to take a combined approach where we look at first some single cell structure function information where we label neurons that show a particular pattern of activity with dyes that allow us to see where their axons project to and so what you're looking at on the right are a population of six neurons that have been individually labeled and we can see their axons projecting to the abducens and these have now the appropriate anatomical projection patterns that we would expect of a pre motor neuron class that is involved in integration we can also now register this these maps with maps that have previously determined where different excitatory or inhibitory neuron classes are and we can specify which of the neurons that have the fixation signal are GABAergic which are glutamatergic etc we can also do targeted appellation experiments here ablating some of the cells within the rung mere 7 8 caudal portions of the hind brain and showing that as expected for deficits in a neural integrator the eye movements following ablation are quite a bit more leaky or drifting towards a neutral position than in the second situation in the control case in the upper before case we can also do transient perturbation experiments here using a fiber optic stimulate a low or dhalsim and a fraction of the cells within the Rumney r78 fixation zone and here now we see the expected deflection and I position sustained a deflection following a transient suppression of activity within the fixation neuron complex or what we think is the integrator neuron complex with him on year seven eight these combined strategies have allowed us to now identify throughout the oculomotor circuit a number of the key elements a number of the key players including the psychotic person ions the motor neurons the sticker the neurons cerebellar granule cells inferior all of us I showed you we've also been able to build maps of the projections between one group of neurons and another and uh outlines for us in broad terms the oculomotor circuit however we need to move beyond these broad outlines to answer the kinds of questions that mark was raised and for that we can now use the annotation that's been done it's a couple with a connectomics effort that's spearheaded by the work of Sebastian son hi I'm Sebastian so and we promised I'm going to tell you a little bit or at least introduce to you the idea of using connectfx to constrain models of neural network function so as Mark showed you it is beautiful modeling work his models make a number of predictions about both neural activity and the connectivity of the network for a long time it's been very difficult to get very precise information about connections between individual neurons but luckily the technologies of connectomics have they've come to the rescue there's been a lot of progress in recent years on methods of automated acquisitions of Ian volumes three-dimensional electron microscopy volumes and there's also been progress in applying deep learning and crowdsourcing in order to create reconsider actions of the neural circuits that are imaged in those volumes and in addition it's been possible to combine electron microscopy with calcium imaging so senior scientist Ashwin Vishwanath on is going to tell you about experiment in which as larvae zebrafish that was calcium image dendritic size lab that those neurons those exact same neurons were in is using electron microscopy and be constructed to give us information about circuitry so at this point I'll hand it over to Ashwin he's going to tell you the story of the circuits involved in ocular motor function thank you for that introduction Sebastian so as Mark had pointed out previously we would like to constrain some of the work some of the models that his work has generated and the gold standard for doing something like this is electron microscopy so with electron microscopy you have the resolution that first you know visualization of individual synapses so you can not only reconstruct the entire morphologies of neurons you can also you construct and see the puppeteer partners they're connected partners and so to do this in an automatic manner we use this contraption that was developed in the lab of Jeff Lichtman at Harvard essentially this machine is like a conveyor belt which collects sections that are being section on acetyl on an ultramarathon so every time the ultra microtome arm moves it generates a new section and these sections are picked up on this conveyor belt now we can collect many such sections and put it on a silicon wafer and we can image them under the electron microscope so to the left is the kind of the overview of one such silicon wafer where you can see small tiny dots and if you zoom into each one of these small small tiny dots you can see a sliver of or an individual frame of zebrafish and then from each one of these low resolution images you can then target the region of interest to be acquired at high resolution and for the purposes of this particular experiment we targeted on one side of the brain and this case it's the right side of the brain has a market previously pointed out we think that it's the recurrent excitation on one side is largely driving persistent activity so we chose to restrict our volumes to one side of the brain now we can acquire many thousands and thousands of these electron microscopic images we can stitch all these images together and put them together in a in a three-dimensional volume and since this animal was previously imaged on a two-photon microscope for a calcium for calcium indicator we can then correlate the same cells for which we have calcium imaging so we have function for these cells from two-photon imaging and find the same cells within the seed electron microscopic volume so - the two images that you see on the left one is from the two-photon functional imaging and one image is from the seal electron microscope and the red arrows over here are pointing to cell bodies for which we actually have calcium imaging so we have function and then we can locate the same cell bodies in the CDM and reconstruct them and also recover the morphology as the same neurons so now it is not enough just to reconstruct the neurons for which we have functional imaging we'd also like to reconstruct the who their partners are and so historically this effort has been kind of a very time-consuming effort because reconstructing you know some electron microscopy is is extremely hard it's not a task that can be undertaken by an individual or maybe even a lab but would need a lots of people in a large community and so to do this we returned to kind of automating this process and we we leverage the tools coming out from computer science world we use deep learning or machine learning assisted reconstructions so let me walk you through what exactly this pipeline looks like so we use convolutional neural nets or CNN's in this case and the pipeline looks something like this we start off with an image which is the raw image over here on the raw image of the e/m we then detect the boundaries for each one of the new lights inside this image so that's the middle image in the middle and all the pixels within the boundaries of one particular neuron are assigned to a single object so each color over there you see is a single object so now the cartoon that the pictures that I'm showing over here are all in two dimensions but in reality this process is happening in three dimensions so so by doing this process essentially we're reconstructing a large three-dimensional objects each each of them new lights that are belonging to individual neurons now we can we can do a similar such approach for even for detecting synaptic junctions so synaptic junctions are junctions where two neurons are communicating to each other and a classic hallmark of locating these junctions are postsynaptic densities or PS deeds so we we run another convolutional neural net on images to detect the PS T's and at each one of these locations we can then also assign who the presynaptic and postsynaptic partner of these neurons are so by doing this process we can not only reconstruct thousands and thousands of neurons within the e/m volume you can also then reconstruct where all the synapses are and you can also detect kind of the edges between these neurons so in essence you can you can think of this like a large graph where each neuron is a single node and you can and the synapses are basically the the weights and the edges between these nodes but there is one problem with this approach which is very often neural nets also do end up making mistakes and the mistakes typically happen in areas where maybe there was an image defect or the image acquisition was not perfect and so typically that manifests the way that manifests is for example if two objects needed to be connected to each other to form a large a single neuron and if there was an image defect then those two objects will be broken apart or sometimes they would be merged falsely so in essence we would like to kind of validate or we would like to proofread or the output of these deep learning methods are providing us and and to do this we turn to a crowdsource platform this is a this is a crowd-sourced effort developed in the lab of Sebastian son called I wire originally this was developed for reconstructing neurons from a retina database we have now repurposed this website to validate neurons that are coming out for just from a larval zebrafish so in essence so here's an image of the landing page of this particular website players can basically log in online and look at completed neurons like in the picture over here the balloon art and you know that you see they can then individually inspect each one of these nubs of the neuron to either decide to whether join more knobs to the existing you're on or remove mums from the existing you're on and they can do this in an iterative manner and may and and and this process is repeated over and over again until we build a consensus as to what the accurate representation of the neuron is and so once that's been done and experts look at it we then say that this neuron is validated and then we move on to the next neuron so using this process we have now reconstructed over 3,000 such neurons from a larval zebrafish right so so then we would like to so now it's another armed with this we have now about three thousand neurons like I said we would like to be able to classify these neurons so here's one example and I'm gonna present the same example as the abducens motor neurons that any ox I spoke about previously so the abducens motor neurons are motor neurons that project to the eye muscle so that directly involved in moving the eye so from the e/m we can reconstruct cell bodies we can reconstruct the dendrites and the axons that are eventually going to project to the modern humans we can also see that there for they're located roughly in the same area where we think that should look at in drama mears r5 and r6 so this is one way of identifying neurons by morphology so I'm calling this structural identification another way of identifying neurons is by their function since we know that abuse since motor neurons are directly involved in moving the eye we know that they should also have a functional signature of the eye movement that they're gonna make in essence if the animal was moving its eye and the animal had calcium reporters in there abuse motor neurons should also report eye movement and that's exactly what we see if you register all the reconstructions to a standard atlas the location where we see the abuse in smaller neurons and the green dots for example in the sagittal plane is exactly the same location where we see calcium signals for eye positions which is the black dots so if you look at the two coronal plans at each one of these sagittal locations you see that the locations of the cell bodies which is the green circles overlaps very nicely with where we see calcium imaging from eye position sensitive neurons so these are neurons that are active when the animal is moving its eye and that's exactly where we see the motor you know so this gives us confidence both structurally as well as functionally that the neurons that we've classified are in fact the abuse motor neurons so this is just one example of a population of neurons that we deconstructed but in essence we've done this process for many such populations and here is kind of a summary of the many different populations that we've reconstructed so far we have we have reconstructed and validated neurons that are belonging to the vestibular class of neurons so that's descending or Cavill neurons and media local neurons we've reconstructed axons from a psychotic person Yunnan population as well as the inhibitory neuron population and between the neural integrator population as well we've been able to kind of classify these neurons based on their morphology as well as their spatial location for example we see integrator neurons located in ROM Amir's four to six we also see in neurons in Ramah Mears 7 in a some of them have axons that say in the same side of the brain which is that a kind excitation that mark and initials shown in this model the blue the blue model the the blue cartoon and then we also have neurons that have axons that project to the opposite side of the brain that provided this inhibition which was the dead card from that market previously shown in the brain now we can put all of this together from each of the neurons from each one of these classes together in a matrix or the connectivity matrix the connectome such that each row over here R is the is the dendrite of a single neuron and each column is the axon of the same unit and each dot that you see is the normalized number of synapses from that particular axon to that particular neuron and so you can see that you start you start seeing some structure in this network you see that the psychotic neurons are projecting to the integrator neurons which is in blue and they're also projecting to the modern iran's you see that the vestibular neurons also project to integrate our neurons and the modern yarns and then you also see the integrator neurons that project onto other integrator neurons as well as the motor neurons so so as as was predicted by the theory and and this has been a kind of an open-ended question in the field for a long time is positive feedback truly a mode for excitation and our results seem to validate that fact we see a recurrent block just among the if you if you follow the diagonal you see that just a blue block which is the integrators have this large recurrent component another interesting feature that we see from such a such a connectivity matrix is this modular organization so we see different modules being created when you see the feed-forward so from the integrators on to the motor neurons you see some integrators exclusively talk to motor neurons whereas other integrator neurons exclusively talk to inter nuclear neurons so there's this modular organization and then even within the integrated recurrent block that red block you see that if you follow the diagonal you see that there is hints of this modular organization like what Mark had shown previously in one of his one of his experimental graphs so so that we have a fairly updated version of what did we think the the the oculomotor circuit looks like we've been able to identify neurons in each one of these key populations we also know the connectivity amongst neurons in these key populations and between neurons in these key populations with arm so now armed with this information in armed with the connectivity matrix we can go back and revisit some of the modeling and plug this kind of this weight matrix into the models and ask how exactly do the models perform okay mark over to you so thank you Ashwin so given this connect ohmic information we wanted to revisit our models recall that our previous models really only allowed us to draw very conclusions about the growth structure of the integrator but really didn't allow us to first look at the microstructure of the neural integrator and second our previous models were only focused on the neural integrator themselves and not on the other associated regions of the oculomotor hindbrain so what we asked to start was what if we just take a simple linear rate model this has some reasonable justification that there are linear tuning curves and linear firing rates and high background firing rates throughout the oculomotor system but also now that we're trying to look an expanded question we also just started with a simplest model which is a linear model and we took this linear model and we said what if we just directly put in the connectome as our weight matrix plus known signs of the connections from the physiology would that alone be able to reproduce the measured sensitivities to AI position of the oculomotor integrate of the oculomotor hindbrain neurons and remarkably I'm going to show you that it did so this is showing you what came out of the model and what you'll notice is across these four prominent populations that showed up in the connectome in which we analyzed you see that different neurons have different tuning curve relationships firing rate from versus eye position so in particular the integrator neurons are shown in dark yellow and those are the ones we talked about before we found that just from the raw connectome that the abducens motor neurons and the abducens inner nuclear neurons should have more sensitivity to eye position and we found that the vestibular neurons should have nearly zero sensitivity to eye position so we then after doing this went back and looked at the literature both in the fish and across different species and here's what we found so I should say just for truth in explaining this that we first had to fix one parameter which is we needed to take our model and for our integrator slope of the tuning curve there's a free parameter of how strongly the inputs connect to the outputs that was the parameter B in the previous slide and we just set our model prediction equal to the macaque integrator slope of the firing rate as a function of eye position however every other point that you see in this graph was emergent and what you see is that the predictions from the model just directly from the connectome match incredibly well with the actual measured sensitivities of neurons throughout the oculomotor system to eye position in green shown the goldfish and you can see that in black the model predictions are nearly exactly in agreement with the goldfish which is the closest species to the zebrafish that these were recorded on but that there's also consistency across the different species so I'm going to leave that there and hand this off to Emery to summarize what we believe we've learned from this project in its entirety and where we're going next thank you Mark in summary what we've shown you is a multi-faceted approach where we've been able to use large-scale imaging tools to functionally identify key circuit elements throughout the oculomotor circuit to use a large-scale connectomics approach to identify the key connections key circuit interactions between and within the elements identified above and we've developed a theoretical framework that ties together functional and anatomical data to develop a deeper mechanistic understanding of how this neural system functions we're also very interested in the prospects of doing combined light and electron microscopy where both molecular and ultra structural integrity are preserved and we think this kind of approach example here being developed in the Lichtman laboratory where they use fragments of Intent robot like fragments of antibodies called nano bodies or intra bodies that are able to penetrate through the tissue and allow for preservation of ultra structural detail provides the capacity to now at an individual neuron level identified a neurotransmitter class look at protein distributions that will speak to the neuronal excitability so together we think this information will provide a much richer dataset much deeper understanding of the mechanisms underlying circuit dynamics I'd like to acknowledge the following individuals from the laboratory and the funding sources listed below thank you for your time and we look forward to your questions and comments thank you for that outstanding presentation for additional panels on the NIH brain initiative a multidisciplinary approach to neuroscience please view our agenda on urban speech as a final reminder the panelists will follow up with any questions via email thank you again for your participation
Up Next
Executive Function: PBWM Model & SIR Task | Cognitive Neuroscience
@RandallOReilly
680 views•2020-06-03
Deciphering Neural Circuits Controlling Anorexia in Mice | Richard Palmiter
@AllenInstitute
2.3K views•2011-10-10
Adult Hippocampal Neurogenesis: Regulation & Function | Neuroscience Lecture
@Labroots
9.7K views•2016-03-16

How Exercise Benefits Your Brain: Science Explained
@TED
11.4M views•2018-03-21
Related Study Plans & Knowledge Roadmaps
Structured learning paths in Neuroscience