

![[이투스 과탐영역 엄영대선생님] 2026학년도 3학년 6월 지구과학Ⅰ 해설강의](https://i.ytimg.com/vi/HFth_DXZNHY/maxresdefault.jpg)








![[과탐영역 안성진선생님] 2026년 3학년 3월 지구과학Ⅰ 해설강의](https://i.ytimg.com/vi/vxKL-c2WBp4/maxresdefault.jpg)






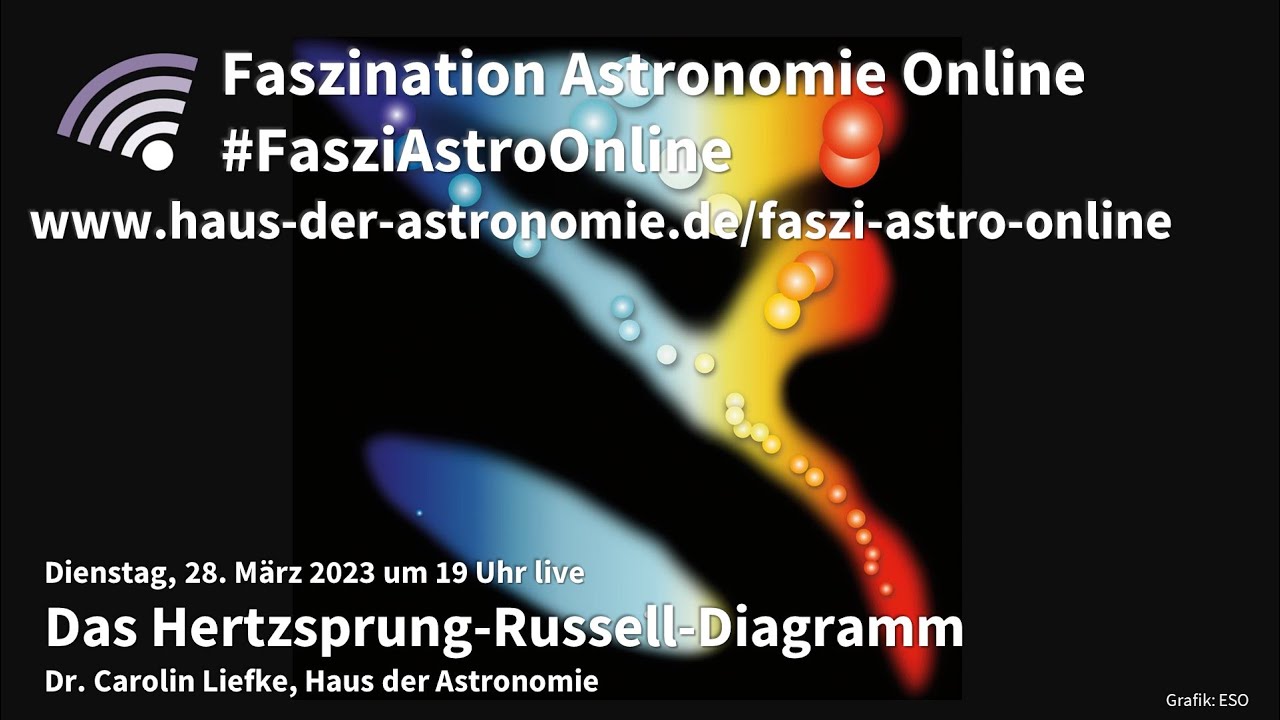









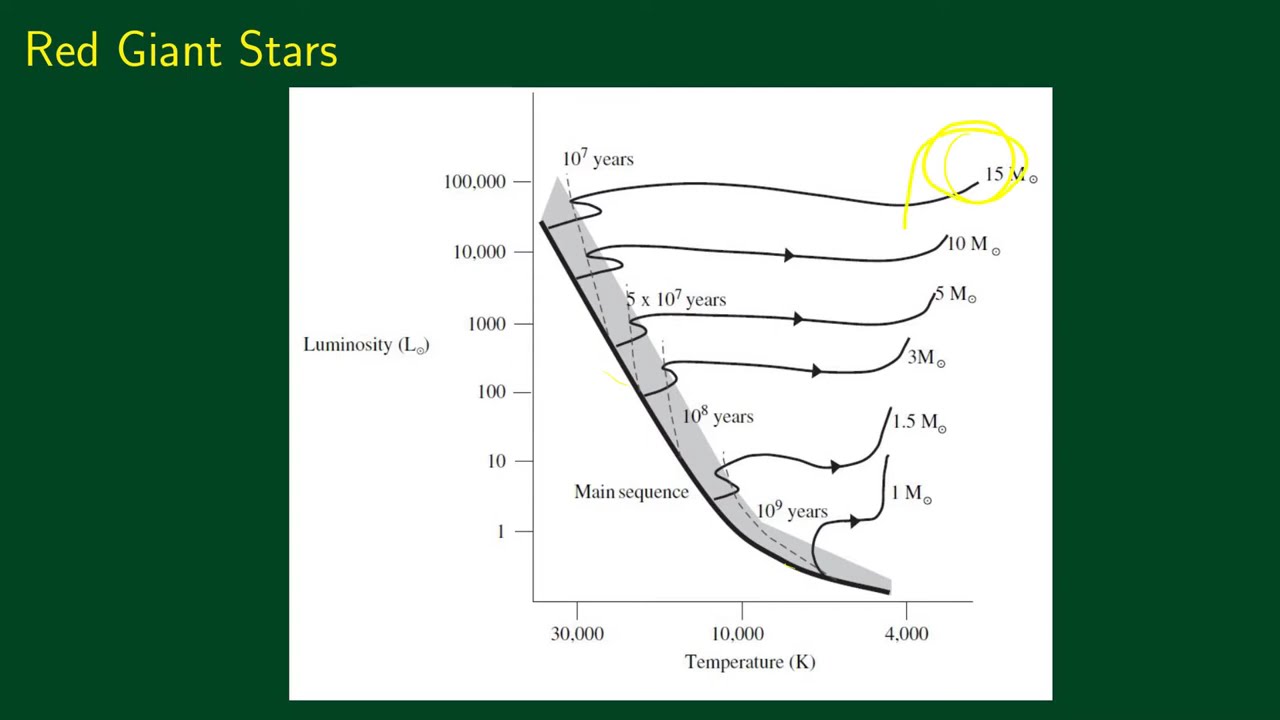
The Hertzsprung-Russell (HR) Diagram is a fundamental astronomical tool that classifies stars based on two key measurements: their absolute magnitude (true brightness, corrected for distance) and their spectral class (temperature, indicated by color). The diagram reveals that approximately 95% of stars lie along the main sequence, where hotter, brighter, and larger stars occupy the upper-left region while cooler, dimmer, and smaller stars occupy the lower-right region. Stars that deviate from the main sequence include giants (cool but very bright, hence very large) and white dwarfs (hot but not very bright, hence very small). This classification system allows astronomers to understand stellar properties, lifespans, and evolutionary stages by examining just these two measurable characteristics.
HR Diagram: Star Classification by Brightness & Temperature
Added:How do we know so much about stars even though? They are so incredibly far away [and] so today?
I wanted to concentrate on particular aspect of understanding stars And that is a diagram that is commonly referred to as the hertzsprung-Russell diagram Which is an extremely important diagram that helps us understand a lot about stars now there will be aspects I won't go into I'll discuss that as we go along and that will be subjects of other videos But I particularly wanted to do want to talk about the Hr. Diagram Now before we understand the hr. Diagram. We need to understand two measurements we can measure from stars. So here is a very famous image the southern cross over here and two stars that form part of the constellation of Centaurus and we have alpha Centauri over here and beta Centauri over here, and then we have the small constellation of the Southern Cross over here and It's pretty clear that stars have a number of features that are quite available to see and so first thing that you notice is that there are stars that have different brightnesses and so forth and Some are clearly brighter than others and secondly you will notice that stars at different colors so this Star appears bluer now this one a sphere stars appears as white and then this one is a little bit a bit of a color associated with it. And those are the two features. I want to concentrate on that help us understand the HR Diagram that is brightness of a star and the color of the star and the information that we understand from those two things So let's concentrate on brightness.
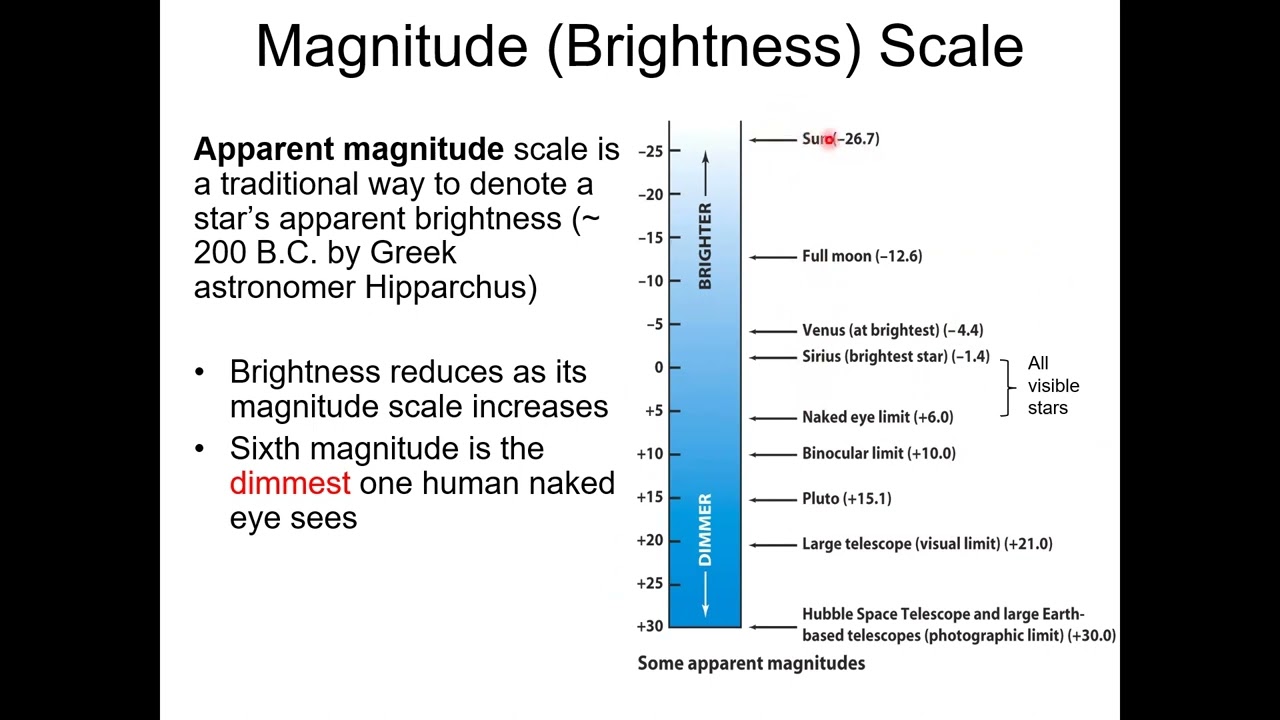
there's two aspects of brightness and the first thing is to how bright it just appears and Brightness initially was categorized by a greek called hipparchus and what he did was he classified stars From [one] up to [six] in terms their brightness, so one was the brightest star he saw and six was the dimmest stars or anything Beyond that of course He wasn't able to see and as far as he was concerned there was nothing beyond the one and so we had various categories Along the way of Brightness our Modern technology of course allows us to see further We are now able to go beyond that. So we can get brightness of stars that are beyond six because now we have telescopes to see dimmer stars So for example this image here, you can clearly see far more stars in this image Then you would naturally even in the best situation such as out deep in the country without light pollution if you were to look at the Southern cross and saw the pointed stars as I said alpha Centauri and Beta Centauri You would not see all this detail because simply our eyes aren't able to see that such low [sensitivity] and clearly you can go beyond this too, so for example as hipparchus looked at Northern hemisphere there are stars brighter than he saw and so we have numbers that go beyond that so we can even have stars that have a Brightness of a value that [is] brighter than one so even into the negative values But before we go on we need to also discuss a different terminology here and so what Hipparchus is now referred to in terms of the scale of brightness is a term that we know as apparent magnitude in other words. How bright does it appear? What is the magnitude in terms of appearance now?
This scale is now slightly adjusted based on that the five jumps over here is equal to 100 times brightness So for example star that is classified as a magnitude of one is a hundred times brighter than a magnitude of six But that will [be] a discussion of another video in terms of the details But the other real big issue to understand is that this is how bright something appears and In other words if we look at for [example] these [two] stars they appear Roughly equally bright now alpha Centauri has an apparent brightness of 0.1 and Beta Centauri has an apparent brightness or apparent magnitude of 0.61 which means it's slightly dimmer but the problem is is that what it doesn't take into account is the distances of these stars. Now if I were to take a candle and hold it up like within 10 centimeters of your eye then that candle will appear much brighter than let's say a floodlight That is 100 meters away Even though the candle is inherently less bright than the floodlight And so we need to adjust this apparent magnitude to account for the distance now to give you a perspective Alpha Centauri is 4.3 light years Okay, so in fact this system Here is the closest star [system], but apart from our sun beta Centauri even though it appears approximately the same brightness is 390 [Light-Years] away, so significantly further so clearly star must be Significantly brighter than this one, but of course the distance screws the situation up for us So we need to adjust that and in order to do that. We need to know the distance now I won't go into the specific details of how we determine stellar distances and in fact there are two methods for stars that are roughly around 300 light-years away unless we have a system called Stellar Parallax and any stars that are significantly further away We use a way of working at distances by referring to cepheid variables, but that is this topic over another video And you'll feel free to look that up, and I will probably organize to do another video based on how we determine stellar distances But needless to say we have ways of determining distances and therefore we have a way of adjusting The Star's Brightness to what we call it's true brightness, or it's true magnitude, and we call that the absolute magnitude.
So for example as I told you alpha Centauri has an apparent brightness of 0.01 and I told you that beta Centauri has an apparent Brightness of zero point six one and so clearly they look equally bright, but because this is further away We can now adjust mathematically again This is not a topic of this video, but if we adjust that we get 4.38 for the absolute magnitude for alpha Centauri, but -4.53 for this one, so this is significantly brighter in reality So this actually reflects the stars true rightness as opposed to what it appears So that's brightness for you now. We can classify stars according to their brightness However, here is again a southern cross and even in this case you can even see more resolution and more stars secondly though we need to look at color and it is clear [that] this star is a different color [to] let's say this star and Why is it different color? Well color actually gives us an indication of a Star's temperature now?
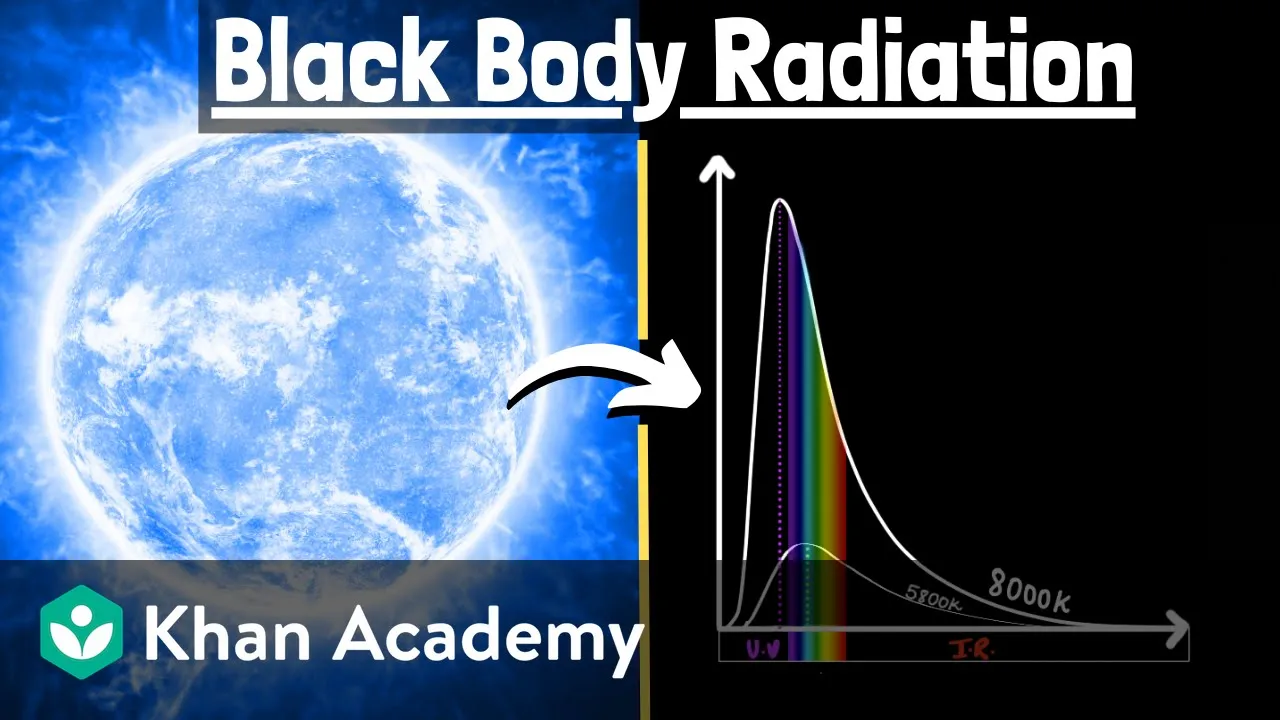
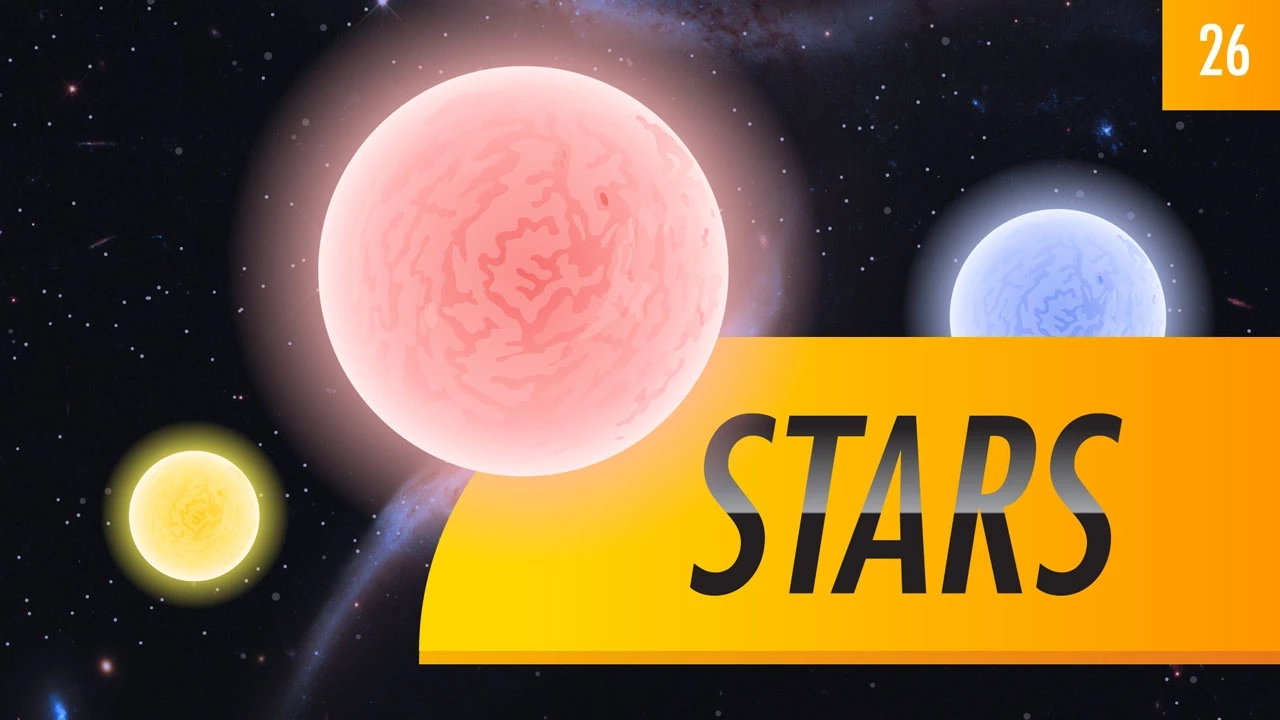
I have a video already where I discuss stellar classification and also one that discusses Wien's law but we have a way of understanding the temperature of start by examining the color of the star and So once we have an understanding of the color of the star we can determine its temperature and as a result we know that stars can have a varying temperature of anywhere between 3,000 Kelvin up to 50,000 Kelvin now We are talking about of course the surface temperature of the star internally [its] [into] millions of degrees Kelvin We now have a range we can now classify stars According to the color in terms of the Cooler stars into hotter stars and the Cooler stars will appear Redder and the Hotter Stars will appear bluer. We can then also have a different way of classification We have a system. Which is a letter classification. We give a star a classification of anything up from an O down to M and B, A, F, G, K, M and in between We can have an O1 or an O9 and the range and so forth we can have an F2 start and so Forth and one quick way to remember these letters if you want to is to remember a mnemonic That's quite old and a little bit sexist But it's one that stuck around basically for almost a century and it's basically Oh Be A Fine Girl or Guy and Kiss Me. So that's a way of memorizing the Classification system of stars according to the color or according to their temperature. So now we have two things we have Brightness that we classify star with and its color or its temperature So now let's start looking at a graph. So here. I have [a] graph unlike a normal graph We're going to actually have two sets of y-Axis and two sets of x-Axis the first thing we have here is Magnitude and that is specifically the absolute magnitude so star's true brightness And as you can [see] we start with really dim stars down the bottom [-] really Bright stars up the top Because the order of the magnitude is that the bigger the number is the dimmer it is we're following hipparchus initial classification system now we could also do that in terms of luminosity now luminosity is the amount of energy a star releases and It's obviously Related to brightness. So there is a slight mathematical difference between the two, but nonetheless. We can classify stars so our star our sun Is approximately?
[4.3] in terms of magnitude and so what this does is this number drip one?
Represents the luminosity of the star compared to our sun and so as we go up you can see we have because [of] our stars They're ten times more luminous than our sun a hundred times one thousand ten thousand hundred thousand and so Forth down here What you should automatically see that this scale is not a linear scale. It's a lot We call a logarithmic scale and so rather than going up in additions. We actually going up in Multiplication, so it's a logarithmic scale so clearly stars at a negative six in magnitude are significantly brighter than our sun more significantly luminous than our sun that takes care of the [y] axis What about the x axis well down here?
We of course have the stars according to their classification from O to M and at the top we have A similar scale that tells us the temperature and again that you'll noticed is that it's not a pure linear scale We have down this end hotter stars and down at this end we have Cooler Stars and up the top of course we have brighter stars and then the bottom we have here. We go by the y-Axis We have dimmer stars and clearly of course if a star is hotter it's going to be generally brighter as well But as we'll discuss in a moment there are other variables that determine the brightness as well So what happens if we [start] to plot stars?
according to this scale So what do you see in this case?
I've plotted Various points to represent stars that we have classified in our local area of our galaxy and this is not particularly accurate obviously But it does represent what we do get in terms of stars and the first thing you'll notice is that the majority of the stars seem to fit on this line in fact 95% of all stars fit on this particular line We call this the main sequence this almost classic s shape of stars So what does that actually tell us also over here?
We have stars that are not very bright And they're also not very hot so clearly they're also quite small. They're not big stars If we go up to the top of the main sequence these stars well They're very bright clearly, but secondly they are also very hot and as a result because they're bright and also They're very hot we know that these Stars Generally are large The other thing of course too to remember is that these stars being hot and [very] bright?
They are undergoing fusion at a really great rate And so generally speaking Their Lifespan is measured in 10 to the power of 7 years so they don't last that long which also explains Why we find fewer stars up?
in this range than we do down [here] if we go down the scale these stars have anywhere up to 10 to the power of 11 lifespan, so we're talking about a hundred billion years here They could survive so it's clear that being smaller and obviously Going through fusion at a lower rate [because] it's not as hot These have a longer Lifespan now our sun sits approximately Here in the scale, so it's a G class star. It's a G2 star in fact and of course It's luminosity is equal to 1 when it compared to our sun So that's the main sequence But then we have these stars over here and these few stars over here What did they represent these guys are clearly not hot stars? They're cool stars?
But they are very bright still in fact their brightness is equivalent to some of these blue stars over here So they're still very bright What would contribute to the fact that they are cool?
But also very bright well obviously what that means is that they are very large So these are we often recall the giants.
Now in fact you can go further into that we have actually these ones here which are called the super giants And then we have here who are the giants.
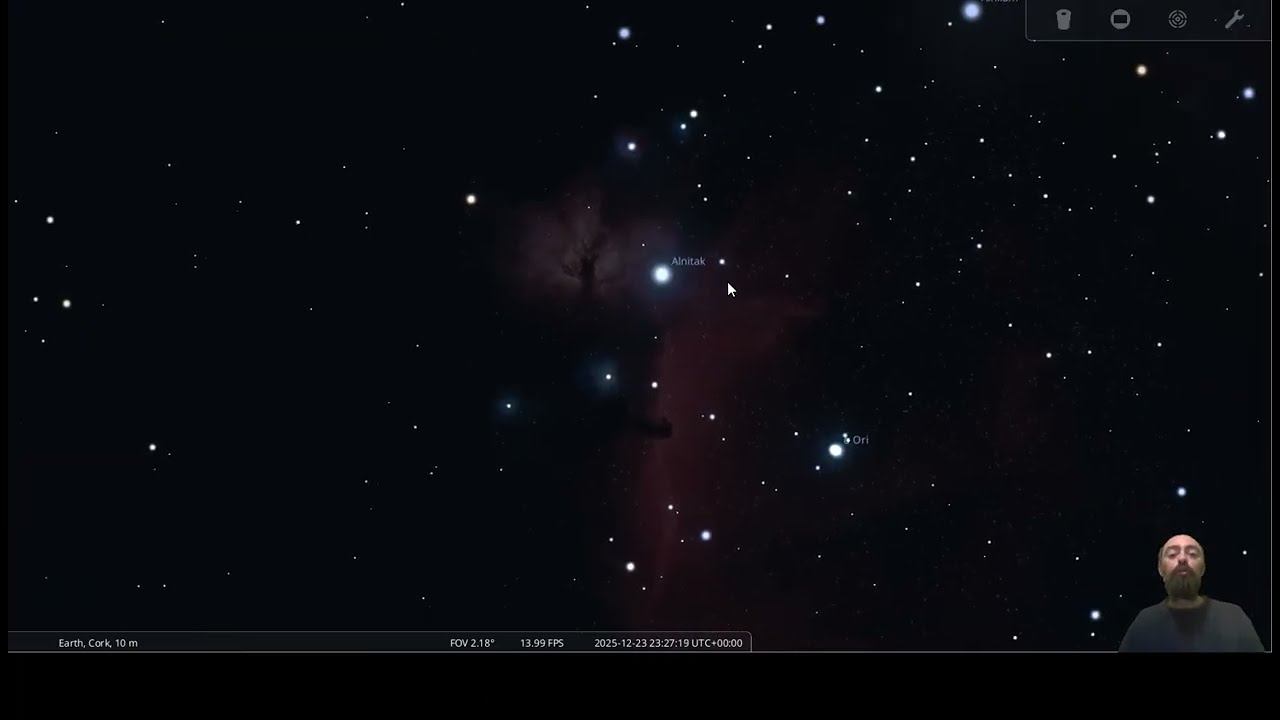
Over here, we have stars as well But in this case the star is extremely hot But it's not very bright so it's very hot but not bright why is that well there must be very small so these stars are what we refer [to] as white dwarfs and White dwarfs are extremely small now Let's give ourselves a bit of perspective to help us understand that so what about these large stars over here Well here is an example of the large star and so Rygel is a blue giant it's a b class star [B8] in fact It's very hot its surface temperature in [terms] of Celsius is 12,500 degrees It's in this range, and you can see that real compared to the sun it is large what about the giants over here and again if we [look] at the giants a good example is betelgeuse and betelgeuse can be found in the Constellation of Orion and it is extremely large. Now it's an M-Class star on M2 so it's not very hot 2,800 degrees Celsius or 5,000 degrees Fahrenheit for the American listeners and Diameter is about 400 times that of the sun now it is very significantly large if we would replace the sun With a betelgeuse, then betelgeuse would consume not only the inner planets, but stretch as far as jupiter So we're looking at a really massive star here But then they only other end of the spectrum. We have these guys and This is an example of sirius b. It's a white dwarf. It's hot but clearly it is very small and And how do we know all this? Simply because we can determine it mathematically by examining the stars magnitude and the stars color or temperature and therefore work out the stars size So that is the HR Diagram.
The HR Diagram as I said y-Axis deals with brightness with brightness up further high and dimmer further down and temperature with our hottest at The left hand of the scale and coolest in the right hand this scale if you got all the stars that we have in our Local area that we can measure we find not 95% will sit on to this area called the main-sequence With a few sitting in the giant space and if you sitting into the white dwarf phase over here I hope that's helped you understand the HR Diagram Thanks for watching bye for now You found that video useful and remember like share and subscribe [oh], and if you have a comment, or a [question] or your like a concept for me to explain [to] you Please drop a comment down below. [I'm] [paul] from high school physics explained. Bye for now
Up Next
Stellar Evolution: White Dwarfs, Neutron Stars, and Black Holes
@ProfessorDaveExplains
1.9M views•2018-08-24
First Billion Years of the Universe with the Square Kilometre Array
@iaaudc
121 views•2022-05-26

Kepler's Laws of Planetary Motion Explained (Educational Astronomy Video)
@Peekaboo_Kidz
404.9K views•2023-02-17

Gamma-Ray Bursts: Cosmic Snipers Explained | Astronomy
@kurzgesagt
15M views•2016-07-31
Related Study Plans & Knowledge Roadmaps
Structured learning paths in Astronomy