





![Strahlungshaushalt der Erde/ Strahlungsbilanz [Erdkunde, Oberstufe]](https://i.ytimg.com/vi/JU3t0pzB8UU/sddefault.jpg)
















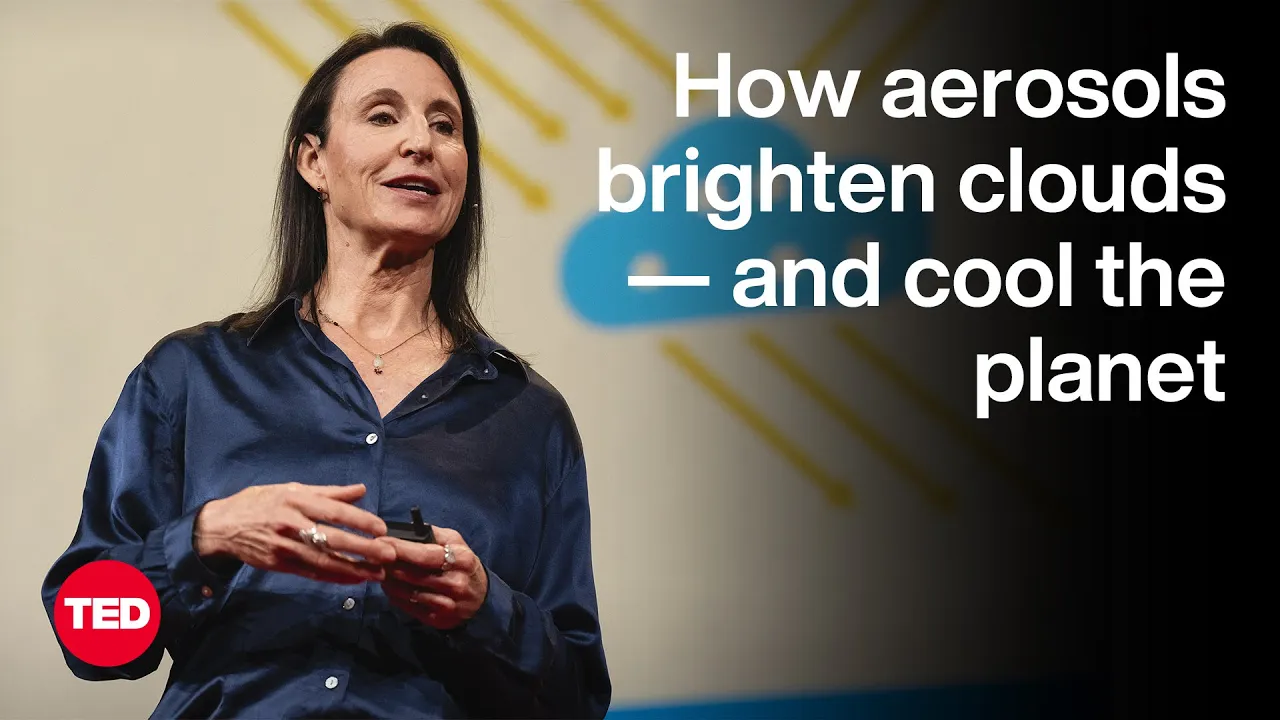


Aerosol-cloud interactions exhibit regime-dependent behaviors where the Twomey effect (aerosol concentration increasing cloud droplet number concentration and reducing droplet size) and dispersion effect (relative dispersion influencing cloud reflectivity) show opposite responses in aerosol-limited versus updraft-limited regimes; specifically, relative dispersion increases with aerosol concentration in the aerosol-limited regime but decreases in the updraft-limited regime, with the transitional regime showing peak relative dispersion values, and turbulent mixing further complicates these relationships by altering supersaturation profiles and enabling secondary droplet activation that affects cloud microphysical properties differently depending on the initial aerosol and vertical velocity conditions.
Aerosol-Cloud Interactions: Cloud Parcel Modeling and Observations
Added:questions okay now uh maybe I can start to talk about this so this is the overview of this lecture uh and uh the Arizona interaction skill sets from large uncertainties and this study will take the investigation into the details of their soccer interactions to reduce the uncertainties in the large scale models and to understand the discrepancies between the model and observations um this presentation is divided into two parts the first part is about the cloud indirect effect that is how the aerosol impacts the radiation by serving as the color condensation nuclei I mainly focus on the regime dependency of the well-known tummy effect and the relatively less known dispersion effect uh the second part is about the impact of the turbulent in treatment mixing on the cloud microphilics the Tommy effect describes that the increasing Arizona concentration cost is increasing Cloud droplet number concentration which has reduces the car droplet size the parameter we usually use to go to the cloud Japanese sizes the Japanese radius this word relates to the liquid water content and the cloud droplet number concentration also this effective radius can be parameterized in the format shown on the slide assuming the constant liquid water content and the beta the parameters describing the job later size distribution shape when we have the increased Cloud droplet number concentration then the effective radius decreases and then we will have more reflectivities and finally a cooling effect on the planet the linear relationships between the Arizona number concentration in the cloud droplet number concentration are started after Tommy's early work router at all in 2009 conducted a regime classification showing right figure here it is the vertical velocity versus the Arizona concentration and the black control lights show the car dropping number concentration uh they have the blue and red lines classified diagram into the three regions in the Arizona limited region that is the top top left part of the figure the cloud doubling number concentration depends more on aerosols but in the updraft limited regime the job leader number concentration depends more on the vertical velocity the transition regime in the middle shows the highly non-linear behavior on the vertical velocity and the number concentration the less known aerosol indirect effect is the dispersion effect as shown in the last slide effective radius can be parameterized in this in the formula shows on the slide previous studies show that the Sheep parameter beta can be calculated by the cloud relative dispersion which is defined as the ratio of the standard deviation to the mean radius the increase of the relative dispersion cost is increasing of 35 radius hence less reflectivity and the warming effect on the planet however the relationships between Arizona concentration and the relative dispersion is elusive some observation shows positive relationships and the level of the figures show but the other shows the negative relationship so the first scientific question this work will answer is uh whether the region dependency of this version effect helps to explain the contrasting uh dispersion effect the tool I'm using is a idea about your Cloud puzzle model for the password work and for people who not familiar with this kind of model this is a uh explicit being model uh by calculating the current job in the growth by the diffusional growth and the input of the model is the like initial the temperature pressure relative humidity and we prescribe the dry error Society distribution and areas of hydroscopicity parameter this one described how much the aerosol will absorb the water and also the vertical velocity as a theoretical work the vertical velocity is prescribed and is constant during this abstract Cooling and the key process this model will simulate is the constant app draft the delinquencies and the average sets of the aerosource and also the vapor diffusional growth and called the job late the output of the module is that we have the color microphysics properties like the supersaturation in the cloud parcel the droplet number concentration and the droplet size distribution uh here is the size distribution is represented by the lagrang gene particle being so we have the size concentration in the chemical composition of the particles for HP here is the result of the regime classification we conducted a thousands of partial model simulations and about and with the different Vertical Velocity and aerosol concentration the last figure is a reproduction of router's work black line separates the space into the three regimes the right figure extends the regime classification to consider the cloud droplet relative dispersion in the Arizona limited regime the relative dispersion increases with an a the Earth's number concentration and decreases with the doubled Vertical Velocity while in the updraft limited region operative chains are found Peak relative dispersion is found in transitional regime this finding provides a new understanding to the contrast observations and this work was published on Gio in 2015.
to further understand the region pattern biological velocity from 0.1 to 10 are chosen to investigate the relationship between the micro physical properties in Arizona concentration the cloud Joplin number concentration and C increases with an a rapidly when a is low but the level of 1 and a is high this is similar to some previous studies the positive relationship between the relative dispersion and an AR found one and a is low in the negative relationship I found one is high compared to the network job lead number concentration the regime dependency of relative dispersion is more striking with the non-monotonic behavior and the peak value existing in the transitional regime so with this feature we can quantify the transitional regime by the relativity dispersion here the vertical axis of this figure is the vertical velocity of the transitional regime and x-axis is the Arsenal concentration of the transitional regime the blood dots are from the numerical simulations red lines if the curve fitting of the blue dots serving as a quantitative equation varying in the transitional regime which is located between the two black lines defined by the principle previous work the routers or 2009 this equation can be used for Prime mineralization in the future now you may have the question why this happens why the relative dispersion increases when hours number countries is low but opposite um when the an a is high here is the explanation starting from the condensational growth equation that is a key equation used In This Cloud password model to describe the droplet growth of each particle beam here R is the particle radius and the SP is the partial supersaturation as K is the equivalent particle supersaturation close to their droplet that taking care of the uh the curvature effect and the solution effect from the collar theory for the cloud droplet and G is a function of the temperature and the pressure usually these factors influence the drdt less than the radius and the supersaturation First We Take the derivative of this Dr DT to the radius as the blue arrow shown there are two terms on the right hand side the for growing Cloud droplet the parallel supersaturation is usually larger than the equivalent uh particle supersaturation that's this one serves as a driving force for the for the water vapor condensed on the droplet the first term has a negative contribution to the derivative uh the skdr is usually negative for the cloud droplet then the second term has a positive contribution to the derivative the positive values of this derivative means the larger droplet grows faster than the smaller droplets than the uh Cloud then the droplet side distribution is broadened and the negative values of the derivative means smaller droplets grow faster than the larger droplets than the doubling size distribution Narrows here this figure shows that the rdt versus the droplet radius the slope of the line on the figure is the derivative as the equation show uh the similar Vertical Velocity we have the same Vertical Velocity for the three lines but the average number concentration may be different the green line corresponds to the other element in the region with a small and a and the red line current boundary transitional stream regime while the Blue Line correspond to the up driver limit in the region so we can see in the Arizona limited region a larger droplet has a smaller growth rate and in the updraft limited region we see the opposite trends of the lines the reason for the different signs of this derivative is in I is explained by the right two figures in the other limited regime passes super saturation SP is much larger than the SK then the first term dominates while in the after updraft limited regime the second term dominance when the positive derivative is caused thus in Arizona limited regime while some areas those growth in the condensation of narrowing The Wider side distribution in the cost and in the updraft limited region we see the opposition uh in current many calculations in the models the job equivalent simple saturation is ignored so the skdr is assumed as the zero this would cause the uncertainties for the simulation when the when the cases occur in the object limited regime and also probably you know like the based on the conversational Theory the size distribution Narrows when the uh when the job later grows but this research shows in in a case when the hours and number concentration is very high or the vertical velocity is very low then we have the different behaviors of the droplet population the results before mainly focus on the maximum super saturation height that is very close to the cloud base to uh gorging the droplet activation however the further growth of the cloud droplet above the maximum super saturation height is important for both radiation and also the onset of precipitation now the high dependency of the Arizona card interaction regimes I discussed in uh following a few slides these three plots show them in values of the vertical profile of each property with the ratio of the na2w in the ranges and showing the legend one dash line represents the RS limited region while called solid line represents the updraft limited regime and the black lines in the transitional regime in Arizona regime the parts of super saturation is larger than those in the app job limiting regime for the world and the job leader number concentration is limited regime hold almost constant but the difference is in height in higher levels in the object limited regime those are the most primarilizations are assuming job related concentration is constant during the growth of the car Parcels which is not the case for the UP travel limited regime and also the evaporation the activation happens in the updraft limited regime we have a slide later give you more details about this deactivation the relativity version in the bottom left figure differences with the height rapidly in the Arsen limited machine but the decrease is slower enough Dragon to further explain the behavior of this version I have the standard deviation and the mean radius here on this slide we can see the standard deviation decrease with the height in the earth's Elementary Gene indicating the narrowing of the droplet side distribution and the increases with the hiding in the updraft eliminating regime the reason is explained in the previous slides due to the difference between the partial super saturation the equilibrium superciliation then the Cloud job limiting radius increases with the height faster in the RS animated and slower in the dark job limiting origin so here this line explains the features in the app job limiting region about the deactivation this figure is an example of the Earth's Elemental regime in the top left figure the black line is the particle equipment equivalent super saturation of the smallest called Japanese and the cloud base and the green circle correspond to the smallest culture of lead as about one one kilometer being the Earth's Elementary region these two lines uh collapse each other so the smallest job inside that the cloud base is also the smallest at one kilometer as the black line shows but because the parts of super saturation is only slightly larger than equilibrium equilibrium super saturation this jobless evaporates and deactivate so the smaller the job list is another one the like the blue line shows it's a different particle beams however the job later will evaporate if the parcel goes higher because particle including the supersaturation is larger than the parallel saturation the two bottom figure shows the vertical profile of the growth rate in the same particle means as in the top two filters in the iris unlimited regime we have larger particles have a smaller growth rate while in the up traveling generation larger particle have a larger growth rate and this research also uh also shows uh similar things like this feature is called kinetic mechanism in the nanny's paper in some previous studies to further to uh see the importance of the equivalent equivalent uh supersaturation in the result we conducted a sensitivity research here uh we we have the dskdr assumed at zero by putting the equivalent super saturation of each droplet constant as a particular value then these five figures show the similar properties that we showed before although the path of supersaturation in the app Drive limitation is still higher but the job later number concentration holder constant for all the regimes and this version decreases with the height faster also for the other regions then the standard deviation decreases with the height so that confirms that the equivalent supersaturation is important about the few new features in the app Drive The Limited region now here is the summary of the regime dependency of the aerosol called interactions we have the Arizona limited regime as with the features we know before but in the object limited regime things are different so in the current Planet when we have the more and more pollution more and more aerosols so I think these features need to be taken here in the first in the future parameterizations in the simulation foreign so what I showed before is the model result now I'm showing a simple comparison with some observations to see uh how this model uh uh theory is uh similar to the observations now here are the uh 100 negative growing funerals during a recorder campaign this is a campaign supported by the department of energy us and we have the aircraft there to catch the micro physical properties and also some thermodynamic properties of the atmosphere uh here we have taking uh this uh uh growing cumulus and here I show the profile of the liquid water content doubling the number concentration and the relative dispersion the red side the mean values and the shading and the plus minus one standard deviation to uh to compare the model with the observation here we use the perturb the input for the model and the aerosol is based on the measurements from the uh two instruments and we do the curve fitting to have this log normal distributions we will perturbate some parameters to have a example simulation now this is the comparisons and the before both the red star and shading are from the observation the color dot line from the car puzzle model we see the liquid water content is large at the largest end of the observations this is unexpected because we use the adiabatic assumption and the real cloud is not and we have the perturb the cloud droplet number concentration almost severe to cover the range of the observations but the relative dispersion is smaller than the environments this is not too surprising because we have the previous study saying the instrument the mixing that one breaks the adiabatic assumption cause the broadening of the car droplets so when we use the adiabatic assumption this is expected to be smaller than the Maryland then this comparison motivates me to considering the instrumental mixing in the idea banking model then this move to the second part of the uh this study the turbulence in Germany mixing Alters the cloud micro physical properties like the lateral instruments of shallow cumulus as the right figure shows in this uh in this slide now the scientific questions I'm going to answer with the some uh following slides what are the impacts of the initial aerosols and the increment rate along with the cloud-based errors and concentration Vertical Velocity uh how the impact on the car microphysical properties and the second is how the different parameterizations of the increment rate of shallow cumulative Alters the color microphysical properties this is the uh car puzzle model considering treatment mixing uh the dry air in the area so that you treat in the cloud power so continually at the each step two parameters are used to represent this process the first one is in treatment rate which is defined as the mass fraction of the nutrient air here m is the mass of the on parcel and the Z is the height this parameter represents the intended in intensity of the instrument the second and prime minister representing QD aerosols during the instrument mixing process the number concentration of the particles in each particle being is calculated by this equation this is derived from the conservation law of the number concentration and here an AM is the job of the number concentration in the subscript I means the Ice Beam as we mentioned we use the beam models here a Lambda is in treatment raise W the vertical velocity and the sub uh subscribed in means this variable comes from the environment uh here we use the r function to represent the initial error so then the increase then in the equation then in trade parameter R5 we defined as the ratio of the interest to the total number uh error concentration the physical meaning of this Alpha can be understanded by these two special examples one alpha is zero that represents no interest R Source then the right hand side of the equation only includes the dilution effect during the instrument mixing when Alpha is one is representing two also balance the dilution effect in the particle number concentration does not change over the time these two special cases are used in the previous star days uh when they want to consider the instrument mixing and this brings some limitations to the parameterization uh supercellular as we say the supersaturation in the car person model uh is uh very important to see the how the cloud droplets grows uh in the model we use the water vapor mixing ratio to represent the moisture but we still calculate this super saturation to allow us to understand the processes this equation is shown here we after considering the treatment mixing we have three terms the first term is aw it's just the updraft Cooling and the second term is the condensation in the second term we have two terms in the bracket the first one is the condensation on the pre-existing particles from the cloud base this one is similar to the adiabatic model and the expression for this term is showing the r in the Box here like it is related to the growth rate of each particle copings in the total number concentration for the particle beams the second term here means the condensation on the intrigued hours of here we have the land that instrument read here and then usually are here to represent this term and the third term is the mixing for the temperature in the water vapor we have the this kidney is the temperature from the environment and the Purity is the water vapor mixing ratio from the environment now I show the super saturation on the left side to show how this variable depends on the Alpha and the Lambda the when we have the Lambda is zero uh Alpha and the Lambda is zero and the black line show here the equation drops to the adiabatical version with the maximum super saturation close to the color base then decreases in this height but when we have the instrument rate lighter than zero we have the supersaturation increases in the height in the higher levels not because during the dilution effect this n am is smaller and smaller with the height then the condensation term is relatively weak so when the single term is like weak so then we have the sauce term relatively dominant now we have this increased easily the height but when we have the r value from zero to the larger values we see that this increases with high relatively disappear until it decreases with the height of an alpha is two so then this feature tells us we need to con both consider these two parameters to see how the super generation change with height now I'm showing the housing path of the Lambda Alpha together and also with an AM supersaturation let me see first the Top Line top row shows the supersaturation uh the first figure should Lambda is zero the solid and the dash lines are from Two case the solid lines from clean case the dash line for the protein case while the landline is constant as we show in the like previous slide we have the supersaturation either increase with height or decreases with a higher depend on the different RFI values and now we also want to have the land that change with the other variables because in the previous data this one is not a constant values we use two ways based on Gregory's work we have the theoretically derived Lambda based on the buoyancy and the vertical velocity and also we have another starting from the this is a uh fitting or derived from the aircraft environment then they have a different formulas to calculate the Lambda we see the super saturation profiles are different from these two studies one we use this from the aircraft we see this increases with height and when we use this one we have the basic shape is similar to the idea that take assumptions about the values are different when we have the different initiative results when the super saturation is different it is not supplies in the Joplin number concentration is different so this is for the like I add with other factors are the similar only by varying the intrigued hours of we have the chocolate number concentration lines quite different from the different cases also we see the relative dispersion uh in this bottom line the most striking feature is the increases of this uh relative dispersion here that is because when we have the larger supersaturation then the smaller aerosols are activated this is kind of the secondary Activation so we have this jump of the rod in this version to the larger values foreign this is the summary of the second part we have the newly introduced parameter artifact that can represent the effects of being treated aerial results so the non-linear relationship between the new Traders or in treatment rate and the color microphysical studies are shown before and also the treatment of the enchantment rate and the vertical velocity in the car parts model in particular profiles of the microphysical properties and part of this work has been published in the GRL paper and the other are student preparation for another articles I don't include the detailed derivatives in this presentation in case this goes too long but if you have any questions I'm happy to answer thank you so thanks a lot Ching Chi for your presentation uh it is very for me it was really very interesting so I must say I'm not a warm Cloud physicist I'm a little bit overwhelmed of it oh I'm sorry this is of me because I'm I'm an ice person and yeah I know something a bit about warm crowds also uh but not in the detail that you presented it uh anyhow I liked it a lot and I opened uh the flow for questions now so who wants to ask something please raise a hand here in the reactions bottom button so I don't see a hand those but then I would like to ask you to go back to your first summary and maybe here it is yeah so this was for me it was a little bit too fast um yeah the others but if nobody asks then I can ask my stupid questions I'm sorry no no no everything is it's everything's fine it's uh so but but I'm not an expert here so I think and I also would encourage others who are not that deeply in one Cloud microphysics to ask stupid questions um yes so we have this nice diagram so I understand erosion number concentration uh versus Vertical Velocity and there you have the updraft limited regime the uh so that means if the updraft is low uh then the yeah what does it mean is if the updraft is low then the cloud drop number depends on the error more on the aerosol concentration and it stays low uh yes no when the up when the updraft velocity is low the car doubling number concentration is more depend on the updraft of velocity like if we change the vertical velocity the number concentration changes a lot and the aerosol limited uh regime so that means if there are not many arrowsers then not many Cloud droplets can appear even if the updraft is high oh yeah yeah right yeah it's yeah then the cloud doubling number concentration changed more with the Arizona concentration yeah it's more sensitive to the Arizona concentration yeah yes and uh but here you have now several points um yeah yeah usually the first points in the app draft in the earth unlimited regime tell us about the supersaturation we know that when the supersaturation is like there's the water vapor pressure like if it's the highs and the water vapor is more likely to condense on the drugs to have the different super saturation about the different regime it's usually correspond to the activation fractions are used a lot in the coming models the second body term is like the relationship how whether the cloud doubling number concentration depends on aerosols or vertical velocity that's different from these two regions the third one is this relative dispersion it matters the droplet inside the Sheep how Wild of the ship is or how narrow it is yeah so this one yeah I understand I understand the first points for the tourist regimes so this um the dispersion yeah sorry to ask no no it's positive for the aerosol limited regime and negative for the act of limited regime and it means uh the change of shape of the uh Cloud droplet price distribution but what does it mean if it's positive or negative one is uh one this is positive that means we when we have more aerosols when we have more pollution the side distribution becomes wider ah okay and yeah it's it's the the width of the um okay yeah yeah because the width is related to effective radius that will finally impact the radiation effect of the car okay yeah and the first bullet is we know the conversational narring maybe from our like microphysics class like well the large droplets glow uh slower and a smaller droplet grow quicker than the droplets is narrowing with the height but in the laptop limited regime it's different it's broadening is this one is now talked a lot in the previous studies is more majorly related to the prime mineralization because usually we'll assume the job related number concentration is constant then we use the constant values in the carbonate models but this research shows uh when the situation is in updraft limited regime we have the deactivation the activated particles can be deactivated back to the aerosols in the higher levels in this I've driven into the regime okay yeah thanks a lot for this extra explanation really it helps me to understand better and while uh we were talking that people started to write in the chat so we have a first question here by Martin conval and uh first so he mentioned great talk and uh then he asks if these three uh regimes have dependency on the distance from the cloud base uh this this regime is gorgeous as uh close to the carbon that is the maximum super saturation height and it is more close to the cloud but it's more close to the lower levels of the cloud than this uh regime dependency may be more evident because when you go higher when the ring starts and the whole stories could be different mom does that answer your question you also you can switch on your microphone if you want and oh he says thanks yes thank you yeah I think yeah yeah there will be some other um processes maybe depend I mean fully effective like coalition coalescence yeah yeah yeah thank you yeah so it is near to that cloud base yes this is more related to the droplet activation well if it goes higher when we have the Collision coalescence then the story is changing also if it goes higher we have the instrument you're mixing we have the dry uh ions intruding then the stories could be different yeah thank you yeah then we have a question here from high quebecs and uh because she types in her question because her camera and microphone doesn't work and properly so uh here is the question is about the effect of clouds on climate do you have an idea how real clouds might react in a future warmer climate compared to what is obtained by models now okay uh by rising and in my uh research I like in the future climate we mostly Focus the pollution the Arizona concentration we don't do many work about the warming things uh when we have more pollution when we have more irises here the clouds usually behaves a different like they can as the uh like previous the Thomas effects that we the clouds may have the smaller job in the reflect more on the cooling effect but this cooling effect is sometimes like overestimated by current climate and account models one possible explanations of this over estimation from our models is like we miss some Physics here we need some processes in there here this research is like one possibilities like when we may not consider the updraft elimination the behavior is there one and the in the future when we have considered more physics dear more processes here I think the coming models can estimate what happens with the microphones and radiation patterns then I have a follow-on question but um do you really think that the pollution with aerosols will keep on increasing because from what I know in comparison to 20 years ago or so then the answer pollution is decreasing so at least in the highly industrialized countries not uh in um in Asia and um yeah I don't have the proper English word for that in the newly developing countries yeah yeah yeah yeah yeah it seems there are some number condensation is a highly like uh different in different countries different accounting and so uh generally speaking I don't hope the pollution is worse in the future and yeah and about we this this research just provides a quantification what would happen if we have more the pro as the understanding the knowledge and what will happen in the future planning there okay thanks and also hiker she said thanks in uh in the chat are there more questions so this does not seem to be the case and so I thank you again for your nice talk what I like here uh in the I CCP Journal Club is the diversity of talks it's all about clouds but the topics are really different and uh yeah but that's what why we started the journal club and so our next speaker in four weeks will be seriously and Sylvia she will talk about uh something completely different then we moved to ice clouds and uh two perspectives so the title is two perspectives of ice microphysical impact on cloud radiative feeding um yeah we look forward to this and uh I think for today is there yes I'm here yes yeah if you don't have anything uh to mention now I think we can close for today can we or have I forgotten something yeah I think I mean we can add some extra time if people want to discuss uh but we can conclude officially and let's see yeah we could keep on discussing but uh if there are no further Christian then we also might close fortunately right why not yeah and thanks also to the audience for being here I hope to see you again okay
Up Next

Block Universe: Time, Relativity & Consciousness Explained
@Disculogic
51.8K views•2024-08-12

21cm Hyperfine Transition in Neutral Hydrogen: Radio Astronomy Basics
@AaronRobertParsons
12.4K views•2011-10-13

NMR Spin Physics I: Zeeman Effect, Resonance Condition & Larmor Frequency
@nptel-indianinstituteofsci8064
2.3K views•2024-01-17

Entropy and the Second Law of Thermodynamics Explained
@veritasium
27.5M views•2023-07-01
Related Study Plans & Knowledge Roadmaps
Structured learning paths in Physics