
















NetworkX is a comprehensive Python library for working with graphs and networks, offering functionalities to create, visualize, and analyze various types of graphs including undirected graphs, directed graphs, multigraphs, and directed multigraphs. Key features include adding nodes and edges with optional weights, converting graphs to adjacency matrices, visualizing graphs using different layouts (spring, circular, shell, spectral, random, planar), calculating node degrees, finding shortest paths, computing centrality measures (degree, closeness, eigenvector, betweenness), determining graph density and diameter, identifying Eulerian paths, detecting cliques, finding bridges, and analyzing connected components. This library enables researchers and practitioners to perform fundamental graph theory operations and network analysis directly within Python.
NetworkX for Graph Theory: A Python Crash Course
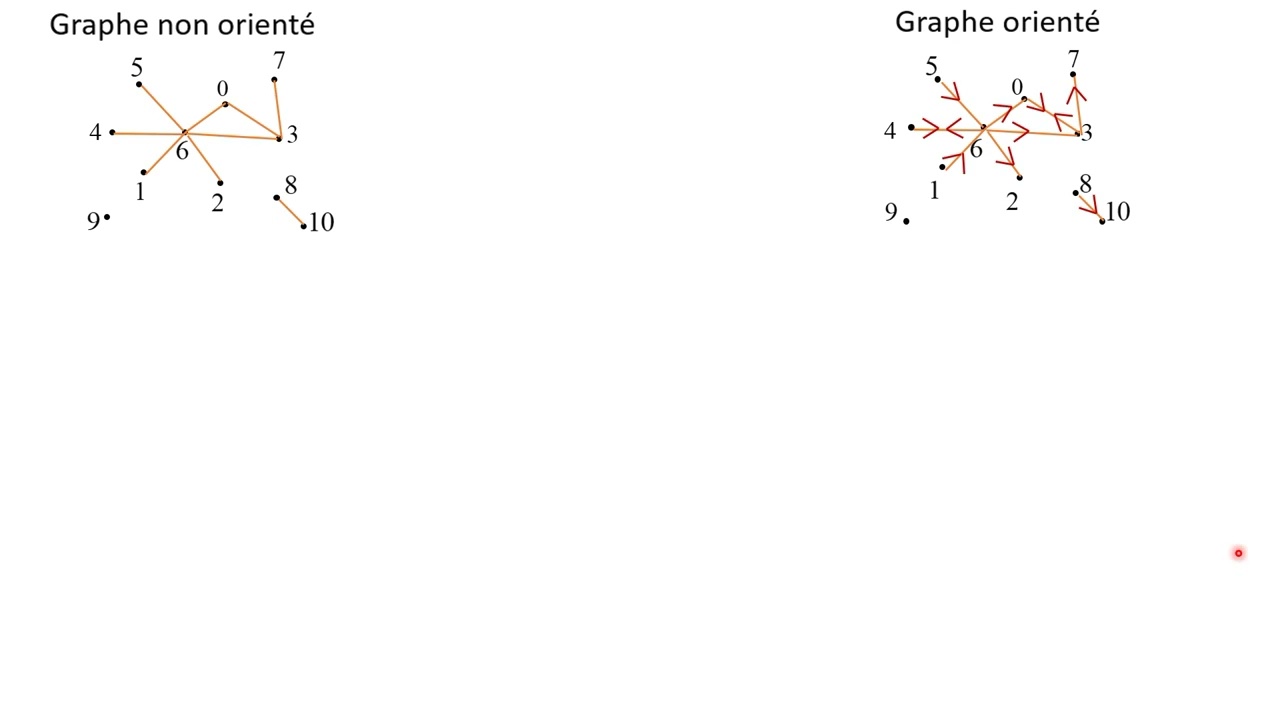
Added:what is going on guys welcome back in today's video we're going to do a crash course on the python package called Network X which is the package for graph theory for working with graphs and visualizing graphs or networks in Python so let us get right into it [Music] all right so Network X is a quite comprehensive python Library which means it has a lot of different functions it has a lot of different functionalities there are a lot of things that we can do with network X but in this video today in this crash course I want to focus on the fundamentals so using network X to do some basic graph Theory some basic network analysis to create graphs to visualize graphs to represent graphs in different ways to generate different types of graphs and stuff like that to calculate certain metrics this is what we're going to focus on in today's video and for this video I'm going to assume that you at least know some basic graph Theory so you understand what a graph is you know what the difference is between an undirected graph and a directed graph what the degree of a node is what notes and edges are in the first place stuff like that I'm going to explain some of the functions and some of the concepts as we go um as we talk about the different features of network X but I'm not going to explain graph Theory from scratch here here and there I might introduce some basic concept or explain some basic concept but I expect you to understand the basics of graph Theory so we're going to focus more on the implementation on the application of network X in graph Theory rather than on graph Theory itself so in order to use Network X we need to First install it we're going to open up the command line and we're going to say pip install Network X and once we have that installed we can go into our script and import Network x s and X this is the commonly used Alias now you don't have to use it but it's what everyone does so if you use Network X it's the same as saying import numpy S and P import pen as SPD you say import Network x s and X we're also going to import here matplotlib.pi plot splt so if you don't have matplotlib installed you can also install that using pip install matplotlib this is only used to show the visualizations that we create using network X and we're going to start here now by creating simple graphs like empty graphs just just the basic graph object without any notes and edges and for this we have different Constructors so the most basic one is to say NX dot graph and nx.graph is just a simple undirected graph so the edges going both ways we don't have directions it's just a simple undirected graph now if we want to have a directed graph we say NX dot d i graph so Digraph directed graph this then means that when an edge goes from A to B it doesn't necessarily also go from B to a because the edge has a certain direction namely from A to B um then we also have NX dot multigraph which basically means a graph where we have multiple edges between nodes so we can have double edges and stuff like that and we also have the directed version of that which is the DI multigraph or actually the multi di graph sorry so a multi-graph which is also directed because this one is undirected those are the basic four graph types that we can use here um that we have Constructors for and uh when we create such a graph let's go with an undirected one we can add edges um sequentially so I can just say here g dot at underscore H and I can add a new Edge from one to two for example so you can see the first parameter is U and the second one is V meaning one note second node and the good thing about Network X is that it um automatically recognizes since there is an ad from one to two I don't need to Define that there are notes one and two by creating the edge I also created notes so if one doesn't exist if two doesn't exist it's going to create those notes because implicitly we're defining them by saying that there is an edge between one and two we say that there is a node one and there is a node two um we can also provide a weight so we can say okay now there's also an edge from two to three and we can say that the weight of this Edge so the importance or the speed maybe uh which is not the same as the pi qt5 weight so let's remove that the weight of this Edge is going to be 0.9 and whatever you do with that weight is up to you you can say okay the uh the the weight means speed so the higher the weight the better or it means how strong the connection is uh or you can also interpret it as a cost function so for example uh saying that the higher the weight the more difficult it is to get from two to three or the longer it takes something like that um we can also do that with letters and the cool thing is we can actually pass everything that's hashable so we can say G add an edge from uh the string a to the string B for example this works we can also uh create an edge from B to B we can also um just add individual notes so we can say G at node C without connecting it to anything and whatever we want to pass we can pass we can pass anything that is an object in Python so I can go ahead and also say I want to add a note which is just a note print referring to the print function we're not calling it we're passing the print function the object The Entity of the print function we're passing it here as a note um this also works and we can then go ahead and visualize this graph that we now have by saying G or actually sorry not by saying G by saying n x dot draw and we have different types of uh of visualizations we're going to talk about those here in a second uh let's just go with draw spring we're going to draw the graph G and we're going to draw it with labels so with underscore label so that we see the names of the notes and then PLT show and when I run this now you can see that this is our graph this is our graph being visualized we have a connected to b b connected to itself one to two to three C standing on its own and the print function also as a note being its own uh graph sub graph you could say um or component so that's the basic idea we create graphs we add edges we visualize them that's the most basic thing we can do now instead of adding the edges like this we can also directly create a graph from the edges or we can add from an from an edge list so we can say for example we have an edge list and this is just a list of Two Poles and these two poles represent um edges so we can say one is connected to two two is connected to three three is connected to four three is also connected to five and then maybe forests connected to six and six is connected to seven so that's a basic Edge list and we can use that list to create a graph either by saying NX from edgeless that is one way to do that so we can just pass the edge list here and we can run this and then we have the graph or we can just we can just delete this and say NX graph and then we can say g dot at from uh add edges from and we can pass here the edge list so that also works um now what else can we do we can represent these graphs in different ways so this is The Edge list representation but we can also have an adjacency Matrix so an adjacency Matrix basically just means we have a matrix where um we have the individual notes listed as columns and as rows and when in a directed graph basically when you have the value one for a column and a row it means that the note which is the column has a connection to the node which is the row so if I have the column B and K it means that b is connected to K if there is a one in that particular field if I have K and B it means K is connected to B and if it's undirected it's always the same so we always have both being set to 1.
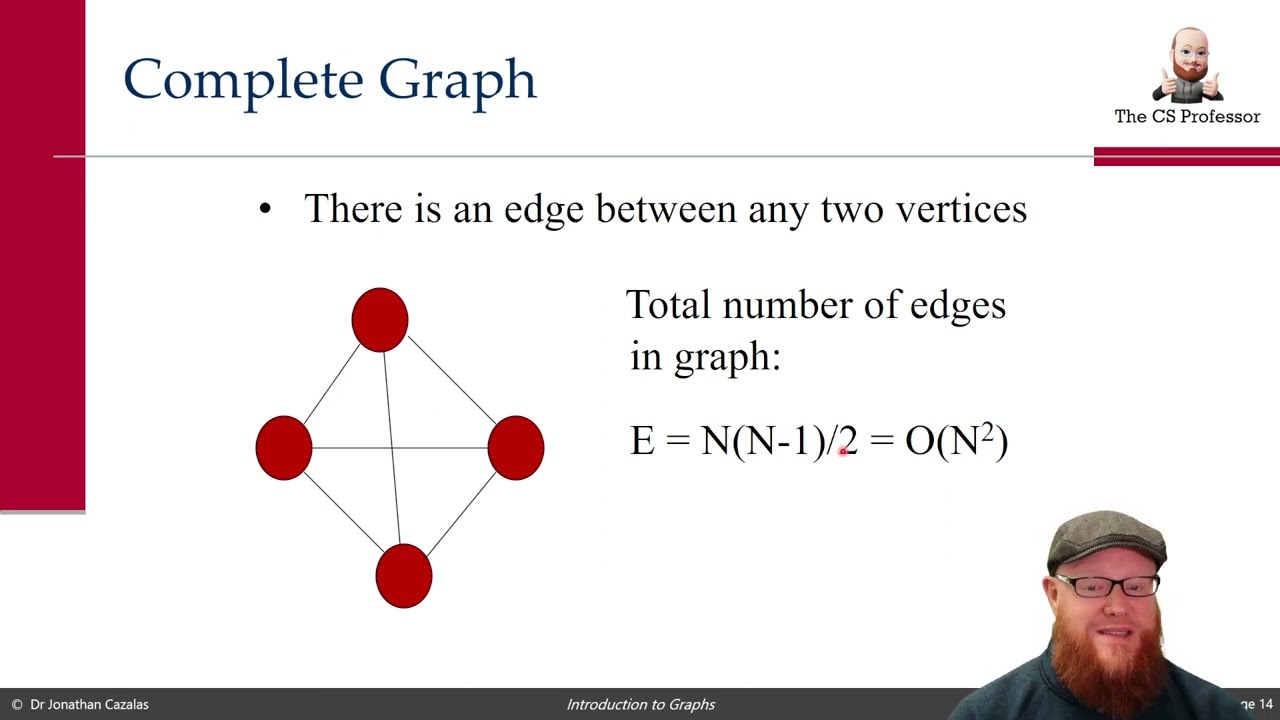
um that's the basic idea we can also just get this representation easily by saying um by saying here g equals or actually not g equals sorry print and then I can say um NX dot adjacency matrix of G so I create this graph from The Edge list and then I have here the adjacency Matrix this is just representing the individual indices um and what we can also do here is we can also create an adjacency Matrix using numpy which is another package that you would have to install so import numpy S and P so pip install numpy if you don't have it uh what we can do here is we can create an adjacency Matrix ourselves and then we can use that to create a graph so instead of adding from The Edge list here let's comment that out we can go ahead and say for example um NP dot array and I want to have a list of lists I want to have 0 1 0 and then one one one and then zero zero zero what that basically means is that this only makes sense for an for directed graph but this basically means that if this is a b c a b c it would mean that a is connected no that b is connected to a b is connected to itself um a is connected to B and C is connected to B but B is not connected to C uh that's what that would mean but as I said I'm not going to explain these basic concepts here in too much detail and we can just say now NX Dot um from numpy array and then like this I hope that's enough no this does not seem to be enough what did I make wrong here um I created the array from numpy array let me just see where the problem is okay I need to to fix that here okay that's a pretty obvious and stupid mistake we are creating an empty graph after creating this one so it doesn't display uh this one but the empty one so let's just run this again uh and now we can see that this created this graph so we have one being connected to itself one is the second one because we have a zero as well so we can see here the diagonal one being connected to itself then we have uh zero being connected uh to one one being connected to zero um and I think since this is not a no this is not a directed graph so it doesn't actually matter uh the directions but this is how you can create a graph from an adjacency Matrix so you can take a graph turn it into an adjacency Matrix you can also take an adjacency Matrix and turn it into a graph object um and now let's let's look at the different visualizations now basically it's always the same we just plot individual notes connected by edges but we can do that in a different um we can arrange the the notes differently so let's just go ahead and create this graph again what we can do here is we can use spring or we can use a bunch of other uh Styles you could say or algorithms to to determine the position of the note so we can do draw spring to do the one that we already know but we can also go ahead for example and say draw circular so circular like this and then you're going to be able to see a difference this is spring this is circular tries to arrange the notes in a circular way we can also do shell which tries to do concentric circles then we have then we can go with uh spectral which um uses um laplacian what was it laplacian I don't know what exactly it was something with eigenvectors um I'm not exactly sure what the theory behind this is but they're just different um representations and we can also just use random here so we can plot the graph randomly with labels always set to True obviously so as the name says this is going to be just completely random and then we can also this one is quite interesting we can also draw a a planar graph I hope this is how it's pronounced I have to Google this here in a second before I use the term too often and I mispronounce it uh but basically this means that it's going to plot it in a way that the edges don't intersect so if possible obviously so those are the different things those are the different functions we can run them now and you can see the difference this is spring this is circular this is shell which is basically concentric Circle so it's quite similar um this is spectral this is random and this is I hope it's pronounced planar um meaning that if possible we don't want edges to cross each other so if we can draw it so that no Edge crosses another Edge that's uh what we want to do here um let me just Google how it's pronounced planer planar okay wasn't that wrong um so when we draw planar graph that basically means that as I said we don't want the edges to uh cross each other but that's not always possible so we can look at an example here so I can I can choose to display the graph K4 which is a complete graph meaning that we have four notes and all the nodes are connected to all the other notes so I can go ahead and Define it myself I can say one is connected to two one is connected to three one is connected to four two is connected to three two is connected to four and three is connected to four that would be the K4 graph with a complete graph um and we could display it as spring and as a planar graph and in this case the spring representation uh crosses the edges you can see this Edge crosses this Edge they intersect here it is not the case because it's possible for the K5 for example it's not possible if we have five notes and all the five notes are interconnected it is not possible to do a planar representation and I'm going to show you what happens if we try to do that it's going to give us an exception um but before we do that I want to show you that we don't have to manually generate a complete graph so I don't have to define the edges of the complete graph manually I can just go ahead and say here g equals complete graph or actually NX complete graph and then four that basically results in the same thing and I can also do now the same thing for five and you're going to see what the problem is it plots it like that if it's a if it's the spring function but when I try to do it planar it says G is not planar so it doesn't work um yeah that's basically the idea of that because the K5 is known to not be a planar graph um yeah that's basically it now let's look at how we can um how we can get some information about a graph that we have so for example here we have the complete graph how can I get the degrees of the individual notes in this case the degree of all the notes is going to be the same because they're all interconnected but um maybe to make this more interesting let's return to the graph that we had before this one uh we can get some information about that by just going ahead and saying uh print dictionary we're going to turn into a dictionary the g dot degree and uh we can just get the individual indices here so for example I can go index two and I'm going to get the degree of I'm going to get the degree three which one is that I think that is uh which one has a degree of three let me just see it here oh this is a K4 this is actually not what I wanted to do because they all have degree degree three do I have something what was the graph that I had before or is it there you go um we can do the same thing here now let me just remove all of this and then let's go ahead and say print dictionary g dot degree and then index 2 for example this is going to give me 2 as a result and I think that is uh is this the node two I think it's node two because we have no we don't have a zero actually do we no it's a dictionary not an index so it's actually a key that was a mistake it's it we're not asking for index to we're asking for key2 which is the node 2 and this node has a degree of two this one would have a degree of three so if we go and say degree of three this is going to give us three in the command line here in the output so we can get the degree of the individual notes quite easily we can do the same thing with the in degree and the out degree by saying in underscore degree and out underscore degree at least I think that's the case even though pyram says it doesn't know that function but this only makes sense in a directed graph so maybe we can see that that is the case so that you don't have to believe me if we have a directed graph now we have the directions which means that the in degree of 3 for example is 1 because we have one incoming connection and the out degree is two so let's go ahead and see what the in underscore degree of 3 is would be out underscore degree of 3 is and also what the degree in general of 3 is let's see and we get one two three because the in degree as I said one incoming to outcoming total of three because that plus that is that um that's quite simple okay so what else can we do we can also find shortest paths um let's look at the graph I can find now this one is a directed graph let's go back to an undirected graph so that it's simpler um let's say I want to find the shortest path now the problem here is that we only have uh let's add an additional path to being connected to eight eight being connected to nine nine being connected to four so two to eight eight to nine two four I think that should accomplish what I'm trying to show you here uh can you please display this in our planar way there you go so now to get from uh what was it from from two in order to get from two to four I have two paths I can go two three four or I can go two eight nine four and I can find shortest paths quite easily um by just going ahead and saying um print NX dot shortest path in the graph G from 2 to 4.
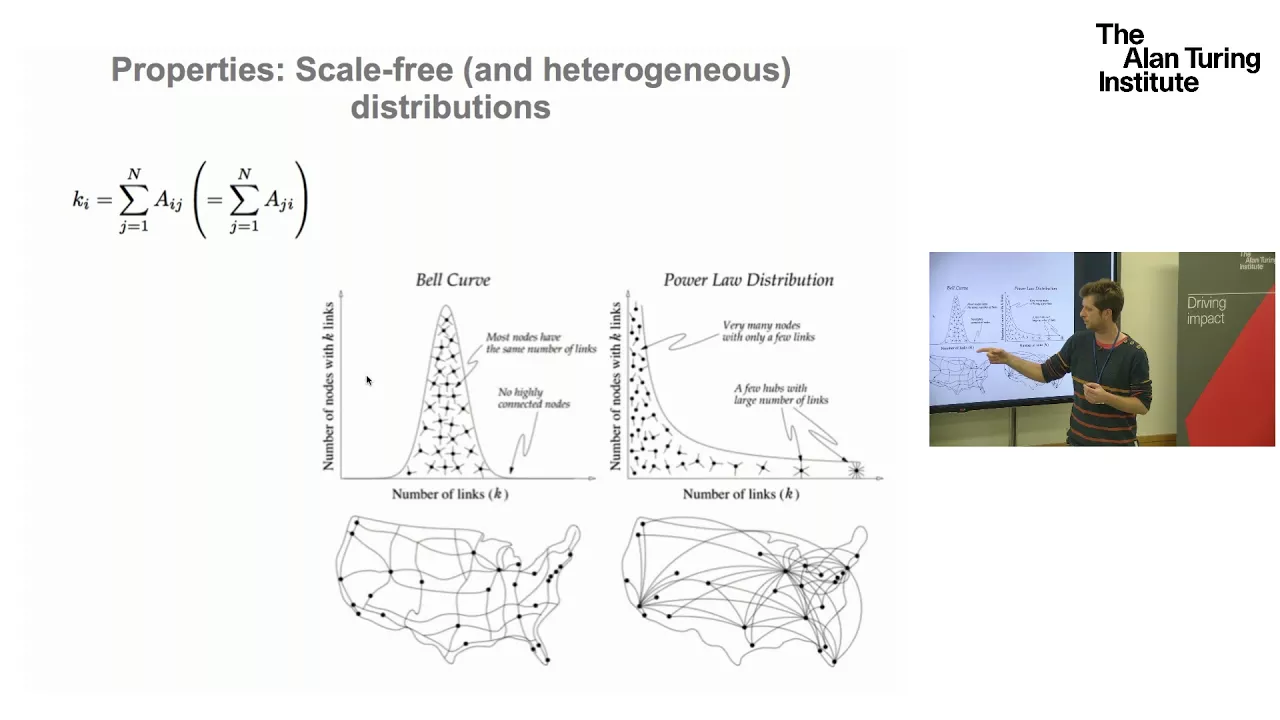
and then I will get two three four this is the shortest path if I remove the Note 3 or if I remove the Edge from 2 to 3 it's going to tell me that 2 8 9 4 is the shortest path so if I remove this edge here you're going to see that the path is now 2894 obviously okay so that's quite simple we can find shortest paths um what we can also do is we can get information about the centrality of individual notes and I don't want to come up with some fancy examples here because that would require too much thinking now and it would be boring but essentially we have different types of centralities we can have the degree centrality the closeness centrality the eigenvector centrality the between the centrality basic idea being that we want to know how Central is a note how well positioned uh how centrally positioned is a node in the graph and we can decide that in different ways so we can say for example that the degrees the degree of a note is the most important indication how many nodes this node is connected to is the most important thing in terms of centrality so we can say that the higher the degree of a node the higher the centrality of the note the higher the degree centrality of the note we can also say the closeness centrality which is a different thing this is the average this distance to all the other notes so we calculate the shortest path to all the other notes what's the average distance to to get to all the other Notes From a Certain note so for example let me just open paint maybe for for an example I hope I don't come up with the stupid one uh here in an improvised uh in my improvised drawings but let's say I have a note like this one here and let's say it has only one connection but it has a connection to this node here and this node is connected to basically all the other notes something like that I gotta say we have a million notes here and then let's say that I have one Bridge here somewhere and then I have a node that is connected to two other nodes now this node has a degree of three because it has three connections and let's say here again we have millions of notes right um and and maybe let's say we have some more notes in between so that we have some more distance this note would be more Central than this note even though it has uh less Connections in terms of um closeness centrality because it's way faster in reaching all these other notes um uh because it's just closer to to a central to a very Central Point here even though this one has a higher degree because it is connected to some very unimportant nodes that's the basic idea of the closeness centrality uh the eigenvector centrality also takes into consideration the importance of the notes it is connected to so it cares about how connected it is to other nodes but it also cares about the quality of the other notes because if you're connected to a lot of unimportant notes you're still not so important but if you're connected to very important notes even if there are fewer you're more important and then we have also the between the centrality meaning that um betweenness meaning how many uh how much percent of the shortest paths in the graph run through U so if we have all the shortest paths how many of those important Paths of those optimal paths run through you because that is the between the centrality how often do people have to cross you to get to or to use their shortest path um now that's a lot of theory again but it's essentially what you want to do is you want to say NX Dot and then degree centrality and then G for example print whatever and then you get this dictionary here so that is the dictionary showing you the degree centrality of all the notes and you can do that now for all the different centralities that we discussed so for the closeness centrality that we discussed for the uh what was it eigenvector centrality and for the between the centrality and I think there will also be other centralities that I didn't cover here but you can see the values here in dictionaries and I think I have here a good example um I'm not sure what exactly I wanted to show with that but I'm sure I'm going to figure out as I'm explaining here but we have a graph one which is a complete graph so we have a K5 graph so G1 being um a complete graph five and then we have G2 also a complete graph five and then let's say I have um I want to relabel the notes of G2 because the basic ideas I want to have now two very interconnected graphs and then I want to have a bridge I want to connect them via just um via just one connection I want to connect for example I have 0 1 2 3 4 and I have a b c d e and I want to connect um four to a node x and x to a node a so that X is basically the bridge combining these uh these uh two complete graphs so it's going to be very important in terms of between the centrality but not so much in terms of uh degree centrality so if I say G2 equals NX dot relabel notes let's relabel them here with a following dictionary 0 is going to become a one is going to become B uh 2 is going to become c 3 is going to become D and then 4 is going to become e then what we're going to do is we're going to say that g is going to be or actually let's equate the graph first G connector is just going to be a simple graph and X from Edge list and here we're going to provide now the following Edge list the Note 4 is going to be connected to a new node X and this new node X is going to be connected also to a making it the bridge for our graph and we're going to say that the total graph G is NX compose all so you can use that function compose alt connect graphs and we're going to say that it's just the combination of G1 G2 and G connector and then we can get rid of all this here now planar is not going to be possible so let's just go with spring and then you're going to see now that our note X is here in the middle you can see that all the other notes basically have a higher uh degree of centrality um or a higher degree centrality I should say because they have a degree of five um or at least no four most of them have a degree of four a into four have a degree of 5 because they're also connected to X um but this node is super important in terms of in between centrality and in between centrality so what I can do here is I can say now print and I can say NX dot degree centrality of the graph and NX betweenness centrality of the graph and then we're going to see hopefully that the degree centrality of X is super low 0.2 it's the lowest of all the notes but you can see it's the highest of all the nodes uh in terms of uh between the centrality because even though this point here is not well connected to all the other nodes it is super important and it's super Central because it is at the center of the connection that's the idea here so this is something that you can do as well quite easily uh you can also get some basic metrics about the graph like you can say print NX density of graph G or the diameter and basically the density means how many edges do we have um divided by the total number of uh possible edges so we have certain notes and the the graph where all these notes are completely interconnected the complete graph version of these notes has the maximum number of possible edges the maximum Edge as possible how many of those how much percent of those do we actually have in our graph so when a complete graph this is going to be 100 in a not complete graph it's going to be something less than 100 because it's not going to use all the edges that's the density the diameter is basically just the longest shortest path so if we have all the shortest paths between the notes what's the longest one that's the diameter of the graph so in this case we have 0.4 just because of X because X is not connected to all the nodes possible so we don't have all the possible connections 40 of the graph is connected so we have density of 0.4 and the diameter is 4 because the longest shortest path um is four which one is that basically 0 4 x a for example or no actually 0 0 to 4 4 to x x to A A to B for example and I think that most paths here have a length of four all right so what else can we do we can find certain paths so I'm not sure if it exists in this particular graph but uh you can find a I need to Google what that is called again how that is pronounced uh how to pronounce Euler let's see Euler Euler okay actually I pronounced it correctly so um if you want to find an Euler path or an eulerian path I hope that's how it's pronounced um basically you can just go and say NX Dot this path here and you can pass the graph and it's going to give you that path if it exists now what is this path it's essentially going through each Edge exactly once now let's see we need to turn this into a list it's not always um possible to find it because in some graphs it's not possible to have such a path in this case it would be possible now let's print this before we visualize it we can actually track it um the basic idea is that you want to go through each you want to visit each Edge exactly once and how you do that is in this case one possible way if not the only way is I mean I don't think it's the only way is it I guess not because you can do the same thing starting at a but you can go four to zero zero to one one to two and so on you go through all these edges you follow this path you can pause the video and try to do that and you will not go through an edge more than once now you can visit notes multiple times but you will not use the same Edge uh more than once and you will use each Edge at least one time or exactly one time in this case that's the idea of this path uh you can also find um groups basically complete maximal subgraphs by just saying NX dot Point clicks clicks what's the pronunciation here graph Theory makes it easy to pronounce things when you're not you're not a native speaker you notice how how little you know but essentially this is the maximal uh subgraph that we have here and in this case we have 4X ax uh this complete graph here and this complete graph here so those are the four complete subgraphs that we have complete meaning again all the notes are interconnected um and since this is a K5 and this is a K5 obviously we then have this one here or those two here because 4 and x uh when you have two nodes that are connected obviously they're going to be a complete graph and since we don't have anything else with X this is also the maximum complete graph um and we can also do NX dot k underscore core to find uh what was the definition of this one subset of notes were all nodes connected to at least where all nodes are connected to at least K other notes in the subset uh that's something we can do here um as well if we want to so there are a lot of things I don't want to cover all the functions what I want to do though is I want to show you also how to find Bridges and bridges are defined as um as edges that when deleted increase the number of complete uh of uh connected components so when you have a graph that is fully connected and you remove something one node um and the removal of this node or actually uh Edge not node the removal of this Edge causes the graph to not be connected anymore so you have two connected graphs now two connected components that edge is a bridge so what we can do here is we can say print NX dot Bridges G and this should give us okay we need to call the lists function on it this will give us 4X and ax obviously these two connections are bridges because if you get rid of them uh you're separating the two graphs here into two separate connected components so that is a bridge now a local bridge is essentially when you have edges between two nodes and those two notes don't have any common neighbors so it's not actually a bridge because you're not when when you delete that edge you're not actually separating the graph into uh into two connected components but um you remove an edge that connects two points that are not somehow connected by similar neighbors as well so you're basically removing the connection between those two points and they now have to go a longer path uh to find each other so that's a local bridge and the span of this local bridge is essentially uh what the distance of the shortest path is after removing that edge and you can find these local Bridges by saying NX local Bridges of G and you can see in this case we don't we don't have local Bridges because those are complete graphs but we do have a bridge and a bridge is also local bridge with the span being infinite right but for example if I now have also a being connected to Let's actually do that let's say I have a being connected to a note uh what's the last letter we just eat a being connected to f f being connected to g g being connected to H and H being connected to four now this is no longer a bridge but it's a local bridge because if we remove it we have to go along our path so I can actually go ahead now and say let's add here as well uh what was it for being connected to to f and four is not a string so let's change that for being connected to f F being connected to G G being connected to H and then H being connected to a so now it's no longer a bridge but we have a local bridge so you can see we don't have a single Bridge the list is empty but we can see here that when we remove um 4 and X this is a bridge of length 5 of span 5 because if we now remove it I have to go through this path here to reach four so it's a local bridge um but it's not a complete Bridge because I still have a path to you to reach the other side of the graph if you want if this uh edge here is removed or this edge here is removed um yeah so that's that okay so what else can we do uh we can also list the connected components and that's actually the last thing I want to show you here because I don't want to bombard you with all the different concepts you can explore the library on your own but I want to show you here how we can find connected components so let's say we're going to get rid of all this here let's say that these two graphs are not actually um or actually let's just go ahead and leave it like that when I when I now go ahead and say print G or NX Dot connected components that basically means we need to list this basically means that they're connected right so in this case the whole graph is a connected component now let's remove the Edge from X to a now we have different connected components because now we have the components 0 1 2 3 4 x here this is one connected component and d e a c b here this is also connected component so uh and of course if I remove this edge here we're going to have three connected components that's the basic idea now indirected graphs uh it's a little bit differently I'm not gonna do it here now in Python but what we what we can do is we can do um weekly connected components and strongly connected components the basic idea here being when we have a graph let's say this point is pointing to this point is pointing to this point um or actually let's do it the other way around let's say they're pointing here and let's say those are pointing to each other now they would be connected because because I can reach B from a and I can reach a from B but I cannot go from C to b or from C to a so it would not be this whole thing here would not be a strongly connected component however it is a weakly connected component because if we ignore the directions of the edges uh it would be a connected component so that's the basic idea here and we can also find these components with those two functions so that's it for today's video I hope you enjoyed it and hope you learned something if so let me know by hitting the like button and leaving a comment in the comment section down below and of course don't forget to subscribe to this Channel and hit the notification Bell to not miss a single future video for free other than that thank you much for watching see you next video and bye [Music] thank you [Music]
Up Next

Graph Partitioning Algorithms: Lecture 7 | Network Science
@LeonidZhukov
12.2K views•2021-02-24

Introduction to Secure Multiparty Computation with Yehuda Lindell
@fhe_org
7.7K views•2021-02-04

Machine Learning Model Explainability with SHAP in Python
@NeuralNine
10.1K views•2024-02-26

Enigma Machine Mechanics: WWII Encryption Explained
@JaredOwen
13.2M views•2021-12-11
Related Study Plans & Knowledge Roadmaps
Structured learning paths in Computer Science