






























![[GUIDE] Google Tag Manager for WordPress Plugin (GTM4WP)](https://i.ytimg.com/vi/V9msXyA7O0w/maxresdefault.jpg)





Google Analytics 4 (GA4) is the latest version of Google Analytics that uses machine learning for enhanced data collection and reporting, replacing Universal Analytics which will stop processing data in July 2023; GA4 requires creating an account and property, setting up data streams for your website or app, and offers a comprehensive reporting system including Home, Acquisition, Engagement, Monetization, Retention, Demographics, Technology, and Exploration reports, along with configuration options for events, audiences, and custom definitions.
Google Analytics 4: Complete Beginner Tutorial Guide
Added:Fundamental concepts of digital marketing metrics, such as traffic sources, user sessions, pageviews, and the concept of conversion.
Basic understanding of website architecture, including HTML tags, URLs, domains, and how browsers load web pages.
An introductory concept of 'tagging' and container systems, specifically Google Tag Manager (GTM) and how it interacts with website code.
Awareness of fundamental data privacy regulations (e.g., GDPR, CCPA) and the role of cookies in tracking user behavior.
Advanced custom event configuration and the registration of custom dimensions and user properties within GA4.
Exporting raw GA4 event data to Google BigQuery to perform advanced SQL-based analysis and bypass data sampling limitations.
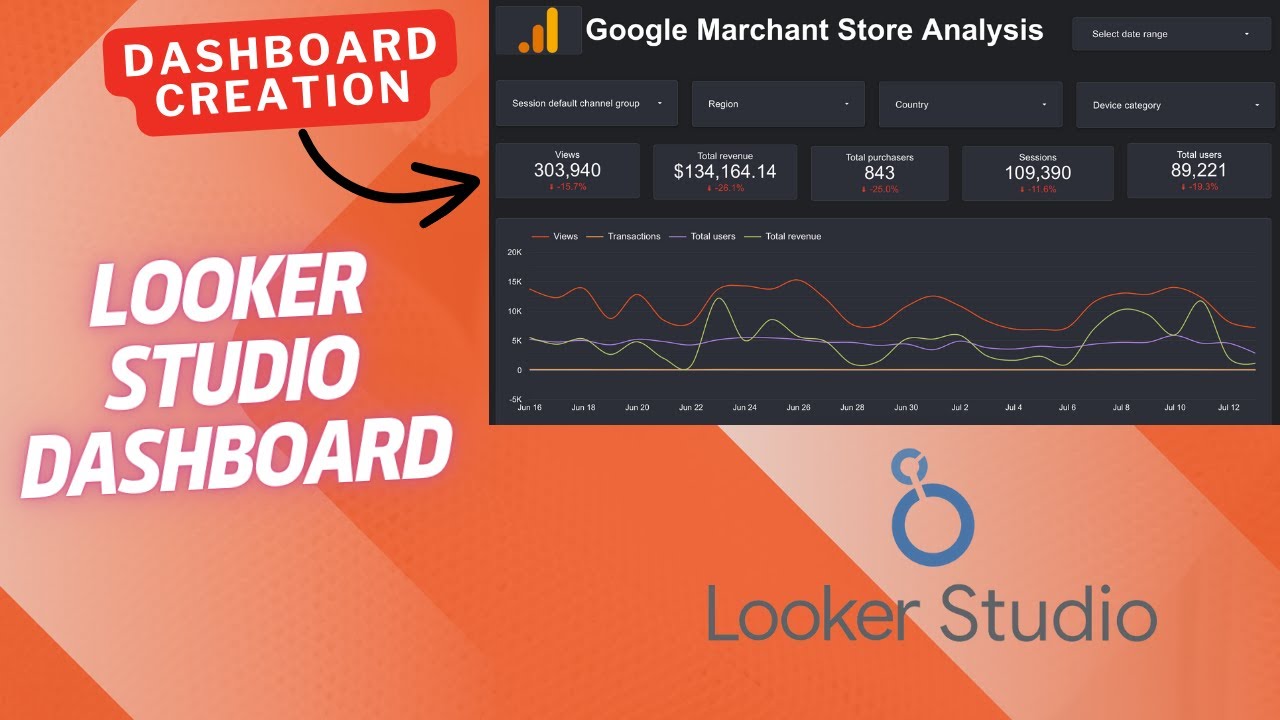
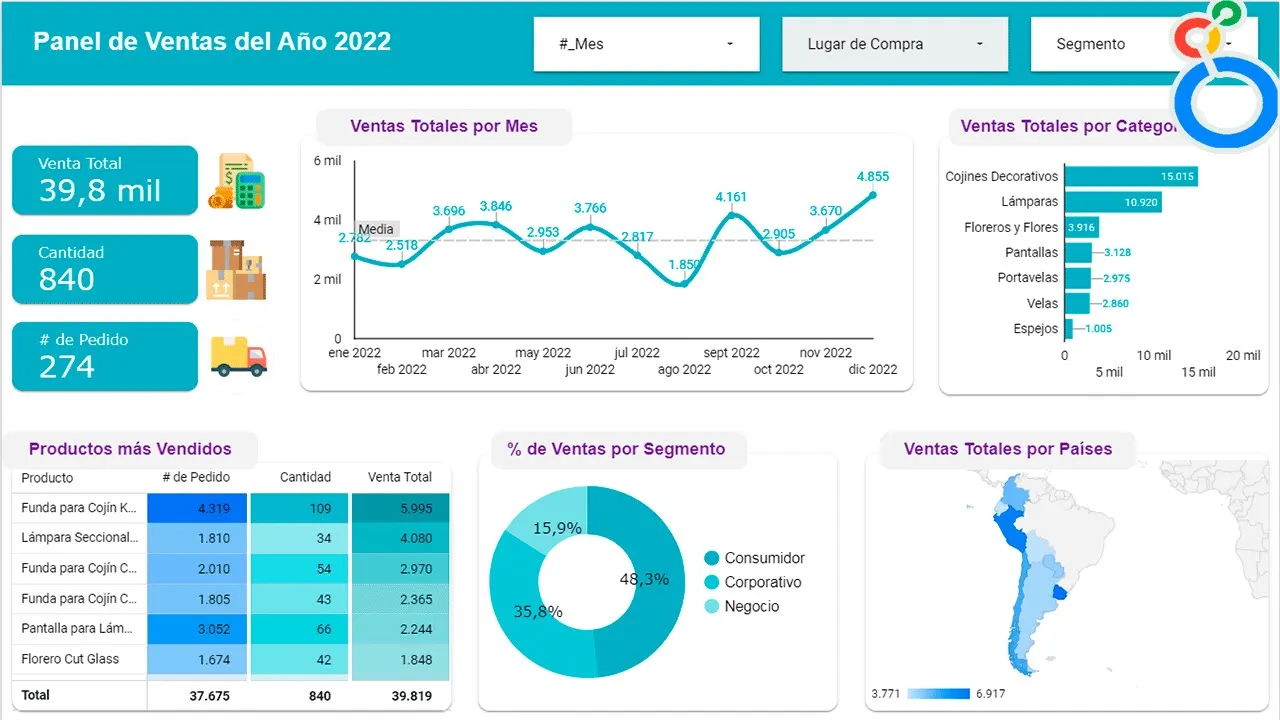
Designing and building dynamic, interactive marketing dashboards in Looker Studio using GA4 as a primary data source.
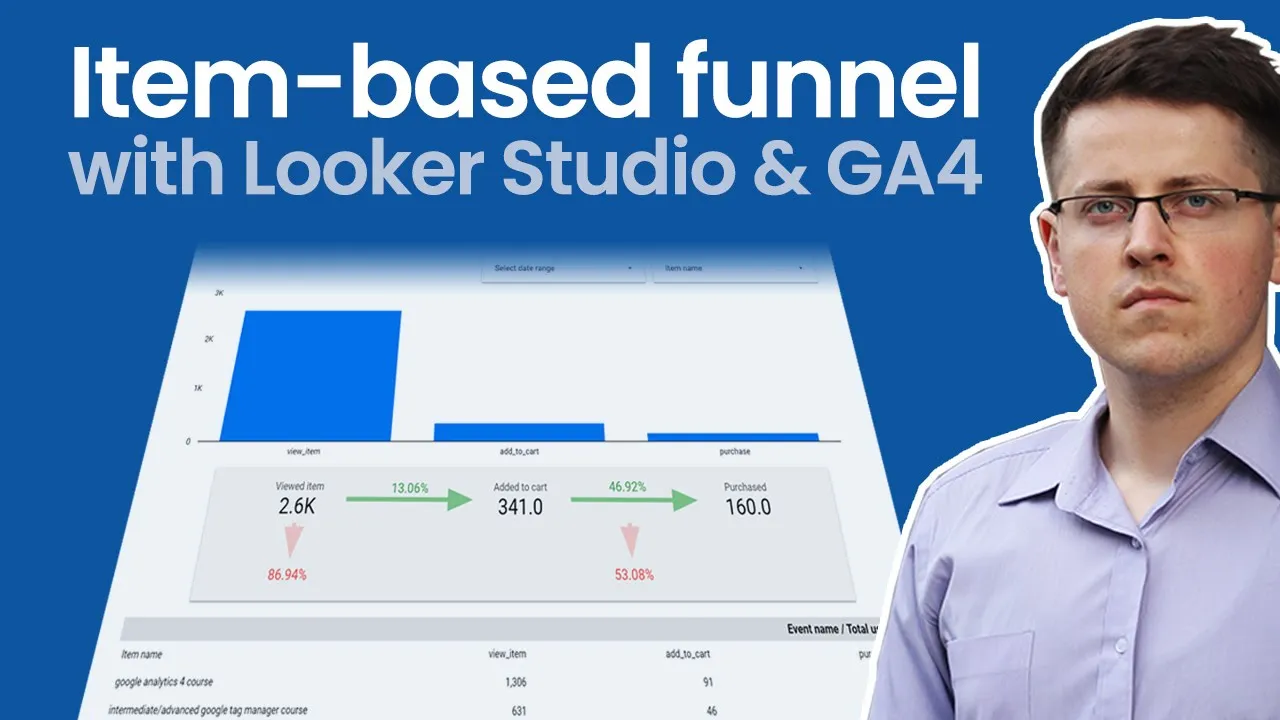
Implementing Enhanced Ecommerce tracking to measure detailed shopping behaviors, checkout steps, and product performance.
Deep-diving into GA4's attribution models, path exploration, and segment overlap reports to analyze multi-touch customer journeys.
120.6K views1.7Klikes1:02:19Original Release: 2022-04-11
In this Google Analytics tutorial, I'm going to show you how to get started with the latest version of Google Analytics, which is Google Analytics 4 or 'GA4' for short.
We're going to walk through all of the steps you need to follow so that you can begin reporting on the performance of your website.
You'll learn how to create an account, use your reports, and about the different configuration options.
I'll also include extra tips along the way.
And if you're already using Google Analytics, then I've included links in the description below this video so you can jump to a topic that you're interested in learning about.
Since Google Analytics 4 is constantly being improved by Google things can change quickly.
So I recommend taking a moment to click the subscribe button below, so that you'll be notified when I release tutorials covering new features and the latest changes.
And if there's something you're struggling with, or you have a question while you're watching this video, then feel free to ask your question in the comments below this video.
I will do my best to answer as many questions as I can.
Okay, it's time to get started!
If you're setting up Google Analytics for the first time, then you need to begin by creating a Google Analytics account.
Or if you're already using Google Analytics, for example, if you've been using Universal Analytics, then you can log into your existing account and create a new GA4 property.
We will cover this in a moment.
We're on the Google Marketing Platform website, and we can see under 'For Small Businesses', we can select 'Analytics'... Then on the top right corner, we can see there are two options... If you already have a Google Analytics account, then you can sign in.
So you can click this option to then access your existing Google Analytics account.
Or if you're just getting started for the first time, then we can click 'Get Started Today' to create your account.
Since I already have a Google Analytics account, I'm going to select 'Sign In To Analytics'... Now we need to login using our Google account.
This can be your Gmail address, your Google Workspace address, or the login details you use to access other Google products.
Since I already have an account, we can see we're looking at the reports.
If you are getting started for the first time, then you won't see these reports, you will immediately be prompted to create a new Google Analytics account.
I will show you these steps in just a moment, but first, I want to highlight the message we can see at the top... We can see it talks about Universal Analytics, and that data won't be processed starting in July 2023... This tells us that we're looking at reports from a Universal Analytics property, which is the previous version of Google Analytics.
So if you're currently using Google Analytics and you see this message at the top of your reports, then you know it's time to start using Google Analytics 4, which is the new version of Google Analytics.
Okay, now let's navigate to 'Admin'... And click 'Create Account'... These are the steps you will see if you selected 'Get Started Today' and you are creating your Google Analytics account.
The first thing we need to do is name our new account.
The best way to think about your Google Analytics account is it's a bit like a folder.
It's going to keep things neat and tidy inside Google Analytics.
So typically, you will want to name your account after your business or organization.
So I'm going to name my account 'Loves Data', but you can name your account anything you like.
And if you then asked to set up Google Analytics for another business, you can create another account whenever you need.
So each business will have its own account or folder.
Below the account name, we then have the data sharing options.
These let you control how your data is shared.
I recommend taking a moment to review these options.
I'm going to disable all of these options for now, so that data isn't shared.
And I want to highlight that you can change these later.
For example, if you need to grant Google technical support access to your account in the future.
When you're happy, it's time to click 'Next'... Now that we've named our account, which is our top-level folder, the next step is to create a property.
A property is typically used to report on an individual website, but you can collect data from multiple websites and apps into a single property, so that everything is combined in one set of reports.
This is actually one of the benefits of Google Analytics 4 compared to the previous version.
I recommend naming the property so that it reflects the website, app, or combination of websites and apps you will be measuring.
Since I'm just planning on measuring my website, I'm going to give the property the same name as my account.
I'm going to name it 'Loves Data'... And you can always change this if you need to.
Next, we need to select the time zone we want to use for our reports.
I suggest taking a little bit of extra care at this stage, because if you decide to change the reporting time zone in the future, then you will either see a gap or overlap in data.
I'm based in Sydney.
So I'm going to select 'Australia'... And then 'Sydney' for my reporting time zone... Then we need to select the currency we want to use for our reports.
I'm going to leave the currency set to 'US Dollars' for my property, but I suggest selecting the primary currency you use for your business or organization.
I also want to highlight that the currency you select can be used for automatic currency conversion in your reports.
For example, if I send a value in Australian Dollars to Google Analytics and I have US Dollars selected, then the Australian Dollar amounts will be automatically converted to US dollars.
Below the currency, you will notice it says 'Show Advanced Options'... Clicking this lets you create a Universal Analytics property (which is the previous version of Google Analytics) at the same time as the Google Analytics 4 property.
To do this, we just need to enable the option on the right... If you're getting started with Google Analytics for the first time, then I recommend just creating a Google Analytics 4 property, as we can see that Google will stop supporting Universal Analytics in mid-2023.
Unless you really need to create a Universal Analytics property, I suggest you skip this option.
So I'm going to disable this... And then I'm going to click 'Next'... Now we can select some details to tell Google about our business or organization.
This includes selecting an industry category... The size of your business... And how you plan on using Google Analytics... All of these are optional, and although it says the answers you select will help Google tailor your experience, I haven't seen this yet.
So for now, I'm going to leave all of these and I'm going to click 'Create'... Then we need to agree to the terms of service for our particular country.
I'm going to select 'Australia'... And accept the terms... We have now created our brand new Google Analytics account and property.
The next step is to create a data stream to start collecting data into our reports.
We will do this in a moment, but let's just click the arrow on the top left corner first.. I just wanted to show you that on the left, we have our account, which is the top-level folder... This will have the name you entered... Then in the middle, we have our property, which is where all of our reports will be available... Now if you've been using Google Analytics for a while, then your account might also include a Universal Analytics property.
So let's head to another account I have access to to see what this looks like... In this account I have two properties and we can see them by selecting the drop-down... We can see there is a Google Analytics 4 property... I've included 'GA4' in the name of the property so I can easily see this... And there is another property that includes 'UA' in the name for 'Universal Analytics'... I just wanted to show you this, so you can see that Google Analytics 4 and Universal Analytics properties can be stored in the same Google Analytics account.
And if you're not sure what type of property you're currently using in Google Analytics, look for ID after the property name.
It will be in parentheses.
If it's just a number, then it's a Google Analytics 4 property, so the latest version.
And if it starts with 'UA' and a 'dash', then it's a Universal Analytics property, so the previous version.
Now I want to show you one more Google Analytics account... In this account there is only a Universal Analytics property... If this is what you see in your Google Analytics account, then it's important to set up a Google Analytics 4 property as soon as you can.
As we've covered, Universal Analytics properties will stop working in mid-2023.
If this does apply to you, then you can use the 'GA4 Setup Assistant' at the top of the property column to create a Google Analytics 4 property based on your existing set up.
Let's select 'GA4 Setup Assistant'... Then let's click 'Get Started' under the heading that says 'I want to create a new Google Analytics 4 property'... We can then see details about what the setup assistant will do.
Unfortunately, Google won't move your historical data into Google Analytics 4, so that's why I recommend doing this as soon as possible if you're using Universal Analytics.
We can see that for this property, the option to collect data using an existing analytics tag isn't available.
And even if it is available, I generally don't recommend using this option because it is prone to causing problems when you're managing your implementation.
So ensure 'Enable data collection using your existing tags' is deselected... And then click 'Create Property'... Now we can select 'See Your GA4 Property'... The setup assistant has now created a new Google Analytics 4 property inside our existing account.
You can then select 'Tag Installation'... Or 'Data Streams'... This is where you will find the measurement ID or tracking code you'll need to start collecting data into your reports.
We will come back to data streams later in this tutorial, but now, let's head back to the new account we created... Okay, so now we're going to create a data stream.
A data stream is used to collect data into your property and reports.
And in Google Analytics 4, you can create one data stream, or multiple data streams.
If you're going to be measuring a single website, then you will just have one.
But if you want to measure a website, an Android app, and an iOS app, then you will have three data streams, one for each platform.
So just remember, a data stream is used to send data through to Google Analytics which will then be processed into your reports.
Let's select 'Data Streams'... We can now choose the type of stream we want to create.
Since I'm going to be measuring my website, I'm going to select 'Web'... Now we can enter the URL of our website and name the stream.
For my stream, I'm going to enter 'www', 'dot', 'loves data', 'dot', 'com' as the URL... And I'm going to name the stream 'Loves Data Website'... I want to highlight that the URL and name you enter can't be modified after you've created the stream, so take a moment to make sure the URL is correct and you're happy with the name.
Next, we can adjust the enhanced measurement settings.
Enhanced measurement is a great feature in Google Analytics 4.
It lets you automatically track a number of important actions on your website without needing to modify your implementation.
It will automatically track page views, plus people scrolling pages on your website, clicks on outbound links, your website's search function, people watching embedded YouTube videos, and people downloading files.
Enhanced measurement is enabled by default, but you can turn it off... And you can click the configuration icon... To then disable (or enable) the actions it will automatically track.
For example, if you don't want to report on people scrolling your pages, then you can disable this option... And then click 'Save'... Then when you're happy, click 'Create Stream'... Our data stream has now been created.
On the top right hand corner we can see the 'Measurement ID'... This is the unique identifier for our stream.
When we place this on our website, using either the analytics tag or Google Tag Manager, this identifier ensures that data flows into our property and our reports.
Depending on the website platform you're using, you can use the measurement ID to start sending data to your reports.
For example, if you're using a Wordpress plugin, then you can copy and paste the measurement ID into the plugin's configuration to start collecting data.
Or if you're using Squarespace, you can copy and paste the measurement ID into your website's configuration.
Traveling down, we can see the enhanced measurement settings... And if you need to adjust these, you can... Then below this we have instructions on how to install Google Analytics.
We can see under 'Add New On-Page Tag' there are two options... We can use the dedicated global site tag (or gtag.js), or we can use Google Tag Manager... And if you're already measuring your website with say Universal Analytics, there's another option we can select which is 'Use existing on-page tag'... This provides instructions for connecting an existing global site tag if you already have one installed on your website... And instructions if you're already using Google Tag Manager... In most cases, I recommend using Google Tag Manager instead of the global site tag because it provides added flexibility.
You can manage multiple tags, not just Google Analytics using Google Tag Manager, and you can also configure Google Tag Manager to track a whole range of other actions and elements on your website.
Now that we've covered the steps to create a new account, and how to create a new Google Analytics 4 property in an existing account, we're going to start exploring our reports.
Then once we've looked at the reports, we will come back and talk more about how we can add Google Analytics to our website, along with some of the other configuration options.
To explore the reports, we are going to use Google's demo account.
So let's head to Google's Analytics Help article to access the demo... I've included a link to the page we're looking at in the description below this video.
To access the demo account, we just need to click one of these links... And I want to mention that you only need to do this once.
After we've clicked the link, the demo property will continue to be available when we log into Google Analytics.
So let's click the Google Analytics 4 property link at the top... We're now looking at Google's demo account.
This is the perfect way to explore Google Analytics and experiment with the reports you can customize.
And just so you know, this property shows us data from Google's merchandise store, which sells a range of Google branded products, like t-shirts, hats and other accessories.
At the top, we can see the name of the current property we're using.
We can see it says 'GA4 Google Merchandise'... And it's in the 'Demo Account'... We can click this, to then quickly switch between the different accounts and properties we have access to in Google Analytics.
Okay, so we're going to stick with Google's demo.
On the left, we have the main menu that lets us navigate between the different types of reports in Google Analytics... First is 'Home'... This provides a top-level summary for your website.
It's also automatically personalized, so it will show you reports you've recently viewed, along with other automated insights.
'Reports' lets you view pre-configured reports.
This includes dedicated reports showing you how people find your website, what pages they've viewed, if they've converted, plus demographics and details about the devices they're using.
'Explore' lets you create custom reports, and you can visualize data in different ways.
For example, you can create simple tables, funnel visualizations, and more.
'Advertising' lets you view the dedicated attribution reports.
This is where you can see the relationship between your different marketing channels and how they lead to conversions on your website.
'Configure' is where you can customize data that is included in your reports.
For example, this is where we will configure conversions.
And finally, on the bottom left corner is 'Admin'.
This lets us access additional settings for our account and property.
Before we look at some of the most important reports, I want to mention that there are lots of reporting options.
From the pre-configured reports, to creating your own custom exploration reports.
You probably won't need to use every report inside Google Analytics, so the main thing is to identify the reports that help you improve your results.
It's okay not to use every report.
Use the ones that help you.
Okay, so we're looking at the home report.
As I mentioned, this report provides a top-level overview of your website.
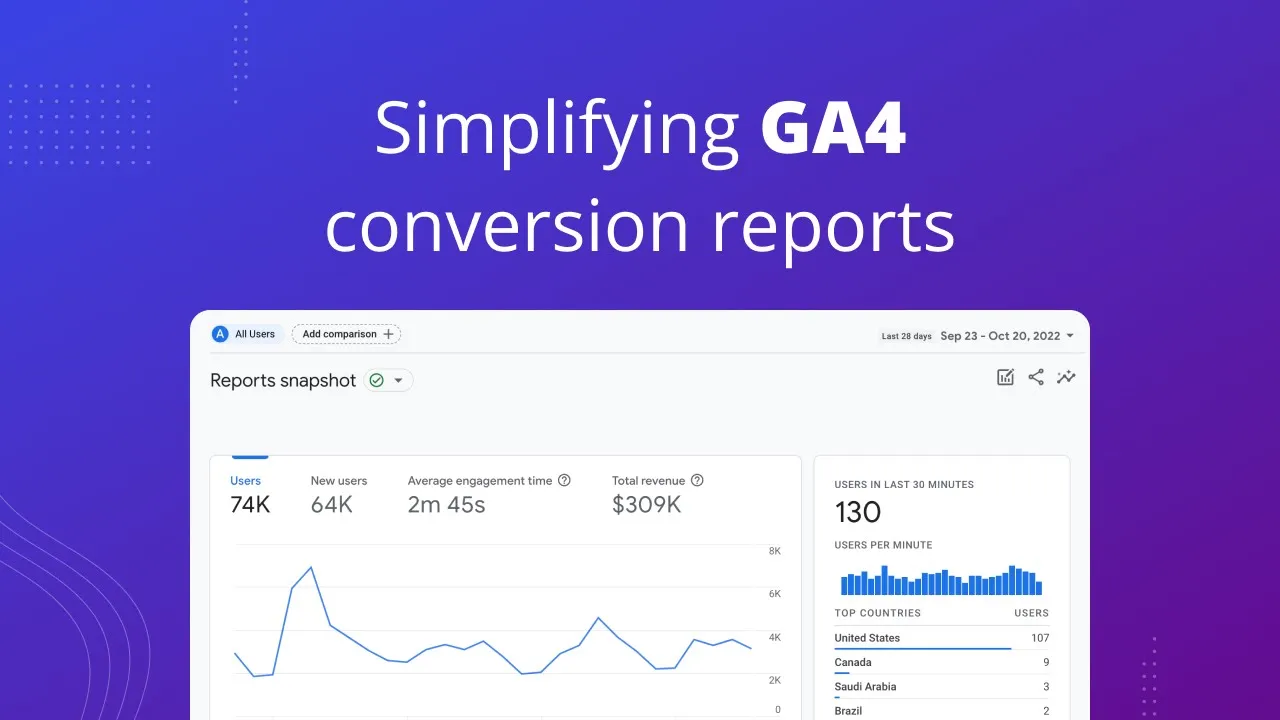
At the top we can see the total number of users, new users, average amount of time people have spent on the website, and total revenue.
This is for the last seven days by default, but you can change this by clicking the current date range... And choosing a new one... Now we can see all the metrics are updated.
We can also see a trendline for the metric that is currently selected.
This is showing us our user trend.
And the dotted line shows us a comparison to the previous period, which is the same number of days before our currently selected date range... In the next card, we can see the total number of users that have been on our website in the last 30 minutes, and where they're located... Below this we can see any reports we've recently viewed... And at the bottom we can see automated insights which are based on Google's machine learning.
These insights will be custom for your website and they show a predicted (or forecasted) range (called the 'Expected Value').
So you can see if there are any unexpected spikes or dips for important metrics... Now let's navigate to 'Reports'... We're now looking at the 'Reports Snapshot' which is similar to the home report we just looked at.
Again, we can see the number of users, new users, average engagement time, and revenue... And again, there is a card showing us the number of users that have been to the website in the last 30 minutes.
Traveling down, we can view automated insights... And then there are some additional cards that show us top-level summaries.
We can see the top ways new users are finding us... We can see the top marketing channels that are driving sessions... Where people are geographically located... Then we can see details about the number of active users... And user retention... We can also see the top pages people are viewing based on the page titles used on the website... The different events we are collecting into Google Analytics... Conversions... And products people are purchasing... Since there is a lot of different terminology when it comes to Google Analytics, I want to mention a super handy resource I've created for you.
It's my Google Analytics Glossary.
I highly recommend downloading a copy if you're just getting started.
I've included a link in the description below this video.
Now let's navigate to 'Realtime'... This report lets you view details about the people who are currently on your website.
Data is processed into the reports within a few seconds.
This can be useful for identifying where people are landing on your website.
For example, if you're sending out an important email campaign, then you can check that people are viewing the pages you expect as they click through to your website.
And each card includes a bar chart.
This is read from right to left, so the current minute is on the right, and then each bar stepping to the left represents another minute contained in the last 30 minutes.
We can also see the total number of users on the website in the last 30 minutes.
The geographic map shows us where people are located.
And scrolling down, we can see additional insights about people currently on our website... This includes how they found the website... We can see if people are being included in any audiences.
We will talk more about this later in the tutorial, but basically we can create different audience lists and we can then see the number of users matched to each list.
We can also see the content people are viewing on our website, so the pages they're viewing.
And we can see the events that are being collected.
We can see page views, scrolls, and other events being collected.
We can also see conversions... And any user properties that have been collected.
The other we can do is view granular details for individuals currently on our website.
To see this, we scroll to the top... And select 'View User Snapshot'... This will randomly load an user... And we can see the different events that the user has triggered on the website.
This will include page views and any other events... We can click on an individual event to view more details... We can see things like, the page they viewed... And details for any of the other parameters collected with the event... If you want to randomly view another user, we can click the small blue arrows at the top... This loads another user, and again, we can see the different events that have been collected... So we can view snapshots of individual users in the realtime report.
And to exit the snapshot, you can navigate to another report, or click 'Exit Snapshot' on the right... Now let's select 'Acquisition'... And 'Acquisition Overview'... The acquisition reports are all about how people are finding the website.
On the overview report we can see similar details that we saw on the home report and the reports snapshot.
We can see the number of users, event count, conversions, and total revenue.
And again, we have the realtime card on the right.
Traveling down, we can then see how new users are finding the website.
So we have new users by first user medium... Medium tells you how the message was communicated.
We can see this includes organic, which will include people clicking through from the free search results on Google and other search engines... CPC for our paid ads... Referral for people clicking through from other websites... And more... We can modify what is presented in each card by selecting another dimension from the drop-down... For example, let's choose 'First User Source Medium'... This now updates to include the source, so where the message was seen, and medium, which is how the message was communicated... There are also cards that show new users by default channel grouping... And sessions by default channel grouping... Traveling down to the bottom... We can see sessions coming from our Google Ads campaigns... And a card showing the average lifetime value of our users... You can also use the links at the bottom of the cards to view the full report... And we can also adjust the date range used for the report.
Let's scroll back to the top... And select the current date range... You can then choose from predefined ranges, or choose your own custom date range... And you can use the compare option to compare two date ranges to see any changes.
Let's enable 'Compare'... And click 'Apply'... We can now see if metrics have increased or decreased in the report... Now let's select the date range again... Disable the comparison... And click 'Apply'... Apart from the acquisition overview, there are also dedicated reports for user acquisition... This shows you a breakdown of metrics for the first way users found your website... You can also change the dimension used for the report using the drop-down... And you can add a second dimension to the report using the plus sign... For example, if you want to see the way people found your website combined with their landing page, then we can add 'Landing Page' as a second dimension... Next, the 'Traffic Acquisition' report shows you how people found your website to start each of their sessions... So this report goes beyond the very first time they found your website which we've seen in the user acquisition report.
Since the report focuses on sessions, we can see more session-based metrics in the table... And just like the other report, we can change the dimension using the drop-down... The next set of reports we're going to look at are the 'Engagement' reports.
These reports show you what people are doing on your website.
This is where you can report on the pages people are viewing, events that are automatically collected using the enhanced measurement feature, and any other events you're sending to Google Analytics.
Let's select 'Engagement'... And then 'Pages and Screens'... This report shows you the pages people are viewing on your website.
Looking at the table, we can see pages are reported based on their page title.
And the report is ordered by the number of views, so the number of page views by default.
Let's select the default dimension... And change this to 'Page Path and Query String'... This now shows us the pages based on their URL.
It's showing us everything after our website's domain.
If you've been using Universal Analytics, this is like the default 'All Pages' report.
Apart from reporting on pages, you can also get a top-level summary with the overview report... And selecting 'Events'... Shows you all of the events that have been collected... This will include the default page view event, automatic events from the enhanced measurement feature we've discussed, and any other recommended or custom events that have been implemented on your website.
We're going to talk a bit more about events later in this tutorial, but if you're interested in a more in-depth lesson, then I recommend checking out my dedicated resources and courses.
I've included links in the description below this video.
And you can click on the name of an event to view a granular report.
Next, is the 'Conversions' report... This shows you the total number of conversions for the date range based on the events that have been marked as a conversion.
We will cover how to configure conversions later in the tutorial.
Now let's select 'Monetization'... And then 'Overview'... The monetization section includes ecommerce reports, plus reports for in-app purchases and publisher ads.
These two reports are specifically for measuring purchase and ad revenue in mobile apps.
The overview report shows us the total revenue for the website, so the total value from all events.
And the ecommerce revenue from transactions.
These metrics will be the same, unless you're assigning dollar values to events beyond ecommerce transactions.
Traveling down, we can see the total number of people who've made a purchase and the total number of people who have made a purchase for the first time.
These are both user-based metrics... We can also see the average user value... And the top items people have purchased... We can see the remaining cards in Google demo property are blank.
This is because they have decided not to implement ecommerce tracking for item lists, item promotions, or coupons... And since the property is used to measure a website and not an app, the two final cards which are specifically for apps are also blank... Let's open the 'Ecommerce Purchases' report... This report provides more granular details about the items people are purchasing on the website... We can see metrics for each item by item name... And choosing the drop-down lets you change the dimension used for the report... Next is the 'Retention' report... This report groups users into cohorts based on when users view your website.
The report shows you the number of new and returning users at the top... The 'User Retention' cards show you how often people access the website... And the 'User Engagement' cards show you the average amount of time people spend on your website... Looking at the 'User Retention' card... We can see that there is a sharp drop-off, which tells us most people don't return to the Google Merchandise Store, the vast majority only visit once.
At the very bottom, we can also see the average lifetime value of our users based on ecommerce transactions (and any other value) being collected into the property.
Now let's select 'Demographics'... And 'Demographics Overview'... This report shows you a top-level summary about the people viewing your website.
We can see where they're geographically located by country... The cities they're located in... And their language preference (based on the settings on the device they are using)... We can see there are some blank cards in this report... The cards showing gender... Interests... And age are all blank.
This is because Google has decided not to enable Google Signals for the demo property.
We will talk about Google Signals in a moment, but for your property, once you've enabled the feature you will be able to see these additional details for your users.
Next is the 'Demographic Details' report... This provides a granular break-down of metrics and we can see that the report shows us people's geographic location by country... Again, like the other reports we've seen, selecting 'Country' lets us change the report.
For example, we can choose 'City'... To see the metrics broken-down by city.
And you might be wondering about 'not set'... This is telling us that there are a portion of users where the city is unknown.
Basically, Google Analytics has collected details about the user, but isn't able to provide this specific information we've asked for in the report.
So you can think of 'not set' as 'unknown' in Google Analytics.
Now let's select 'Technology'... And 'Technology Overview'... The technology reports show you details about the devices people are using to view your website.
Traveling down the report, we can see people's operating systems... The browsers they're using... Device categories, so desktop, tablet, and mobile... And the size of their screens... There are some cards that are blank since they're used to report on apps and we're reporting on a website.
And traveling back to the top... Wherever you see 'Platform', this is showing you the type of data stream used to collect data into your reports.
Since this property only has a web data stream, we can see one hundred percent of users are associated with the 'Web' platform.
If you were using Google Analytics to collect data from a website and an app, you would see both of these under 'Platform'.
And let's open the 'Technology Details' report... This report is like the other detail reports we've looked at, and we can see it shows us the browsers people are using by default... And selecting the drop-down lets you switch to the other available dimensions... For example, we can select 'Device Category'... To then see the metrics broken down by the types of devices people are using to view the website.
So they're the standard pre-configured reports you will find in Google Analytics.
If you have editor-level access to the Google Analytics property, then you will also see an option at the bottom of the reporting menu that says 'Library'.
This option lets you customize the menu and the reports.
For Google's demo property, we don't have editor-level access, so we can't see this option.
And I also want to highlight that this is why you might see slightly different reports if you're using an existing property that someone else has set up.
Okay, let's select 'Explore'... The exploration reports let you create different custom reports and visualizations.
Across the top we can see the different types of reports we can create... We can create 'Free Form' reports which can include tables or other types of charts... 'Funnel Exploration' which lets you visualize particular steps you want people to travel through.
For example, steps to complete a lead form, or steps in your ecommerce checkout... 'Path Exploration' which lets you visualize the paths people take through your pages (or other other actions they take on your website)... 'Segment Overlap' which lets you apply multiple segments to see if users are included in one or more of your segments... 'Cohort Exploration' which lets you group users based on the days, weeks, or months they visit your website... 'User Lifetime' which lets you view additional lifetime user metrics... And in your own property you will also find 'User Exploration' which lets you drill-down on individual users.
This report isn't available in Google's demo property.
Selecting any of these options will load a pre-configured template.
So if you're getting started, then I recommend creating each one to explore the options.
Now, let's navigate back... We're going to create a new report from scratch in a moment, so we will be selecting 'Blank', but before we do, I also want to mention that traveling down... You will see any reports that you've created or that have been created by other people with access to the property... Okay, now let's create a new blank exploration report... We're going to walk-through the steps to create two exploration reports.
I'm going to show you how to create a report that shows you any custom campaigns that are sending people to your website.
For example, if you're using an email marketing platform, then most platforms let you automatically track your email campaigns into Google Analytics.
And we will also walk-through the steps to create a funnel visualization for the steps we want people to take in order to convert on our website.
Let's get started... Okay, on the top left corner we can name our report... Let's name this report 'Campaigns'... Now I'm going to change the date range... I'm going to select 'Last 30 Days'... And click 'Apply'... Next we need to add the elements we want to use in the report.
We can see there are options to create segments... Add dimensions... And add metrics... Let's click the plus sign next to 'Dimensions'... A dimension is a row of information in our report.
So for this report I want to show the names of the campaigns sending traffic to the website, so let's search for 'Campaign'... And I'm going to enable the 'Session Campaign' dimension... There are lots more dimensions you can choose from, but we're going to keep things simple today, so let's click 'Import'... Now let's click the plus sign next to 'Metrics'... And let's search for and select 'Sessions'... 'Total Users'... And 'Conversions'... Now let's click 'Import'... Now we need to add the elements to build our report.
Let's drag 'Session Campaign' under 'Rows'... And let's drag 'Total Users', 'Sessions', and 'Conversions' under 'Values'... We can see that the first few rows aren't for campaigns.
So 'not set', 'direct', 'organic', and 'referral'.
We need to remove these.
To do this, we're going to add a filter to our report.
Let's scroll to the bottom of the second column... Select 'Filters'... And choose 'Session Campaign'... Now let's choose 'Does Not Match Regex' which lets us enter a regular expression.
This is a bit more advanced, but just copy what I'm about to enter and you'll be fine.
And if you would like to learn more about regular expressions, then check out the extra resources below this video.
Now I want you to enter 'carot', 'backslash', 'open parenthesis', 'full stop', 'asterisk', 'backslash', 'close parenthesis', 'dollar sign'... This will exclude any campaigns that start and end with a parenthesis.
Now let's click 'Apply'... We've now created a report that only includes our campaigns.
Great work!
Now we're going to create one more exploration report, so let's navigate back... And create another blank report... Let's name the report 'Conversion Funnel'... Adjust the date range... And this time, let's select 'Free Form' at the top of the second column... And change this to 'Funnel Exploration'... Now in the second column I want you to look for 'Steps'... And click the pencil icon... Now you can specify the steps you want people to complete on your website.
We're going to focus on pages, but you can base your funnel on any of the events you've collected into your property.
Let's name the first step 'Billing and Shipping'... And for the condition, let's search for and select 'Page Location'... Then we click 'Add Filter'... I'm going to leave 'Contains' as the match type, but you can change this to Regular Expression for more advanced matching, or any of the other options.
Now we're going to enter 'yourinfo', 'dot', 'html' as the value... And click 'Apply'... Now let's click 'Add Step'... At the top of the second step, we can see it says 'is indirectly followed by'... You can select this and change it to 'is directly followed by'.
For example, choosing this option would mean people won't be included in the funnel if they view another page in between steps.
For my funnel, I don't mind if people view other pages or perform other actions, so I'm going to change this back to the default of 'is indirectly followed by'... And on the right, you can see there is an option to set a time limit, so the step needs to be viewed within a certain period of time.
I'm going to leave this disabled.
Now let's name the step 'Payment'... And let's select 'Page Location' as the condition... And we're going to add a filter... And enter 'payment', 'dot', 'html'... And click 'Apply'... Now let's add another step... Let's name the step 'Review'... Let's select 'Page Location'... And enter 'revieworder', 'dot', 'html'... And click 'Apply'... And let's add one final step... Let's name it 'Checkout Complete'... Select 'Page Location'... Add a filter... And enter 'ordercompleted', 'dot', 'html'... And click 'Apply'... Now let's click 'Apply' on the top right corner... We can now see the steps we've defined and the visualization at the top shows the number of users who make it through each step.
Below the visualization, you can see the number of users who drop-off at each step... And you can see a breakdown of metrics for the funnel in the table... You can customize your funnel report further.
For example, you can enable the 'Make Open Funnel' which means users can enter the funnel at any step you've defined, rather than needing to travel through the first step.
And you can change from a standard funnel to a 'Trended Funnel' to see the trend for users based on the funnel step and the date range.
Now that we've looked at the exploration reports, we're going to cover the advertising reports in Google Analytics.
These reports let you view the relationship between your marketing channels, and they let you apply different attribution models.
Let's navigate to 'Advertising'... The 'Advertising Snapshot' provides a top-level summary for your marketing channels.
At the top you can see the channels that drove the most conversions... We can then see automated insights based on Google's machine learning... And traveling down, we can see the top paths leading to conversions... Now let's open the 'Model Comparison' report... The report lists our marketing channels on the left... And moving to the right we can see the number of conversions and revenue for each channel.
These metrics are reported twice... The first set of metrics use the 'Last Click' attribution model... And the second set of metrics use the 'Data Driven' attribution model... So the report allows us to compare how credit is given to our marketing touch-points based on these two different models.
On the very right of the report, we can then see the difference between the two models.
So we can see the percentage increase and decrease when we compare them.
And we can also change the attribution models we are comparing in the report.
To do this, we can select a new model from the drop-down... I'm going to leave the defaults... To use the report we want to look for significant changes between the models.
Changes that have a positive percent mean that we're potentially under-valuing the marketing channel when we use the last click model.
And a negative percent tells us that we're potentially over-valuing a marketing channel when we use the last click model.
The next report is the 'Conversion Paths' report... This report provides a visual representation of the marketing touch-points people engage with before converting.
For example, we can see some rows show us that some users engaged with our organic search listings multiple times before converting... And as you travel through the rows in the report... You will also see paths that include multiple channels... This helps you understand the relationship between your channels and how they drive conversions on your website.
I also want to highlight that you can customize the report by changing the dimension used for the paths... By changing the attribution model used for the report... And by choosing which conversion events are used in the table and visualization... Okay, now that we've covered the reports it's time to look at the ways we can configure Google Analytics.
We're going to start by looking at the 'Configure' section.
This is where we can configure conversions, create custom audiences, and more.
Let's navigate to 'Configure'... And we can see we're looking at 'Events'.
This shows us all of the events that have been collected into the property... This will include events that are automatically collected, like the 'first_visit' event, the 'page_view' event, and the 'session_start' event... And if you're using enhanced measurement, then additional events can also be collected automatically.
This can include the 'click' event for outbound clicks, and the 'scroll' event for people scrolling ninety percent of a page.
Then you can also implement other events to track certain actions and details on your website.
This includes the 'add_to_cart' event and 'purchase' event for ecommerce transactions.
Along with any other events you've implemented on your website.
If you have editor-level access to Google Analytics, then the 'Modify Event' and 'Create Event' buttons will be clickable at the top... Since I'm using Google's demo property and I don't have editor-level access, I can access these options.
The 'Modify Event' option lets you change the values used for the parameters that are sent with each event.
And it also lets you change the name used for an event.
And the 'Create Event' option lets you create a new event based on an existing event in Google Analytics.
That might sound strange, but we will use this option in a moment to configure a conversion in our reports.
And the other option that will be available if you have editor-level access, is you will also be able to mark individual events as conversions by clicking the switch on the right.
Again, I can't do this in Google's demo account.
So to cover the steps to configure a conversion inside Google Analytics, we're going to use my own demo property.
Let's head to my demo property... We can now see that 'Modify Event' and 'Create Event' are available... And we can also mark individual events as conversions... Okay, so if you see the event you would like to use as a conversion, and you have editor-level permission, you can simply click the button to enable the event as a conversion.
Once enabled, every time the event is collected into Google Analytics a conversion will also be counted in your reports.
This is perfect if you wanted to track people watching videos, or scrolling, but if we were to enable the page view event as a conversion, then every time someone views a page on our website a conversion would be counted.
However, this doesn't work if you only want to track a thank you page (or confirmation page) as a conversion in Google Analytics.
If you want to track a specific page as a conversion, like your thank you page, then you will need to track that individual page as a unique event first.
There are two ways to do this.
The first option is to create a new event inside Google Analytics based on an existing event.
For example, we can trigger a new event when a page view is reported for our thank you page.
This is the easiest option since everything can be set up inside Google Analytics.
The second option is to configure a new tag in Google Tag Manager that will send an event every time someone views the thank you page.
For example, we could send an event called 'generate_lead' when someone completes the form on our website.
In this tutorial, we're going to cover the first option where we trigger a new event inside Google Analytics, but if you would like to use Google Tag Manager, then I've included links to my extra resources in the description below this video.
Okay, let's select 'Create Event'... And now let's click 'Create'... I want to track people viewing my thank you page as a separate event, so I'm going to name my event 'generate', 'underscore', 'lead'... And now we need to configure the conditions for when we want this event to be triggered.
Let's enter 'event', 'underscore', 'name'... Then 'equals'... And let's enter 'page', 'underscore', 'view'... This ensures that we're only matching page view events.
Now let's click 'Add Condition'... And we're going to enter 'page', 'underscore', 'location'... Then 'contains'... And let's enter 'thank', 'dash', 'you'... This will mean our new event will trigger every time someone views a page on our website that has a URL containing 'thank you'.
Let's leave 'Copy parameters from the source event' selected... This will mean all of the parameters from the original page view event are also available in the new event when it's triggered.
And here's an optional step.
Let's click 'Add Modification'... And let's enter 'value' as the parameter name... And '50' as the value... Now let's click 'Add Modification' again... And let's name the parameter 'currency'... And enter 'USD' as the value... Adding these two parameters to our new event means we're assigning a value of fifty US dollars every time someone converts.
You can adjust this to the value of your particular conversion and your preferred currency.
Now let's click 'Create'... We've now created a new event that will be triggered when someone views a page with a URL containing thank you on our website.
Once someone views a page that matches our condition, you will be able to see the event in the real time reports within ten to fifteen minutes.
However, the standard reports, including the events report we were looking at previously, typically takes 12 to 24 hours for data to show up.
So if someone visits the thank you page now, I recommend checking back tomorrow to see it in your reports.
Okay, let's close this... Since you won't see your new event in this report straight away, you can wait until it shows up to enable it as a conversion, or you can pre-configure your event as a conversion in advance.
This means that once the event is triggered it will also be marked as a conversion.
To do this, let's navigate to 'Conversions'... And let's click 'New Conversion Event'... Now we need to enter the name of our conversion event exactly as we named it when it was created.
Continuing our example, this would be 'generate', 'underscore', 'lead', all in lowercase... Now we can click 'Save'... Once our event is triggered it will also be counted as a conversion.
And if you're wondering, you can enable up to 30 unique events as conversion in Google Analytics, so you should have plenty of scope to track all of your important actions as conversions.
Now let's navigate to 'Audiences'... You can create audiences to report on particular groups of users.
For example, you might want to use an audience to focus on users who make multiple purchases on your website, or to focus on users who haven't converted yet.
Apart from using audiences to focus your reporting, audiences can also be used for remarketing in your linked Google Ads account.
You will see any audiences that have already been created in the property.
And if you're just getting started, you will see two predefined audiences that are automatically available.
These are 'All Users' and 'Purchases'... So 'All Users' is for everybody who has been to your website (or used your app).
And 'Purchases' are for people who've completed an ecommerce transaction on your website (or made an in-app purchase).
If you haven't sent a purchase event to your property, then this will be empty.
Next is 'Custom Definitions'... This is where you can register parameters that have been sent with events as either custom dimensions or custom metrics to use in your reports.
As we've seen in the standard reports and the exploration reports, there are lots of default metrics and dimensions that are automatically available in Google Analytics.
Google has even added metrics and dimensions that weren't available previously, so if you're getting started, just remember you can add extra dimensions and metrics to your reports using custom definitions.
Finally, in the 'Configure' section is the 'DebugView' which lets you test your implementation to see a live view of events as you check things on your website.
We will look at this in a moment when we use Tag Assistant with Google Tag Manager.
Now let's navigate to 'Admin'... We're going to touch on some of the most important setup options for your property.
First, 'Property Settings' is where you can change the name of your property, check the reporting time zone, the currency used for your reports, and even move your property to another account... 'Property Access Management' lets you control who has access to your property and account... We've already talked about data streams, but this is where you can get the measurement ID and tracking code to add to your website... 'Data Settings', and then 'Data Collection' is where you enable Google Signals... This is the feature you'll need to enable to see age, gender, and interests in your reports.
You will also need to enable this to use audiences in your linked Google Ads account... 'Data Retention' lets you set how long to keep user identifiable data in your reports.
You can choose between two and fourteen months... 'Data Filters' is where you can configure a filter to exclude your internal traffic from reports... Then there are some additional settings and options you can use with your property.
These are all more advanced, so I want to highlight the options under 'Product Linking'... This is where you can link your Google Ads account, Google Optimize, and Google Search Console... I definitely recommend taking the time to link Google Ads and Google Search Console for additional reports and insights in your Google Analytics property.
We've now covered how to create an account, we've walked through the reports, and we've looked at the configuration options and the admin area.
Finally, I'm going to show you how to add the Google Analytics tag to your website.
To add the Google Analytics tag to your website, I generally recommend using Google Tag Manager, since it provides additional flexibility.
To do this, you will need to get the measurement ID for your data stream, so let's select 'Data Streams'... And then select the data stream that we created at the start of the tutorial... Now we just need to copy the measurement ID on the top right corner... And head to Google Tag Manager... We can see that we already have a Universal Analytics tag, so now we need to create a new tag... Let's name the tag 'Google Analytics GA4'... And let's select 'Tag Configuration'... Now we need to choose 'GA4 Configuration' as the tag type... And past the measurement ID we copied from our data stream... Then we need to select 'Triggering'... And select the 'All Pages' trigger... This will mean that the GA4 tag is added to all of the pages of our website.
Now we can save the tag... And let's click 'Preview'... Enter the URL of our website... And click 'Connect'... We can see Google Tag Assistant has loaded... And we can navigate through our website and complete any actions we're tracking using Google Tag Manager... Now let's select the Tag Assistant tab... And we can see that our GA4 tag has been fired... Now let's head to Google Analytics... And open the 'DebugView'... We can now see the events that have been collected using Tag Assistant.
When you're happy that everything is working, you can head back to Google Tag Manager and publish the changes to your live website.
You will then be collecting data into Google Analytics 4.
So that's how you can get started with Google Analytics 4.
In this tutorial, we've covered how to create an account and property, we've walked through the reports, and looked at the different configuration and customization options in Google Analytics.
If you would like to learn even more about Google Analytics, then please take a moment to check out the extra resources and other tutorials in the description below this video, as well as my courses.
Do you have any questions about Google Analytics?
I'd love to know, let me know in the comments below.
I hope you enjoyed the video.
If you did, then please like it, and I'm looking forward to seeing you in the next video.
Up Next

16:18
How to Buy and Sell Websites on Flippa: A Complete Guide to Auctions and SEO
@darrelwilson
54.2K views•2016-10-06

12:54
Triumph of Orthodoxy Icon: Byzantine Art & History Explained
@BenCallan
2.1K views•2024-08-06

9:49
FastAPI vs Flask vs Django: Choosing the Right Python Web Framework
@TechWithTim
302.5K views•2024-05-26

1:42
Game of Thrones Opening Credits: A Cinematic Analysis
@gameofthrones
46.3M views•2011-04-18
Related Study Plans & Knowledge Roadmaps
Structured learning paths in General & Interdisciplinary Studies
general-studies
Elevator Engineering: History, Physics & Cities
01From Hoists to Safety Brakes: The Dawn of Vertical Lift
02Hydraulic vs. Traction: The Engineering Physics of Elevators
03Modern Speed, Safety, and Algorithms
+ 2 more learning modules
12h5 modules
Explore Roadmap
general-studies
Rubber: Material Science, History & Geopolitics
01Origins of Natural Rubber & Mesoamerican History
02The Chemistry of Natural Rubber & Vulcanization
03The Geopolitics of the Rubber Boom & Colonization
+ 2 more learning modules
12h5 modules
Explore Roadmap
general-studies
Containerization: Evolution, Logistics & Trade
01Ancient Trade & Bulk Cargo: Amphorae to Barrels
02The Industrial Revolution & Cardboard Packaging
03The Containerization Revolution: Malcom McLean
+ 2 more learning modules
12h5 modules
Explore Roadmap
general-studies
Textile Tech: Evolution, Labor & Global Impact
01Pre-Industrial Textiles: Handloom & Cottage Industry
02Mechanization: The Spinning Jenny to the Power Loom
03The Factory System & Global Labor Transformation
+ 2 more learning modules
10h5 modules
Explore Roadmap