

![Praat & Scripting, Part A, Chap 01, [02_p26], 윤규철 교수](https://i.ytimg.com/vi/OTSrkvpnTg4/maxresdefault.jpg)






![[1-6 (E) Praat] Boundaries: Creating, moving, removing](https://i.ytimg.com/vi/ozlfUdm6JNQ/maxresdefault.jpg)

![[IATEFL PronSIG webinar] Introduction to using Praat in pronunciation teaching - Pavel Šturm](https://i.ytimg.com/vi/p7-rk9D6cwo/hqdefault.jpg)




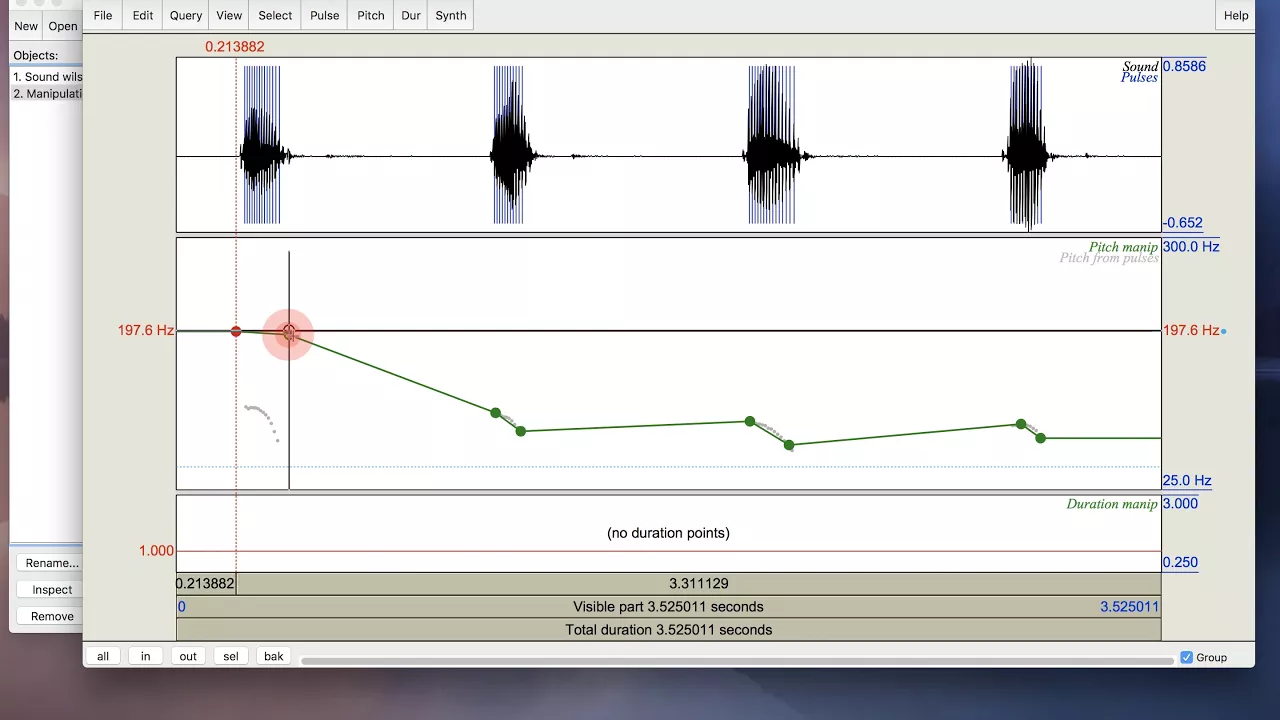





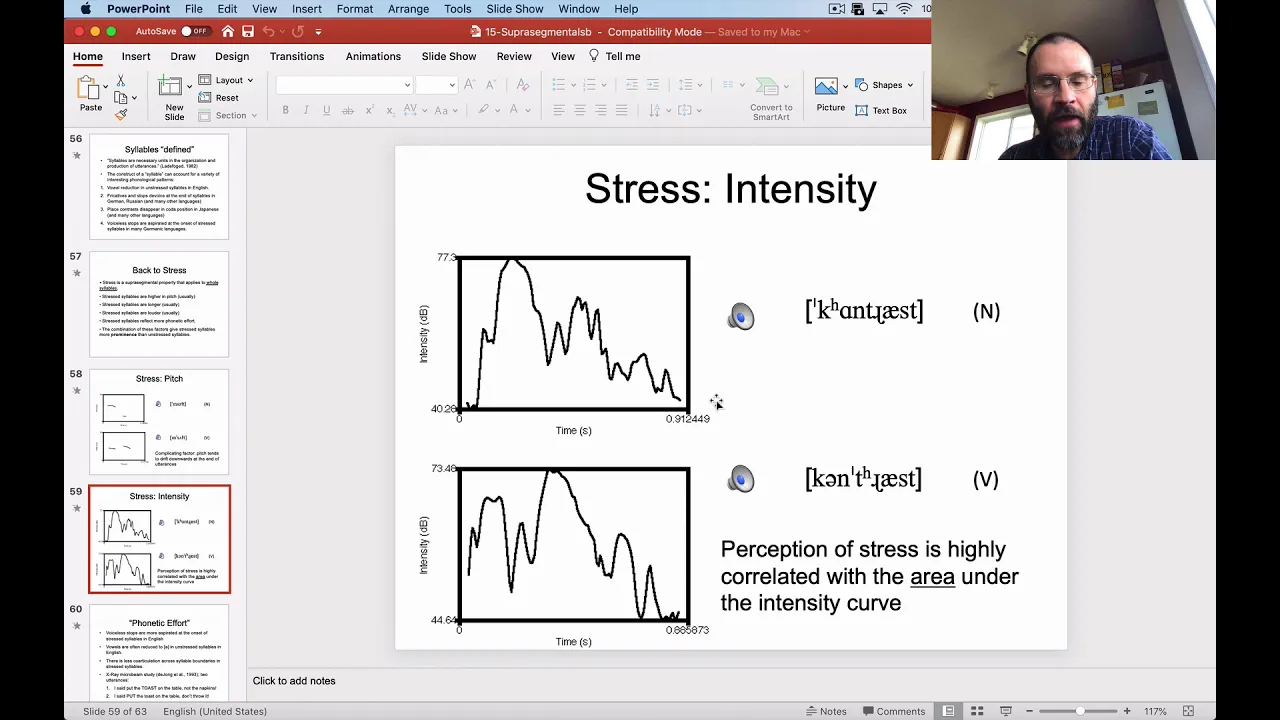

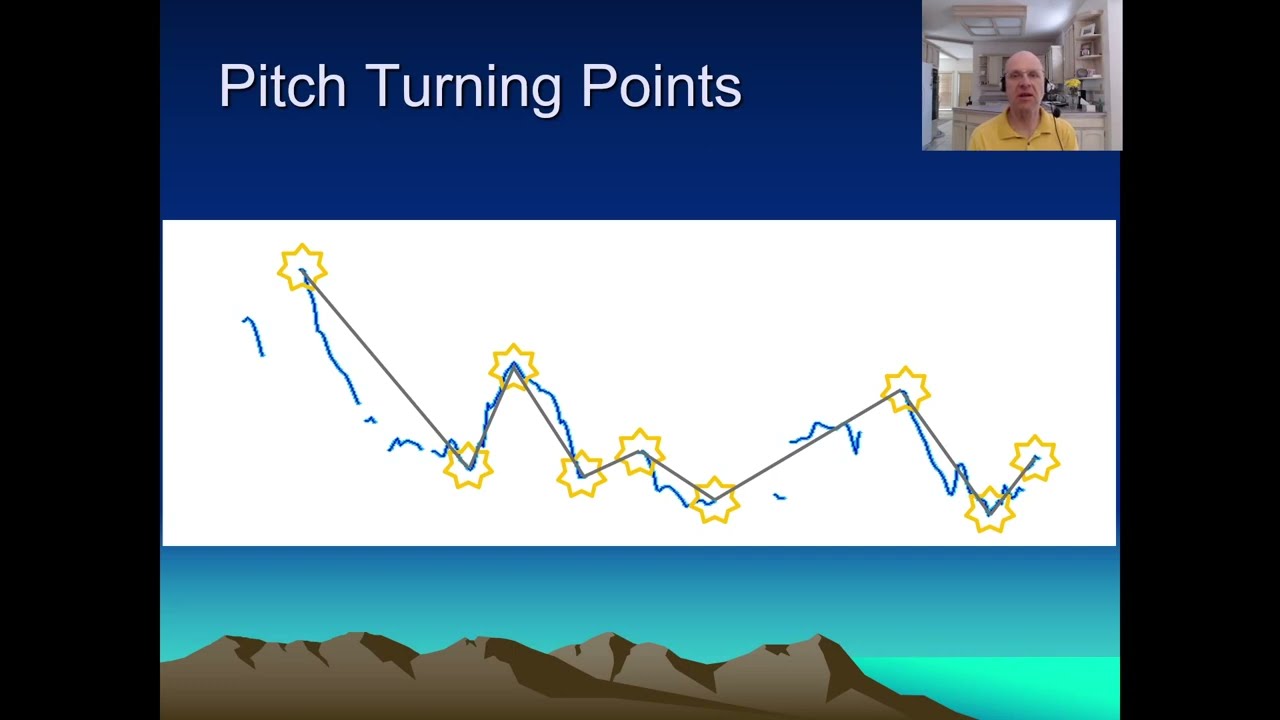



This tutorial demonstrates how to extract pitch and intensity contours from audio recordings in Praat software and plot them together with word-level annotations to analyze suprasegmental features of speech, including the steps to import sound files, extract acoustic measurements, create text grids for annotations, and customize multi-axis plots for visual comparison.
Plotting Pitch and Intensity Contours with Annotations in Praat
Added:Basic familiarity with the Praat user interface, including loading audio files and opening the Objects and Editor windows.
Fundamental concepts of acoustic phonetics, specifically what fundamental frequency (F0/pitch in Hz) and intensity (amplitude/loudness in dB) represent physically.
An understanding of Praat TextGrids and how interval and point tiers are used for phonetic segmentation and annotation.
Basic knowledge of digital audio properties, such as sampling rates and how background noise can affect pitch tracking.
Praat scripting to automate the extraction of pitch, intensity, and duration measurements over large acoustic datasets.
Exporting raw acoustic data coordinates to R or Python for advanced plotting (e.g., using ggplot2 or matplotlib) and statistical modeling.
Applying pitch and intensity contours to prosodic analysis frameworks, such as ToBI (Tones and Break Indices) for intonational phonology.
Advanced acoustic visualization techniques, such as tracking and plotting formant trajectories (F1, F2) to analyze vowel quality over time.
37.4K views512likes10:22Original Release: 2016-04-08
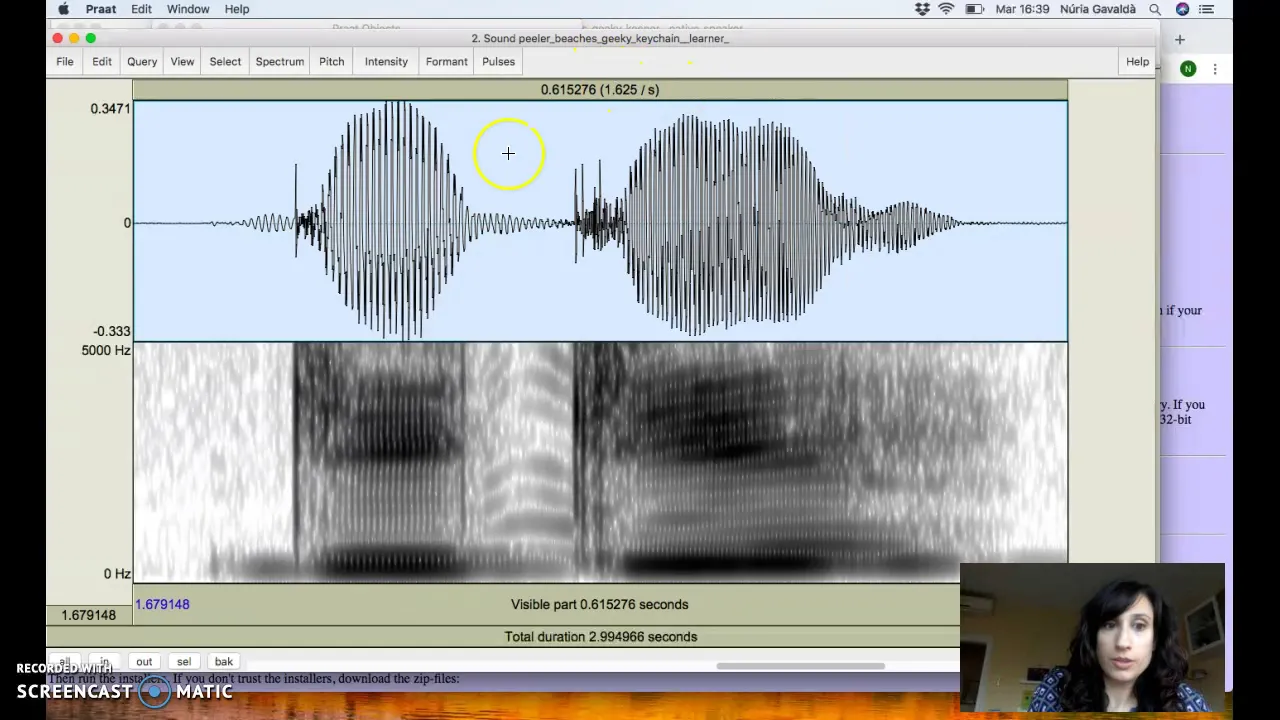
hello there I'm going to show you how to do a quick and dirty job of extracting a pitch Contour an intensity contour and putting in annotations in Pro first things first we're going to need a sound file I have one here on my desktop this is something that I have downloaded from the talk bank.org website there's lots of good sound files there that you can use next step is to take a look at the sound so we'll go to view and edit here we can see the uh waveform sonogram and if we uh just select a little bit right here take a listen to that oh I know that that's exactly so that'll be fine for our purposes here can uh zoom in like this and here we can see the spectrogram as well so let's just take a small bit of this that's exactly maybe we could just take uh this little selection right here let's take a listen to that oh I know I get a little bit more of the whole phrase oh I know that all right that'll do just fine here's somebody saying oh I know that so while we have this selected let's go up here to file and extract this selected sound uh and right now I'm just going to set this to zero you can also choose to preserve the times from the original segment but I'm just going to choose zero and if we go back over here to the pro objects window uh here is our sound we can just uh rename it and there we go all right so now let's just take a look at the segment that we chose here we'll get rid of that uh we'll go to view and edit again for our new sound and here we can see just the selection that we made oh I know that great now we want to do two things here we want to find the pitch contour and also an intensity Contour so here let's go to pitch and we'll say show pitch and pro does its best to uh find the uh pitch contour for this phrase and we can do the same thing with intensity we've asked Pro to calculate this pitch and intensity by saying show pitch and show intensity and we can also get it to extract those values so that we can do different things with them and uh we'll do that right here we'll say extract visible pitch Contour and over here uh now we have an Untitled pitch object we can just rename that here so that we know what we're dealing with and we can do the same thing with intensity extract visible intensity Contour rename that as well okay so now we will would like to add some words we' like to add some annotations and we can do that here by going back to the sound object and clicking on annotate to text grid we're asked to give a uh a name for the tier here we're going to keep it very simple so I just have one called words uh and none of these are Point tiers in this case all right we' got our text uh grid and here let's uh click on the this together with uh the sound so I'll highlight both of these simultaneously and go to view and edit again at this point we can begin picking out the areas that we want to annotate let's start here there's a little section so here's the person saying O so I'll click here to make uh a little marker for the beginning and you can see I haven't been super precise here but you might want to be more precise than I'm uh doing this video in any case I'm going to click here to uh make the beginning Point uh and then there's a little circle here we'll click on that that sets this beginning uh point for our selection I'll find the end here again all right somewhere right around there is fine for our purposes today click in this circle and now we have uh a segment here and uh up here at the top there's a little text box and uh I can just going to write oh all right now we're ready for our next word looks like it might go to somewhere around here now it's a little tricky because there seems to be a little bit of ciculation going on there but uh we don't really care about that for right now uh right now we're just operating at this word level so I'm going to just click again here create a new uh segment and I'm just going to annotate this as I all right we'll keep going next word might be around here no no no so we can add a boundary there if you uh if you mess up and decide that you you uh put a boundary in the wrong place and you want to get rid of it uh that's easy enough you can just go up here to boundary uh and remove and that's all taken care of so uh let's click on this section here um and write no and then the last part here that all right so now we are done uh editing our text grid we have the sonogram we have the pitch and intensity information extracted and we have the annotations here so at this point let's go back to the uh objects window and let's plot that pitch Contour that we extracted before uh together with the words together with the annotations that we just added there's going to be two elements M here that we need uh the first thing is we're going to need our text grid because we want those words that we just typed in and then we're also going to want this pitch object because we want this uh to show the relationship between the words and the pitch Contour so we'll select both of these at the same time go up to draw here we've got lots of choices uh I'll leave it up to you to try them out and see what you like best um I'm just going to go to this one here that says speckle again uh lots of different options uh we're just going to take the defaults for right now and just look at that Pro gives us a lovely little illustration of the extracted pitch Contour together with our own annotations so we can see the relationship between the words and the pitch Contour now there are many different factors contributing to super segmental pro uh pitch is just one of them so let's add in one more and look at intensity as well well so now we're going to have to be a little bit careful here because uh The Next Step will be to add in uh this intensity uh object but we might want to be a little bit careful about how we plot it in here because um as it is right now it's simply going to get plotted in right smack dab on top of this uh pitch contour and we might want that um but uh we might want to modify things a little bit uh just to see uh some of the things that we might want to keep in mind let's just go here and do that we'll say intensity H draw and okay and things freak out a whole lot over here now we can get rid of most of that by just clicking um but I would say there's still some things that are not entirely satisfactory about this plot uh among other things the uh labels here are on top of one another and the intensity Contour is also uh much much uh larger than the pitch Contour because of the difference in the uh units of the y AIS all right so let's see what we can do about this uh with any luck I can just uh command Z or control Z to get rid of that um you can always uh go up here and just erase all and start all over again if things go completely wrong so uh what we're going to do here is take this little orange uh square and let's let's highlight just the bottom part I'm going to try to put the intensity Contour underneath here so now we've limited the area that can fill up and uh we'll essentially have two ya axis overlapping here but hopefully it'll look a little tidier than it did before and now that I think about it let's also draw this with a different color so to do that let's go up here to pen and we can choose a whole bunch of different things here let's just choose a red color uh for the intensity contour and again things go a little bonkers but uh all we need to do is just redraw the window like that and so without all those preliminaries out of the way let's go back over here uh to the intensity object say draw and add it in there and just click somewhere down here and take a look at it so again you can do this how you like Pro gives you lots of different options uh but here at least uh I think it's a little bit easier for us to see the pitch contour and the intensity Contours uh separately uh but still in the same context the context of these annotations that we've added in so as a final step let's just take our figure and Export it so that we can use it in some other document somewhere as always here in the drawing window we're going to want to select the part that is uh of Interest the part that we want to export and then it's just a matter of going up here and choosing your export options I'm going to go with save as PDF and let's take a look at the result and there we have it folks we have pitch Contour intensity Contour annotations and separately labeled Y axis here for the Hertz and decb there's lots more that could be done here but hopefully this is enough to get you started
Up Next
4:00
Reading Spectrograms: Consonant Classification Explained
@oer-vlc
50.5K views•2015-07-02
36:52
Constraint Interaction in Optimality Theory: Epenthesis & Deletion
@Vidyamitra
180 views•2018-08-20

8:59
Forensic Linguistics: How Language Solves Crimes | PBS
@pbsstoried
1M views•2024-01-25

21:32
Accent Expert Explains U.S. Regional Dialects | Part 1
@WIRED
9.3M views•2021-01-21
Related Study Plans & Knowledge Roadmaps
Structured learning paths in Linguistics
linguistics
Optimality Theory: Tableaux & Constraints
01Phonological Basics: Sounds, Syllables & Rules
02Foundations of Optimality Theory: GEN, CON, and EVAL
03The Constraint Inventory: Markedness vs. Faithfulness
+ 2 more learning modules
15h5 modules
Explore Roadmap
linguistics
Morphosyntactic Alignment: S, A & P Systems
01Foundations of Syntax: Transitivity and Arguments
02The Linguistic Variables: Mapping S, A, and P
03Nominative-Accusative Alignment
+ 3 more learning modules
12h6 modules
Explore Roadmap
linguistics
Analyzing Sign Language: Phonology & Syntax
01Foundations of Sign Language Linguistics
02Phonology: The Five Parameters of a Sign
03Morphology: Word Formation and Classifiers
+ 2 more learning modules
14h5 modules
Explore Roadmap
linguistics
Pragmatics: Speech Acts, Grice & Politeness
01Introduction to Pragmatics: Meaning in Context
02Grice’s Cooperative Principle & Implicature
03Speech Act Theory
+ 2 more learning modules
14h5 modules
Explore Roadmap