


![치매에 파킨슨병까지?! 과학자들이 경고한 미세플라스틱의 정체 (feat. 심원준 박사) [취미는 과학/ 35화 확장판]](https://i.ytimg.com/vi_webp/9Tcry58_vqY/maxresdefault.webp)













FT-IR microscopy with automated analysis software provides a non-destructive, fast, and cost-efficient method for identifying microplastics by analyzing their unique chemical fingerprints, enabling automated particle classification, size measurement, and contamination minimization through proper sample preparation and laboratory protocols.
Microplastics Analysis via FT-IR Microscopy: A Guide
Added:Fundamental principles of Infrared (IR) Spectroscopy, including molecular vibrations, absorption bands, and functional group identification.
Basic definition, classifications, and environmental significance of microplastics and nanoplastics.
Introduction to optical microscopy, specifically concepts of spatial resolution, magnification, and sample illumination.
Standard sample preparation workflows for environmental and food matrices, such as density separation and chemical digestion of organic matter.
Advanced spectral interpretation and the use of polymer library databases to identify weathered or degraded plastic particles.
Comparative study of alternative microplastic analysis techniques, such as Raman Microscopy, Pyrolysis-GC-MS, and SEM-EDX.
Application of chemometrics, automated image processing, and machine learning algorithms for high-throughput particle counting and size distribution analysis.
Ecotoxicological risk assessment and translating quantitative microplastics data into environmental policy and food safety regulations.
25.9K views442likes35:37Original Release: 2021-08-18
hello and welcome to a webinar on microplastic analysis with ftlr spectroscopy i'm martin zeba an expert for microplastic analysis among other things at brook optics and i'm really glad that so many of you could join today and for everyone that attends we also have a list of further resources and reading provided along with the webinar because we cannot go into detail on every topic but we'll just scratch the surface in some aspects and you can read up on this if you like using this material so without any further ado let's jump right into the presentation so what will we talk about today so first analytical methods and why and when you should use ftir then there's the experimental setup for sample pre-treatment and filtration so laboratory equipment how to minimize contamination pre-treatment of different samples and their filtration then analytical considerations regarding ftir microscopy and imaging and how to automate the measurement and also how to automate data evaluation so the less effort the better the higher the throughput in the end and show you a few examples with hands-on from sea salt river sediment and also from milk so there are many different analytical approaches one of them for example is visual microscopy in combination with nile red staining that is an agent that colors all plastic particles but not other particles but this is not very reliable as you're doing this with the naked eye so this is very tiring very time consuming and you have no polymer identification so you don't know what kind of polymer you actually found there a very common and very good technique is pyrolysis gcms here you get very precise information about the mass distribution of the particles and the identity of the polymers as well but you get no information about the particles and this is also a destructive technique where the sample is destroyed during the measurement and you can only have small amounts per run so you need to prepare your sample quite extensively to have it in a quality that it can actually be measured by gcms and then there's vibrational micro spectroscopy this gives you exact information about the particle identity size and the numbers and this is the most important information to assess any biological threat the particles you find might pose it also gives you a rough mass estimate but it's really very rough only and it's a non-destructive technique so your sample will be alive afterwards and you can measure it again in case you want to have a look at it again it's also the fastest method available to obtain results and the most cost efficient regarding material needed and also labor time okay so this is why we're talking about ftir and we want to focus on this today but to do fdar spectroscopy we need fdi spectrometers and here we have two analytical instruments and these spectrometers are on the one hand for microscopic particles so the ones that are quite large or too large for a microscope and this is our alpha 2.
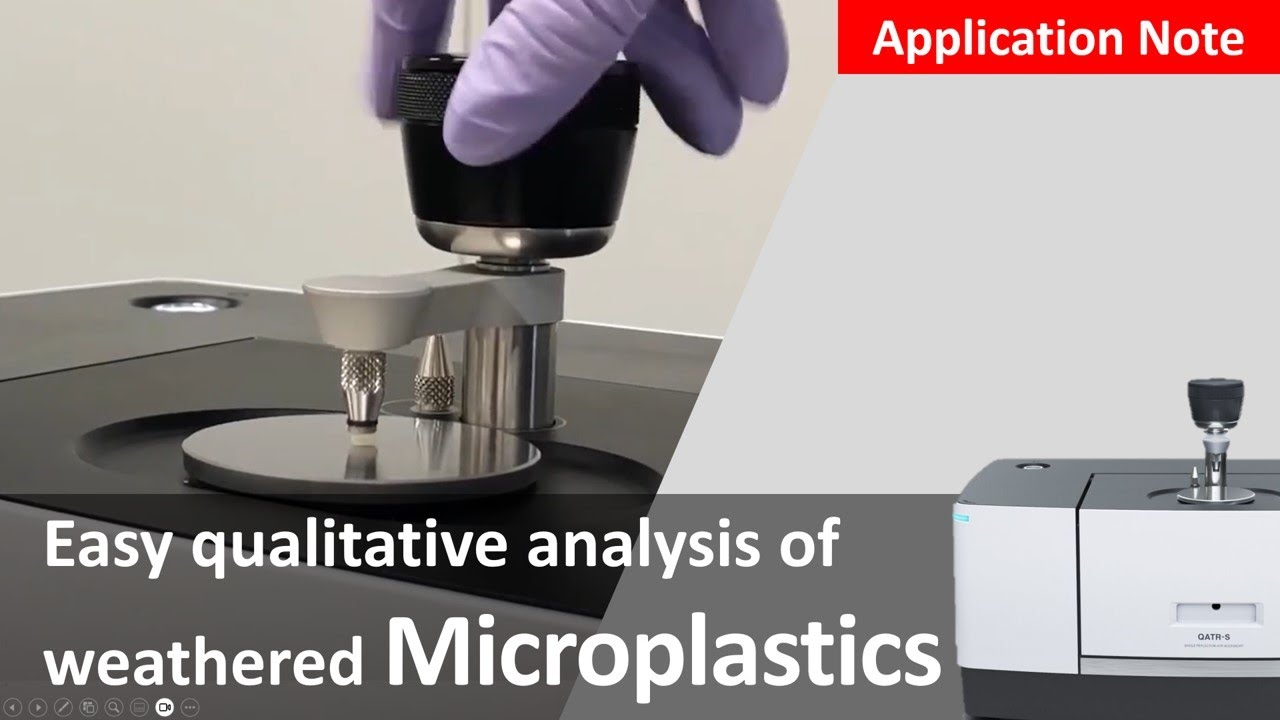
it's a very compact ftlr spectrometer that comes with interchangeable accessories so this is an atr accessory which will be used for polymer measurement it's quite robust and reliable very little to no maintenance and the integrated touch panel you see at the back makes it independent from any bigger pc or laptop for its operation and for microscopic particles we have the lumos 2.
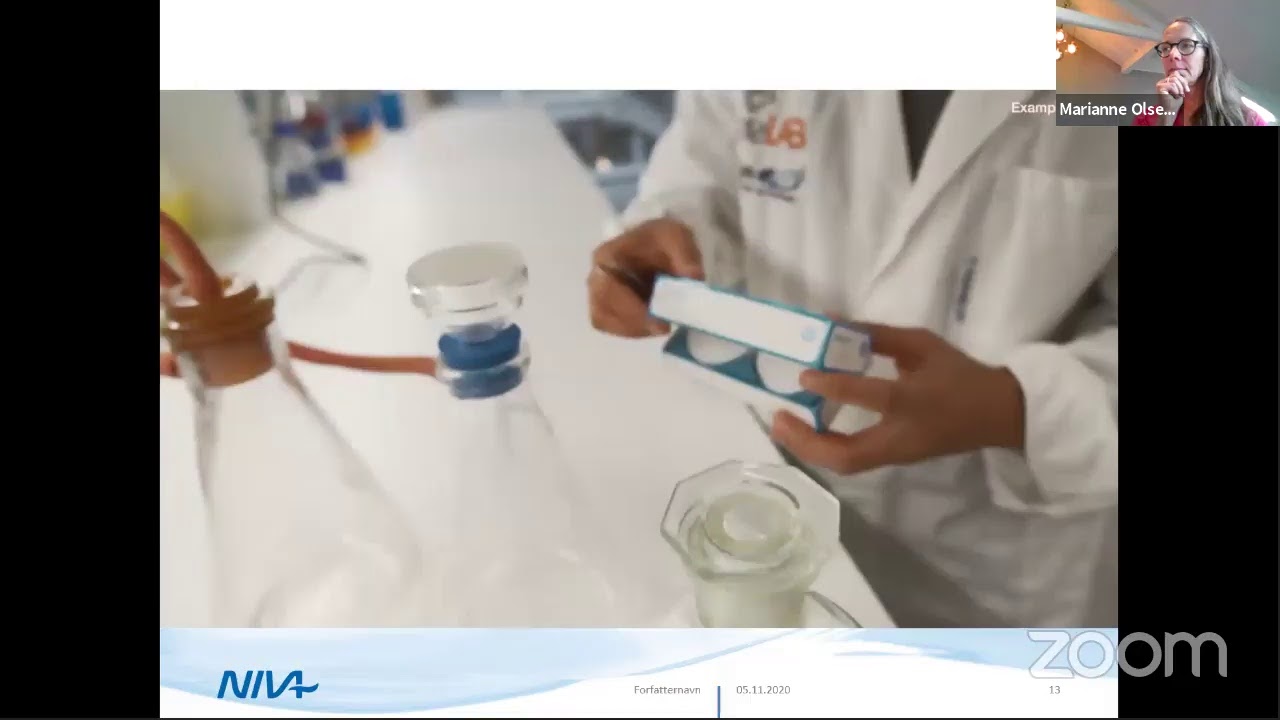
it's a standalone imaging microscope that means it doesn't need any base spectrometer and it's all over compact design also enables high light throughput and very little loss it's fully automated so there is no user interaction required for example the atr crystal or the imaging of the filters so it's fully automated everything controlled by the software and it offers the fastest imaging speed with a focal planary technique but a little back to our laboratory equipment we need for sample preparation basic glassware beakers steering rods maybe a funnel basic chemicals for sample treatment like potassium hydroxide zinc chloride petri dishes for filter storage or any other storage option and very important we need a particle-free water supply that we're not contaminating our sample for the filtration we probably need mesh c filters to do a pre-sorting of the large field of the large particles from the smaller ones nanodisk filters for the filtration or the final filtration of the particles that are measured with the microscope a filter holder a suction flask a vacuum pump which makes the setup look something like this what can you do to reduce contamination what equipment is required first airborne particles are basically everywhere so air filtration is very important best done it's in the filtration of the ventilation system have some overpressure in your lab that the filtered air is pressing out the air that is unfiltered and would come from the outside to induce contamination and for quality control you can have a particle counter in your lab but this is all quite complicated and maybe a bit too much so there is also a laminar flow bench this is a somewhat more simple setup where you have with the number one where air comes in it's collected at the place of entry at number two goes through a filter that all particles are removed and then by this pump it's pumped downward to create a constant airflow and over pressure just in this area to protect your sample also with an outward airflow that stops any air from entering in this chamber and this already reduces the contamination by a factor of 25.
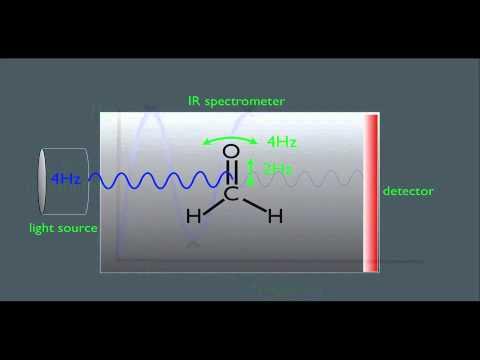
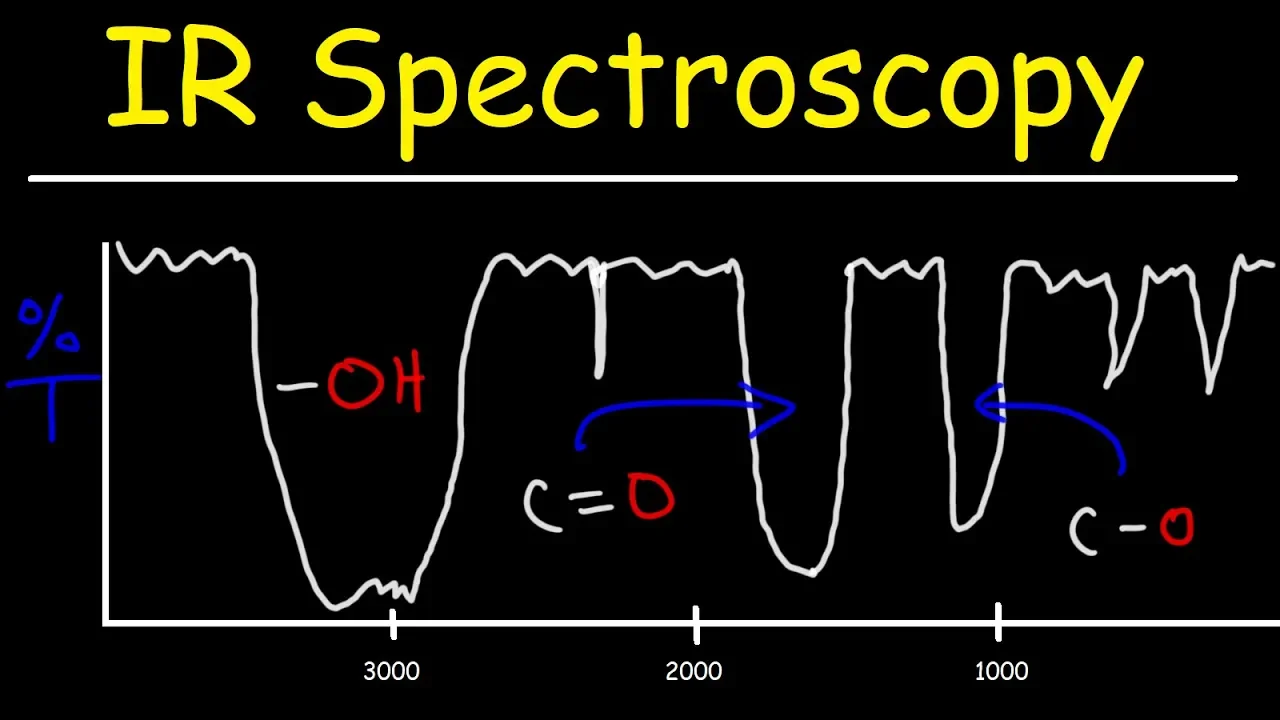
so this is what a setup could look like this image was taken at wesling a contract lab with a lot of expertise in microplastic analysis and also some broker equipment so what to do to reduce contamination always use metal or glass equipment where possible so there is no intake of any kind of plastics from the equipment ptfe is also a possibility because it's almost never found in any samples and is also so unique that you will be able to identify it and in measurements with anodisc you will not see them anyway wear proper clothing in the lab so a lab coat is important wearing a hair net avoid synthetic fibers altogether to not contaminate your sample with microplastic the use of filtered water as we have mentioned before and very important is the measurement of blind samples as reference so just measure the empty filters to know what is your baseline on particles that you will get which you have to subtract later and then filter your lab water without any sample to see how much part contamination or how many particles you may add to this to get a baseline and now we come to sample preparation and how to remove contamination so for drinking water beverages beer anything like this you can directly filter it wash the filter a bit to get rid of the remains of the original liquid and then let it dry and you can measure it if you have something like river or seawater sediment something that is more complex and has a lot of well soil in it or sand you will need to do a density separation to remove all of this and just get the plastic particles a bit more on this on the next slides and these may also have a biofilm or other biological contaminants on it and then you need to do oxidative alkaline or enzymatic treatment to remove this if you have food like you would fish muscles anything like that you will also need to do a treatment to remove all the organic parts that contaminate your sample and then you can do the filtration okay a bit more on density separation so how do you do this by submersing your samples in a saturated saline solution and in this case the plastic swim sand and other contaminants sink to the bottom plastic usually has a density of 1.4 or lower and this is why you use saturated solutions of zinc chloride sodium iodide or potassium formate and again you mix your sample you stir it well and then in the end the sand will sink to the bottom the plastics will swim and you can just pour it off these salt solutions can be recycled by filtration so you're not generating a lot of waste by using this method to remove organic material there is the possible the possibility to do this with enzymatic digestion and this can be done in multiple steps or you can do it in a big bulk process and it can be combined with another treatment method there is alkaline degradation so in most cases you're using a potassium hydroxide solution of 10 percent and heat it up to maybe 60 degrees celsius but this may also deteriorate some polymers and there's oxidative treatment with hydrogen peroxide this is actually very effective but it also may deteriorate some polymers and therefore interfere with your results there are also some less common options like the breakdown the acidic breakdown with sulfuric acid and nitric acid but this is with concentrated solutions and so this is very dangerous and difficult to handle and there's also the phantom reagent which is quite effective without any side effects but the handling is also not the easiest okay when our sample is finally prepared the remaining solution has to be filtered this is mostly a two-step process so in the first step we are filtering off large particles for example everything that is above 500 micrometers and for example you can use mesh c filters in one or multiple steps depending on the sizes of particles you encounter in your sample we need to remove large particles because they absorb all the ir light and microscopy and for this we're using the alpha 2 spectrometer and here i want to talk a bit about the principles of ftr spectroscopies so you understand why we're handling things the way we are so first how does infrared light interact with matter it interacts with molecular vibration so this is vibrational spectroscopy and this is a water molecule oxygen in red and the two hydrogen atoms in white and they can stretch apart in a symmetrical fashion which is one band you will find in the fdir spectrum they can also do this in an asymmetrical fashion so this is another vibration we will see in our spectrum and there are some more but this is enough as an example and how do we measure these vibrations so we have an ir source that emits ir light and our sample that absorbs some of the light according to the different vibrations it has and then we collect the transmitted light on a detector we do this for all the wavelength at simultaneously and we need to do a foray transformation with this data to get the final spectrum which you will see here this is a polyamide example okay how do we use such a spectrum for identification an ftr spectrum is like a chemical fingerprint so it's unique for every individual compound and for every polymer type so we can compare it to a reference database and in this way we can identify them this is done in routine applications and quality control for example of incoming goods for pharmaceuticals also for polymers and when we combine the microscopy with the identification we can also identify microplastics and to identify microplastics we need a good reference database to have all the spectra available in the best quality there is and for this we have teamed up with the kunst kunshdov institute ludenslide a polymer institute based in germany and have created a very reliable database with lots of information on different aspects of the particles and where they were manufactured and they were measured on our spectrometers and re-verified by the conscious institute so the polymer institute and we keep this library always up to date that means we have an annual update with new materials that you might find that are of high relevance for the polymer industry but in conclusion also contains all the materials that you will find in products that break down to microplastics and we have an excellent material coverage with over a thousand polymer spectra and we have all the common but also very rare types of polymers like polylactic acid in there but it's always best to demonstrate this using a life example so this is again our alpha 2 compact ftir spectrometer this is one of the many exchangeable accessories in this case a high pressure atr with a rotatable clamping arm and this one here is a piece of plastic just about five millimeters in size and i will just place it on the atr crystal close the arm and you will already see a preview spectrum here so you know it's in good contact and when you tap the start sample measurement button it will automatically run the measurement you will see the progress in this bar and when the measurement is done it will automatically check in the kimw library for the best matching results and you see in red the measured spectrum in blue the result and this is clearly a polyethylene sample high density and this way you can identify all your samples that are larger in size or too large for microscopy the second step of our filtration so after we have removed all the particles that are too big to be analyzed by the microscope we filter all the small particle onto an ir transparent filter because we will not measure them in atr but we will shine light through them we will measure the particles directly on the dried filter and before you finalize this the cylinder walls should be rinsed multiple times because the particles tend to stick to them and also wash the filter thoroughly to remove any contamination or remains from the treatment of the sample the use of vacuum filtration is advised to speed up the filter process and you can obtain such a basic filter kit directly from brooker so what kind of filter do we recommend anodisc is the most used filter material at the moment this is because you can measure the sample directly on the filter and you do not need to transfer it later and maybe lose some of the particles or contaminated otherwise and you have almost no loss in ir transmission above 1250 wave numbers the spectral range is from 4000 to 1250 wave numbers so not full ir but enough to identify all the particles that you may find on your filter it's suitable for imaging and mapping and transmission what this is i will also explain a bit later and you have a pore size of 0.2 micrometers so all the particles will be captured there is no way you're missing anything the trajectory diameters of these filters are 13 or 25 millimeters the picture you see here is 25 millimeter with a support ring because these filters are quite brittle and the stability is greatly improved if they are if they have this support ring so when you put this together and the setup will look something like this you have your suction flask the carrier frit where you place the filter on a cylinder to hold it in place and also here you fill in your sample and the clamp to secure everything tightly and when you now fill in your sample you apply vacuum here that the sample is pulled through the filter to speed up the process but there are also other filters so there are silicon membranes these have also a high ir transmission without fringes a little less than anodisc we have a full range available of the mir region so 4 000 to 600 wave numbers if you're using a focal plane area detector down to 750 but again this is more than enough to identify everything you may find these filters come in different sizes and shapes and we have pore sizes down to 10 micrometers available and this is dark field compatible as well so this is a contrast enhancement technique if you're looking to manually or automatically find single particles on this this is a very good option there are ptfe filters they can be used in transmission mode as well and have the same spectral range available but they have their own absorption between 1100 and 1300 wave numbers but this does not really interfere with the identification and you have no ir loss above and below this value so these also very good transmission filters and there are also gold-coated filters these are only used in reflection mode there is nothing that limits the mir range so the full range is available you get a good visual contrast and this is also dark field compatible these are mainly used if you also want to do raman analysis on the same filter otherwise reflection mode is only the second choice after transmission because you get artifacts and also total absorption quite easily with this kind of filters then there are cellulose or glass fiber filters they can only be used with atr and atr mode can be quite time consuming because you have to constantly clean your crystal because it can cause cross-contamination if one particle sticks to the crystal and you're moving it to the next one but these filters are cheap and easy to handle and if you want to do this really depends on the number of particles you expect on your sample if it's just a few this is a good option but otherwise we would really recommend to stick to anodisc okay now we have prepared our lab with the right equipment we have treated the sample filtered off all the large particles and have our micro plastics on an appropriate filter for microscopic ftir analysis now we have to decide what kind of analysis we want to do mapping or imaging and to explain the difference imaging is a method for spatially resolving the chemical properties of a sample so in the end you know what kind of chemical is at what position and in our case what kind of particle is at what position and we create pixels and each of this pixel contains a whole ftir spectrum so if you have a single man a single element detector you're doing every pixel consecutively if you have a line array you do it line by line and a focal plane area you take the whole image at once and the highest resolution and fastest acquisition is only achievable with an fpa detector so we simultaneously acquire 1024 spectra in just single scan which is about 1.5 seconds and we have an unmatched resolving power compared to other techniques so this means the highest spatial resolution achievable so if you only have a small number of particles then mapping is the approach that is most advisable so we use some mercury cadmium telluride or short mct detector that has exactly one pixel and we detect particles in the visible image and you see every different particle has in its own color and then we measure these particles automatically one particle at a time so this is not a stitched image but individual particles are measured and then we have automated methods to create statistics for identity and size of the particle for a large number of particles or for highly contaminated filters we are using the imaging or fpa detector this has 32 by 32 pixels and in this case we measure the whole filter at once so in one session this is what you see here is an example what such a chemical image would look like if you measured the whole filter and this way you also get statistics for identity and size and the visualization of all the particles on the filter so when we use the mapping approach we have the oppos particle recognition finding all the particles based on the visual image as a first step where we can set a contrast threshold because we're binarizing the image and define a particle range or particle size range in which we are looking for them and then we will see all the individual particles that fit these criteria identified and they are measured automatically the second step is the particle identification with a program or with a functionality we call mpid which can also be combined with library search or different opers methods and this provides us with a list of particles their identity and also an overview over the found particles and statistical information okay when we now go to imaging we have a step-by-step guidance to the whole measurement of the user so it's a very easy to use technique first we collect a visual image so this looks something like this this was a very dense customer sample that was not prepared very well but we still could measure this so we used the fast imaging of the lumos 2 and automated data analysis with a software that is called purenc microplastics finder which we will see in action and also its strength in a short time and so with this combination we could even analyze filters that look like this so again the workflow we take a visual microscopic image the lumos 2 collects an ftir image of the whole filter here we see the chemical image of all the particles on the filter but how does this work exactly and how long does it take here we see a measurement with 100 times its original speed as the image grows larger you see the live integration that already gives you a glimpse into the composition the filter area is about 18 by 18 millimeters in size and is imaged one tile at a time to yield chemical information about the whole sample in order to not miss any particle that might hide in the matrix one of these tiles contains 1024 pixels where each pixel is 5 microns in size and comprises an entire ft-ir spectrum at full speed we are collecting 900 spectra per second so we are operating at the diffraction limit and are able to get all physically possible information out of the sample while offering unprecedented imaging speeds and then we use the microplastics finder that works fully automated gives us identity size statistics particle list and all the information you might need along with exportable reports so what is this purity microplastics finder actually this is a very easy to use software with a simple interface which basically only requires four buttons so you have an import button to load a file into the software a single file analysis button to just start the analysis of the file you have just loaded and the results will be prepared and presented automatically and a batch process so if you have measured a lot of different filters you can just run them all at once maybe overnight when no one is needing the computer and you have a particle editor that is used to display the results but also to double check them and look at individual particles so this is really micro plastic analysis at the click of a button very simple and easy to use this is again what the results look like you have an overview over the number of particles found for each class a particle list with all the information identity and size statistics and size distribution but we will look at this in more detail live on the software here we have the microplastics finder in action so on the top you see a list of all the available polymers that are all included with this and this is again the basis we're using to identify particles the number of the particles that have been found in each class and below this there you find the information on all the different particles are listed with the size information where they are found on the filter the identity and you also have relevance and similarity these are quality criteria so relevance is how sure the algorithm is or the classifier is that this particular particle belongs to this class and when you click on this arrow you also have this visualized so here it's absolutely certain this is polypropylene and below this list there is also the reference spectra available so you can double check yourself and second there is a similarity criteria which is a correlation coefficient so the simple spectrum correlation from the measured particle to a reference particle you can also move around on the filter and then have a look for example if we want to get more detail about this particle we can simply just mark it and then it will be highlighted in the particle list also here you see the information which other classes would have been considered and the comparison to a reference library so you always know what criteria were chosen to identify this particle and this is not a black box but it's really comprehensible what you're doing this also works the other way around so if you want to for example have a look at a certain pt particle in this sample you click on this and it will be highlighted on the image as well there are also distribution parameters so you can see the size distribution of all the particles found and you can export this simply by clicking copy to clipboard and enter this into your report the same can be done for the overall image and the particle list can be exported into csv or you can select the particles you actually want to have in your report and then you can use this again to provide to your customer or whoever is interested in the information about the sample okay so this is the basic operation and let's get back to our presentation so let me sum up all the advantages of imaging we have collected so far the pull process from measurement to evaluation is automated with the broker lumos 2 you get the ultimate imaging performance for best spectral data and with the purency microplastics finder you get an out of the box solution that is based on machine learning and therefore very robust against noisy or bad spectra and the automation is fully the evaluation sorry is fully automated and done in only 15 minutes and the presentation of the results is quite comprehensible and you can always trace what the software has actually done and this makes it the ideal solution for routine analysis of samples but i've also wanted to show you some samples so this is a sediment we got from a customer and here you can see the results in the microplastics finder so we see a lot of pe particles pvc you see the distributions on the filter and well again with this sample we mainly found pa particles pvc pe and pp and another example is sea salt so this was just dissolved in water filtered and then thoroughly washed to get rid of all the salt that may have been stuck to the filter and again this is what the result looked like we actually found a lot of pa and pe particles in the sample as you can see from the blue color that belongs to the class of pa and the purple non a purple pink that belongs to the pe class so this was actually heavily contaminated and here is an example from a milk milk from a milk container that was filtered through a silicon filter in this case and we see a lot of polyethylene particles which makes me wonder if this packaging actually was ok this concludes my presentation and want to thank you all very much for attending today and if you have any questions please feel free to ask them during the q a session or get in contact with us later if you want to instrument demonstration or have any other questions regarding microplastic analysis or the instrument itself so thank you again and see you in a minute
Up Next

112:11
Food Sovereignty vs. Food Security: Expert Panel Discussion
@UChicagoCISSR
4.9K views•2012-06-05

15:54
Life in Biosphere 2: Sustainable Ecosystems & Human Survival
@TED
334.9K views•2009-06-16
14:30
Microplastics Everywhere: How Plastic Impacts Our Lives
@TEDx
100.9K views•2018-05-08
10:28
Ice Stupa Artificial Glaciers: Solving Ladakh's Water Crisis
@SonamWangchuk66
3.2M views•2015-05-03
Related Study Plans & Knowledge Roadmaps
Structured learning paths in Environmental Science
environmental-science
Ocean Noise: Cetacean Impacts & Mitigation
01Fundamentals of Underwater Acoustics
02Marine Mammal Bioacoustics
03Anthropogenic Noise: Shipping & Seismic Surveying
+ 2 more learning modules
16h5 modules
Explore Roadmap
environmental-science
Road Ecology: Corridors, Overpasses & Fencing
01Foundations of Habitat Fragmentation and Carnivore Ecology
02The Road Barrier: Ecological Impacts of Transport Infrastructure
03Principles of Ecological Corridors and Connectivity Mapping
+ 3 more learning modules
14h6 modules
Explore Roadmap
environmental-science
Ocean Acidification: Kelp Buffering & Shellfish
01Fundamentals of Ocean Chemistry & pH
02Chemical Pathways of Coastal Acidification
03Bivalve Physiology & Calcification Under Stress
+ 2 more learning modules
18h5 modules
Explore Roadmap
environmental-science
Ice Stupas: Glacial Retreat & Water Security
01Foundations of Glaciology & Mountain Hydrology
02Climate Change and Glacial Retreat Dynamics
03The Science of Ice Stupas & Artificial Glaciers
+ 2 more learning modules
14h5 modules
Explore Roadmap