


















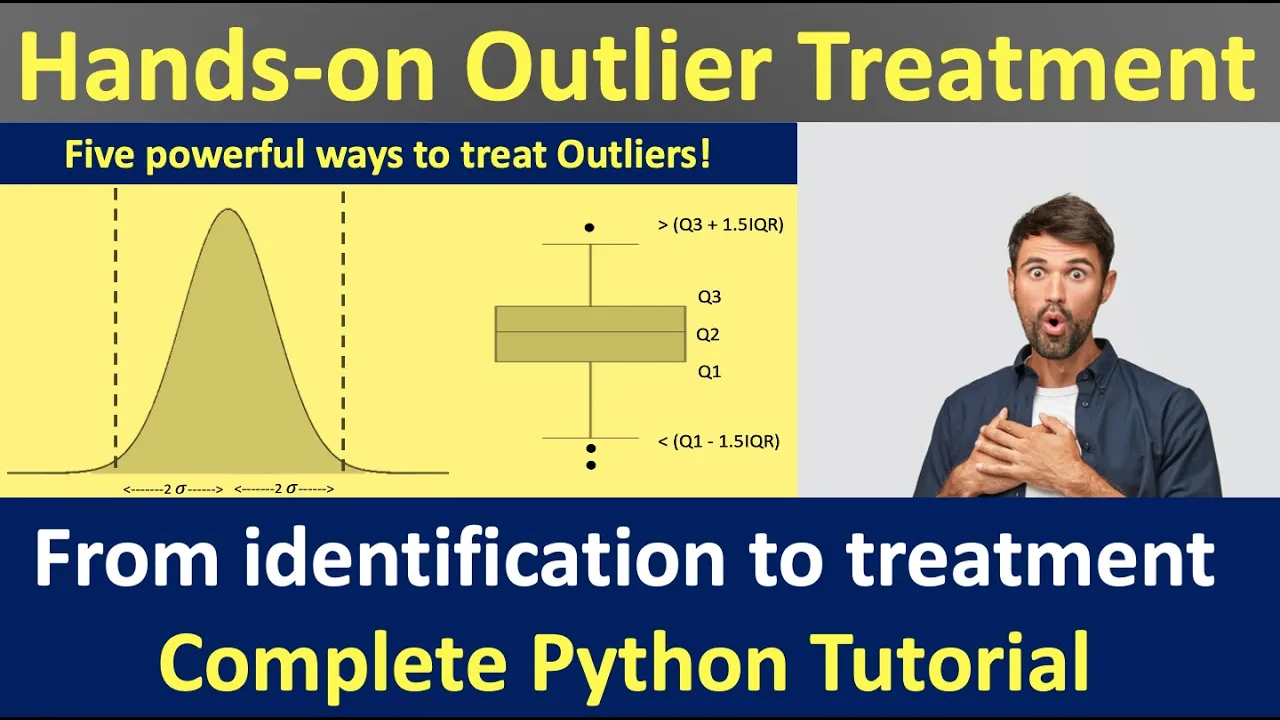





Outliers are observations that differ significantly from the majority of data, and they can severely impact machine learning models, particularly linear regression, by distorting coefficient estimates and reducing model performance. Outliers in training data can cause models to learn incorrect relationships, while outliers in deployment data can lead to unreliable predictions. Robust methods like HuberRegressor and random forests are more resistant to outliers compared to standard linear regression. The key distinction is between outliers in features (X) versus targets (Y), and between outliers in training versus deployment data, as each requires different handling strategies.
How Outliers Impact Machine Learning Models | CPSC 330
Added:Fundamental concepts of supervised learning, specifically the distinction between regression and classification tasks.
The mechanics of Linear Regression, including how ordinary least squares (OLS) and Mean Squared Error (MSE) loss functions work.
Basic statistics, particularly data distributions, variance, and how outliers are defined in a dataset.
An understanding of standard loss functions (like MSE vs. MAE) and how they mathematically penalize prediction errors.
Alternative robust estimation algorithms, such as RANSAC (Random Sample Consensus) and the Theil-Sen estimator.
Unsupervised outlier and anomaly detection techniques, including Isolation Forests and Local Outlier Factor (LOF).
Data preprocessing and feature engineering strategies for handling outliers, such as winsorization, clipping, and robust scaling.
The computational trade-offs and optimization challenges of using non-quadratic loss functions in large-scale machine learning.
461 views6likes1:06:27Original Release: 2020-11-30
let's talk about outliers so what is an outlier an outlier is a example or an observation that is very different from others and sometimes they're called anomalies um yeah i'm actually not gonna go look at these cpsc340 slides right now but um you're welcome to look at them and um the point of them is it's kind of hard to outlier is a very not clearly defined what does very different mean if you have a house that has 100 bedrooms is that an outlier yeah probably um if you have a person who's whose income is a billion dollars a year is that an outlier yeah probably and so when you just look at one feature you might really see outliers but sometimes more complicated and you need to look at multiple features like you might have a house that has six bedrooms and one bathroom and having six bedrooms isn't that crazy i mean it's pretty unusual having one bathroom isn't that crazy but the combination of them is very bizarre uh because how are all those people gonna do their business um in a timely manner it would be relatively unusual in a data set of houses and so sometimes you can't just look one feature at a time and and the outliers actually depend on all the features and so it's very nebulous uh field but it is important because if you have outliers that are in there because of data quality issues like uh that they can potentially really mess up the work we do here and so i'll be showing you that later today um why do so why do we care about others yeah one of them is as i just said there they shouldn't be there someone typed something in wrong into the data set and now it's just going to mess everything up another thing reason is actually not because we want to find the outliers to throw them away but because the entire task we're doing is just to find the outliers for example credit card fraud detections we actually had a credit card fraud detection data set earlier on in the course if you recall that was when we were talking about precision and recall and all that stuff and we wanted to get high recall on the frauds but that was a supervised outlier detection in the sense that we basically we had the label in our training set was this a fraud or not so put another way was this the type of anomaly that we're looking for or not and so in that case you could kind of just treat it as a regular supervised learning problem because you have the labels and you might not need to put on your outlier detection lens as much but what we're going to talk about today is that no one's given me a label data set saying this is an outlier this is an outlier this is not and so we just have to figure it out on our own um and so we'll talk a little bit about how to figure it out on our own and a little bit about how to defend against outliers and a little bit about the implications about wires so how can we find outliers yeah we'll just we can look at a bunch of plots we'll look at a scikit-line function that tries to find outliers for us um and we'll look at some ways of leaving outliers in and not worrying so much about it okay yeah we'll just this will make more sense later um questions about this overview is there any metric to ensure us whether the values in outlier yeah that's the thing i mean there's the problem is is that there are many many definitions of an outlier and so some talk about some of those in 340 and you can look at those slides but i think the problem is it's it's domain specific you can try to come up with general ideas but um it is hard to do that entirely and and there's many ways you could define an outlier so yes there are ways but overall it's it's a very nebulous endeavor okay so what we're going to do next is what i'm calling the outlier scavenger hunt and so what i'm going to do is just pull up some data sets we've looked at earlier in the course and just see if we find outliers um so if you recall the census data set this is now a while ago uh lecture six and seven we were trying to predict the target variable was the higher income level or the lower income level and we had all these pieces of information that people filled out on the census so um we had 26 000 census people in our training set and we mentioned back earlier in the course this uh pandas profiler thing and that's kind of a nice way to um at a glance like see what's going on in your data set because for example it gives you all these histograms for all these variables age work class um education marital status so at the very least you can look at um features one at a time and so here for example with capital gain the fact that it's showing me what is that one hundred thousand there's a very faint blue bar here it looks like there's someone whose capital gains was way bigger than everyone else's and so that person might be an outlier um likewise with capital loss and so this is kind of nice although it's only looking at features one at a time panda's profiling actually has a way to look at features more than one at a time did i scrolling so bad i think school i did minimal equal true um let me run this while i answer your question and i know it takes longer when i don't oh that didn't take longer weird anyways i thought it was showing me she would show me some other things but it isn't so let's just move on next question in the chat would a lack of training data for a specific feature uh be a reason to consider points as outliers um okay so for the most part i'm only going to talk about numeric variables as outliers you could have a category like what the thing was in the midterm is it was a categorical or an ordered integer feature an ordered discrete feature and you had very little of one category um but i mean you could in that case because it was ordered i guess but it's it's yes i mean having us having something be rare is part of the definition for for it being an outlier like the fact that it's huge isn't enough because maybe all of them are huge and one of them is really small and therefore it's an outlier so yes rareness or unusualness is a measure for outliers and you you could have a categorical variable with very few people in a particular category but you wouldn't often refer to that as an outlier it's usually about numeric variables and thinking about the magnitude and i think i can explain why more clearly later today with some of the stuff we're going to talk about okay um where's my yeah so here's this capital gain thing again i'm making a histogram of that and so we can again see that most of the people have capital gain close to zero but some people have this very big capital gain and so here's all the ones that are strictly greater than zero and we can see there's still a bunch that are small and this um few number of people who have this much bigger capital gain so maybe those people could be outliers the question to ask yourself here and i this is kind of similar to the class weight discussion we had do i care about precision do i care about f1 score should i change my threshold it's a very domain specific question that you need to ask yourself okay i have this this is weird but is it actually a problem because if everything's fine it's not a data quality issue then we might not really want to do anything about this because that's what the data it says and we're just going to leave it alone but if you suspect that there's something fishy about this you might want to consider removing it and we'll keep talking about that as we go through the day okay so uh isolation for us so um i'm not super familiar with these but i heard about them and so i went and looked them up um and they're implemented in psychic learn and so they're basically like an outlier detection method built into psychic learn so someone asked earlier like is there a way to find outliers so there's not the only way but this is a way um it's it's a second learn thing and it's kind of like decision tree or random forest but it makes random splits and then if something gets if a train example gets by itself quickly then it's considered weird because if you have a whole cluster of points that are very similar you're going to have to keep splitting and splitting to get each one by itself but if you have something by itself you just make a few big cuts and you'll you'll isolate it so that's why they're called isolation forests um so i'm going to take the housing data and and this is now a second line function so i have to do the pre-processing again in order to actually pass it in oh sorry not the housing data this is the census data so here's the syntax i make an isolation forest you can call dot fit you can call that predict that there's a fit underscore predict just like fit underscore transform does fit and transform together fit underscore predict is shorthand for doing fit and predict together and um well first let me show you what it outputs um i see the fitting is taking a bit of time so it outputs uh zeros plus ones and minus ones so it outputs plus one for an in layer meaning not an outlier and minus one for an outlier and so if i do this um if i get all the cases where it's negative that's going to grab the outliers for me and what it does is it grabs um 193 cases that it decided were outliers so according to the secular and isolation force the details of which we're not going into here out of the 20 000 people it considered 193 of them to be somehow strange so that's pretty useful um that's funny um when i ran it myself i got 61 and it's almost certainly because of [Music] the random state thing now i got 100 and hopefully when i run it again i'll get a 100 again great okay i'm also 100 it's going to be a number i don't want to confuse people and have them think it's exactly 100.
bam okay um i see a question in the chat yeah so i'll why does random state make a difference like i mean like random forests isolation forests have some randomness in them and so um it had said in the text that it found 60 something outliers but it said in the code it found 100 something outliers i just wanted to fix the random state so every time you run the code it gets the exact same answer so that i could put put it into the text and have the text match what the code was outputting that's all and it's just nice when you're following along if you're running the code you get the same results as i get so it's kind of nice especially for teaching um to get to the earlier question so there's let me click on this documentation um there's a pic yes there's this picture in the secular documentation there's only two features here so it's not really that realistic of a scenario but basically you can imagine that if you're just randomly splitting here like a decision [Music] so if you're just randomly splitting um all over the place then what's going to happen here um is that here with this many random splits that i did this point here is already by itself in a region and this point is by itself and this point is by itself and this points by itself this points by itself um and and so if you just randomly split things the things that get to be by themselves in a region faster are more like are more weird because there's nothing near them whereas all of this stuff over here it's going to take a lot a lot a lot of splits to get any of those points to be all by themselves because they're so close to each other and so the longer it takes for a point to be by itself the more outliery it's considered great okay um [Music] let me go back here oh that is not good how do we distinguish between another outlier and a cluster um what do you mean by that could you elaborate on the question like if there are three points close to each other are they a cluster or just outliers yeah so that is indeed and in those 340 slides i linked to it talked about that as well like that is general genuinely an ambiguity in the definition of what do you call an outlier does it have to be literally by itself if there's just two points right next to each other then you call the those are probably still outliers too so yeah it's it's um it is a it is a tricky business to say what an outlier is and i think what this might be doing oh gosh i think what this might be doing is it might be doing like multiple rounds of these or something um we have so many features and since this is a way of finding out why the isolation force thinks these are outliers um i don't actually know so we're getting to the limits of my knowledge about these isolation forests um but hey what would i do if i really wanted to know this i can demonstrate it for you i would go and look at what the attributes are okay it has a bunch of estimators which are these random tree thingies [Music] that's very interesting um okay i'll have to look into this more but uh this this causes me to raise my eyebrows i wonder if it's subsampling the data and maybe that would take those two points next to each other into account because in one random sample of the data only one of them is there and so then it still gets considered an outlier but i have to look into this more anyways go back to the question of which features um [Music] the subset of drone features yeah uh my guess is just looking at this documentation that it probably doesn't have an easy way to tell you which features are important because it tells you something about features but i think those are just randomly picked so i don't think there's anything to it really that's that's my guess if i would wanted to know that this is where i would have gone to look first and this would have been my first impression without uh further investigation okay and then one more question like if we look at zero two there are five points close to each other uh zero two yeah these points close to each other yeah so it it is a genuine ambiguity in what is considered an outlier that's the thing like are a bunch are these things outliers or not um i mean there's no single definition so that's why i was saying earlier this is very up to like human interpretation and the people who made isolation forest and made the default hyper parameters of it had particular thoughts on that but it might depend on what you consider an outlier for the work you're trying to do okay let's keep going um yeah so what i really want to do is here okay yeah we can look at the capital gain for these cases that's right so if i look at the capital gain for these predicted outliers you can see it it did seem to find the things with crazy high capital gain as outliers andy's pretty high capital gain but it also found um it also found a bunch of people with zero capital gains so clearly it picked some people as outliers for reasons other than they had a massive capital gain because a bunch of these people had a zero capital gain which is very normal but maybe something else about them was unusual i was thinking outlier could be found when we have euclidean distance between the mean value and the large just yeah yeah okay i won't directly address that right now i want to keep going to other data sets so um here's the movie review data set if you remember that from uh lectures four and five so here are these movie reviews i mean it's hard to say what an outlier is for text so the one thing i thought about is well we could at least look at the length of the reviews if we wanted to have some fun with this and it seems like there's some pretty long review in here so there's a 14 000 character movie review and i mean i just thought it'd be fun to print this out not really here it is so uh i guess that would be your outlier when it came to movie reviews it's it's i can't even process this okay anyway that was that was more just for fun uh it's it's a bit hard to say what outlier is in terms of text um the amazon product creating status that was the more recent one that we looked at it's pretty hard to talk about outliers here because the ratings are just from one to five so um you don't really have outliers in the rating you could have outlier products and we did talk about that in lecture 14 like this item has way more reviews than anything else or something like that um yeah the housing data so you probably remember this housing data from lectures 10 and 11.
and so again you can do the the pandas profile thing you could also do the isolation forest thing which i didn't do but i think it'd be kind of fun um yeah so again you can look through and see if there's so this looks pretty again just looking at one feature doesn't tell the whole story but this makes me think okay there's some big lot areas if the scale is going all the way to 200 000 i'm presuming it's square feet um so yeah a lot area might be something to look at um i don't really want to deal with that but i would like to i just think it would be fun so i'll do that later uh be fun to see what it checks okay so a lot area looked like it was kind of interesting so we can look at a lot area a bit more and we can maybe crank up the number of bins a little bit so yeah we see some very big um properties here um and so those are potentially an anomalous or outliers um we can also do a scatter plot of the lot area versus the sale price in the training data and we can see those as well so here's where it gets interesting so there's kind of this trend of like bigger lot area gives you bigger price but it's not i mean it's not like a perfect trend but um these ones are you're not really get you're getting diminishing returns for having a ginormous property um and and so if you're doing something like linear regression and you're only looking at lot area this this would be problematic because these outliers would kind of potentially obscure the main trend here maybe the main trend is that um there's kind of this steep increase of sale price versus lot area but the because of the outliers your your linear regression might do something like this because it's trying to do a good job of of these cases and getting getting messed up questions okay okay yeah are these outliers a problem so uh in reality we don't have 200 000 because we're scaling things and so we actually have scaled area which looks more like this and remember the interpretation of standard scalar is that it's in terms of standard deviations from the mean so what this is saying here is that the this lot is 20 standard deviations above the mean and this is about 16 standard deviations of other means so uh yeah i mean at least it's not like a million but these are very very very big values compared to everything else we have which is in like a couple standard deviations above the mean so that could certainly affect our model um [Music] this is just a histogram looking at uh scale values less than five and so that's like this left chunk of the histogram um so yeah what's happening here is that most of the points the houses are between are within one standard deviation of the mean lot area but then we have these these outliers for that area um okay so what i'm looking inside of the standard scalar object and it's saying that the average lot area is 10 000 and the standard deviation of the lot area is also around ten thousand um but what we could do is we could subset it to just remove those giant lot areas so we could say um let's only let's throw away the lot areas above 100 000 square feet because that's just a very strange house that may mess things up and then let's see what the mean and standard deviation are of the lot area and what you can see is that the standard deviation is actually a lot smaller so what's interesting is those couple of outliers are making the standard deviation of lot area really big which is causing standard scalar to divide by a bigger number and that's why everything's kind of squished here between minus one and one whereas normally when you look at standard scalar it would probably be more like between minus three and three for the bulk of the data or minus two and two um but the outliers changed our pre-processing and probably not in a devastating way here but it's something good to know so let me actually [Music] um okay um oops okay so let's also talk about mid max scaler if you we hardly touched midmax scalar in this course but if you remember way way back when we talked about uh standard scalar that was standardization there's also normalization which squished things to be in between zero and one and so what we can do here is we can transform the lot area with the min max scalar and what we see is a min max scaler puts things in between zero and one um and normally you could kind of expect values all over the place but because there's a slot area of size 200 000 and mid max scaler has to put the smallest thing as zero and the biggest thing is one the two hundred thousand became the one and since it scales proportionally all the rest of the data is kind of squished in between zero and point one and so if your point of doing min max scalar was to have all your features kind of smeared between zero and one now this feature with the outlier is actually mostly living between zero and point one and that could affect um the model and kind of bias how important it thinks the future is it could make it think the feature is less important because it's not varying that much most of the time between 0 and 0.1 but it's just because of this outlier and so um yeah what this is saying well yeah it's saying 95 of the lot areas are less than 0.7 after scaling um and that and that could kind of mess up your modeling a little bit outliers are more important than linear regression than in random forest regression um excellent question okay i think it is fair to say yes to that question um but furthermore outliers and the feature values in x are kind of a different story from outliers in the target value in y and we're going to talk about that distinction in a second but actually i think either way linear regression gets hit harder than random forest random force will not care too much about this um [Music] i have a demonstration later on in the lecture where i actually put in an outlier and then compare linear regression to random force and they do both get affected so maybe i'll say generally yes for now and i'll show you some more detail in a minute okay um yeah so there's the second learn page that talks about different scalars on data and their effect on outliers so this is a really good read maybe i should add this to the course web page but they yeah they compare anyways we don't need to go into that right now um but but a couple things they talk about in there is this robust scalar um which tries to ignore um outliers so basically it's it's taking the giant value of 200 000 square feet and leaving it as a giant value of 50 so that the bulk of the data is between like minus 3 and 3 like you would normally get with standard scalar instead of everything being compressed by the presence of that outlier there's also quantile transformer which is like a very extreme transformer what that does is instead of scaling and looking at the values it actually just looks at the order of your number so it says okay the smallest lot area is going to be called zero the next smallest is going to be called point zero one the next smallest is going to be called point zero two and that way you get this like uniform distribution f so after you apply the quantile transformer it looks very uniform between zero and one but that means you've completely thrown away the magnitude of the lot area and you're just talking about basically the ranking of the lot area um the question is why would you ever do that i mean um it is in a sense like the most robust thing ever um because if you have what if you have a trillion square feet or whatever it's not going to care uh it's just going to keep everything like this so i don't yeah oh i have that right here so i make one of the lot areas some absurd value and then you see that the quantile transformer doesn't care so um i think it is probably less commonly used than all these other scalars and i don't have like a slam dunk use case to tell you right now um except that it will completely ignore the size of the values which might be a good thing especially if you have big outliers what does number on the y-axis represent um these are counts because this is a histogram so it's saying i have 15 of them at value zero seven of them at value point one etcetera so where is it yeah this is i'm histogramming okay let's break and resume at 11 45.
i didn't quite pause for questions before the break are there any questions about this stuff before we proceed can you explain the x-axis again sure so what i'm doing is i'm i'm transforming the lot area feature so we had like standard scalar min max scalar all these things that would transform our features into like uh kind of small numbers close to zero that kind of thing and then what i'm doing here is i'm making a histogram to just see what types of different values we have so i mean the values themselves are just a whole bunch of numbers it's hard to look at so i'm making a histogram of them just so we can see okay most of them are around zero so the x-axis is the transformed value of the lot area feature and the y-axis is is the frequency of values within the bin so we have a small number around 50 uh we have lots around zero does that that answer it and quantile transformer well so it's it the plot is of the same thing it is still the histogram of the transform thing so the x-axis is still the transformed value so if i show you the values you'll see they're all between 0 and 1.
and when i make a histogram of it not only are they all between zero and one but there's kind of equally many between zero and point one is between point one and point two as between point two and point three um because that's how quantile transformer works it kind of just takes them in order and then puts them in ordered values between zero and one all good okay anyone else okay oh oh i did do that okay um mean versus media so the biggest values don't get thrown out um they get mapped to one but the value of the biggest values gets thrown out like if the biggest value is eight times bigger than the second biggest value that information gets lost because if the biggest value was 25 times bigger than the second biggest it would have looked the same after transformation and so some information does get thrown out put another way with standard scalar you can invert to what standard scalar does it shifts and then scales you can unscale by the standard deviation and shift it back and you'll get the original data with quantile transformer um it it it does kind of throw away some information in a way um that i mean intuitively it that that standard scalar doesn't because um you can take that biggest value and change it to whatever you want and as long as it's the biggest value it'll be transformed to one okay means versus meaning so some of you may have seen this before this idea that the median is a more robust statistic than the mean but i want to briefly mention it um for those who haven't seen this before um so here's a list of numbers one two three four five six seven eight nine nine nine nine nine and we can look at some summary statistics so the average of this is ten thousand uh the median of this is five oh whoops okay i was gonna change it to 9999 later but um i had left yeah okay start again one two three four five six seven eight nine so the mean is five then the median is five the standard deviation is uh 2.5 i can also look at percentiles i guess it's not necessarily the case that everyone in this course is familiar with percentile so what percentile 75 does it says give me the number such that 75 of the values are less than this so it's basically says put them in order and then get me the thing three quarters of the way down the list and this says put them in order and give me the thing 25 of the way down the list and the median is actually also known as the 50th percentile because the median is put them in order and give me the thing 50 of the way down the list so this is just another statistic that people will often look at so yes the point is what happens if i already kind of did the punch line but what happens if i change this value to make it an outlier so you have this big value in your data and what happens is that some of the statistics are massively affected and some of them are not affected so the mean gets pulled way up because it's simply adding up all these numbers and dividing by nine and so if one of the numbers is huge the sum of the numbers is huge and so the mean is huge but the median does not care about this the median is saying put them in order and give me the middle the middle is 5 either way likewise the standard deviation is the statistics that depends on the mean and depends on the variance both of which are going to be affected by this big value so the standard deviation went way up from 2.5 to 31 000 but this inter quantile range as it's called stayed the same and so what i would say is that i would say the median is a statistic that is robust to outliers if you add a big value doesn't really change it is a measure of of of kind of the where things are at that is robust as opposed to the mean and this inter quantile range is a measure of spread of how far apart things are but it also ignores outliers whereas standard deviation is also a measure of spread but it is deeply affected by outliers and so what does this all have to do with applied machine learning and and what we've been doing well the standard scalar for example computes the mean and divides by divides by standard deviation um and so it's really affected by that i don't remember exactly what the robust scalar does in secular and i can check but if it did something like shift by the median and divide by this inter quantile range that would be a case where um it would be robust to outliers i don't know if that's exactly what it does but the way you pre-process things you might use some of these robust statistics and it might make outliers affect you less furthermore [Music] um okay so we talked about quantile regression in the second lecture on regression when we used quantile regression to get prediction intervals on our uh so we used the light gbm i believe and we said give me the 25th percent quantile in the 75th percent quantile and we use that as a range of my predictions i think my predictions from 100 000 to 150 000. um quantile regression is another way to let me write this all down it's getting too messy um uh so i mentioned earlier that actually this one okay i just mentioned earlier that thinking about outliers and the features and thinking about outliers and the targets we kind of want to separate that in our brains and um this was a good opportunity to separate that so we care about this mean median stuff in terms of pre-processing um and so outliers in x will come into play there but we actually also care about this mean median stuff in terms of our regression now with classification you don't really have y being a numeric value i mean if y is broad if y is fraud or not fraud it's hard to have an outlier there but for regression specifically not classification there's this extra type of outlier we need to think about which is outlier and why and for that we have our own whole set of things which i'm going to talk about in a minute questions okay so i'm going to load up this housing data again um and again i'm just displaying bad habits and copying and pasting a bunch of code um okay so here's what i'm gonna do i'm gonna take the encoded training set which is this thing with with standard scalar and one hot encoding all that stuff and i'm going to do linear regression and i'm going to look at the coefficient for lot area and i see that it's a 3000 and we talked before about the scaling and how to interpret this with the units and all that kind of stuff and the largest lot area as we talked about before is about 20 standard deviations above the mean and that happens to be training example number 163 so how does our model predict on that property number 163 with the huge lot area well um in this case it actually does okay so the true value was 375 000 and i predicted 318 000. so so far um it's not doing anything devastatingly bad at least um on our lot with the big lot area although i guess this is i don't know as 20 error not amazing but it's okay um now i want to talk about splitting things up further so there's two types of outliers you might encounter there's an outlier in your training data so you may have a giant value of a lot area or a giant value of a house price and that's going to affect the trained model in fit and if the outlier was a mistake that's going to mess up your model the other type of outlier for you to be on guard for is outlier and test data or deployment data i think i would really rather say deployment here um so here's the thing you may have your data set may be messed up and that may mess up your model and you absolutely need to care about that but even if your training set is perfect you may want to ask yourself what if during deployment i get a feature value that's super out there what if i need to deploy on a lot area of 50 acres in an urban environment what's going to happen there and so that's just like another thing to be going on on in the backs of our minds um and in that case that there couldn't be an outlier in the y because we don't have the y values in deployment but it's more about an outlier in the x and something else to keep an eye out for okay but we're going to talk mostly about this i don't know why to be honest a little bit randomly placed here but i can't remember why i put it there uh okay so let's make a bigger outlier in lot area this time so our real outlier in the real data set was 20 standard deviations above the mean let's make x chain corrupted where we ourselves make a copy of the training data and then change the lot area to ten for the zeroth example to 10 000 standard deviations above the mean so it's like the whole the size of the whole vancouver or something is this lot area um and what i'm going to do now is i'm going to fit a linear regression on this corrupted version of the data set and we're going to look at the coefficients so these were the coefficients we had before we had a coefficient of 3 000 for law area and what we have now is a coefficient of 2 for lot area so here's what's happening here and notice all the other coefficients change too which is normal um so here's the explanation for this remember how linear regression makes predictions and multiplies the coefficient by the future value if you had a reasonable size coefficient here like 3 000 and then you multiply that by 10 000 standard deviations above the mean it would get you such a big value your prediction would be like a trillion dollars and that would give you such a big error it does not want to do that so it prefers to basically ignore the lot area feature not completely ignore coefficient of zero means completely ignore like it's multiplying the value by zero but to downplay this feature a lot and make it very unimportant give it a small coefficient just because of that one outlier and so you can see having outliers does really affect the trained model just having that one mistake in lot area of having such a big lot basically forced our linear regression to almost ignore lot area and it's not going to be as good of a model anymore because lot area is actually presumably useful for making predictions but it has to it has to do a small coefficient just to accommodate that one training example questions about this so that my take home message here is if this happened by accident in your data set it will actually mess up your model any questions and you know what would have been really great here that might be too late it's too late i would have loved to give you the test error on both um okay even though i'm sorry if i'm doing the driver i'm crazy about this but um i would really love to compute the old test error is 86.
um and as ah i see the test error only went down a little bit um that is interesting so what happened here was um i guess having the lot air the lot area be taken into account was nice but if you kind of more or less ignored it it didn't kill your model that bad pr probably slash probably because there's some other features in here that are correlated with lot area and if you have to disregard light area you can kind of use another feature to give you that same information that would be my hypothesis here um but let me add another two don't call both of them lr so that you can actually compare their test errors next to each i just shouldn't have named them both the exact same variable name because that messed everything up okay um question what should we do if we have outliers in the training set but we know that these exist in deployment slash the real world yeah um i guess one question answer to that would be like go with a simpler model so for example for alpha ridge the complexity hyperparameter is alpha and the bigger you make alpha the smaller it'll make coefficients and so if you're worried that you might get some erratic values in the features in deployment you could crank up alpha which will lower your scores a little bit but it will also lower your coefficients a little bit which will mean that it'll be making less extreme predictions and not take a particular feature into account too much and for any type of model you're using i guess my kind of gut feeling is if you make it a bit simpler and over fit less even if that gives you a worse cross validation score i would feel a bit safer with how that model was going to treat weird deployment data the other thing you could do is you could have in your deployment pipeline some sort of outlier detection and try to say hey this looks a little messed up maybe i'm going to treat this as a missing value and just impute it because i i can't be that i have a lot area of 10 million and then you could actually add that into your pipeline of deployment okay let's keep going um what happens if we make a bigger outlier in the targets okay right so this is again i want to hammer home outliers and x and your features versus outliers and y and your targets are not exactly the same and it's not a coincidence i'm using the housing data set i needed a regression problem here so i could make an outlier and the targets which wouldn't really work in classification so what i'm doing here is i'm making a y train corrupted where the first house is now worth a billion dollars instead of what it used to be hey that's not nice okay so it was actually 157 000 but i'm corrupting it and saying it's worth a billion dollars so you can see what happens to my ridge model um and so what happens is it got kind of severely compromised so it learned these massive coefficients in all the different features it was trying to like twist itself in a weird way to somehow predict a huge value for this just this one training example and predict normal values for all the other houses and so it gave itself these massive coefficients for all the features such that they all lined up perfectly with their positives and negatives just for training example number one to give you a big prediction and it's basically garbage right so this just single training example out of a thousand um totally tanked our linear regression and when we make predictions they don't even make any sense it's saying this house is worth negative 150 000 when it was actually worth 300 000.
everything just got totally messed up so in this case i am confident in saying unlike last time i'm very confident saying the test score is going to be horrible here um oh because we just have um yeah okay this we have an r squared score of negative seven thousand it's just complete garbage so that single mistake in our why setting that one house to a billion dollars completely tanked our linear regression and so it makes crazy predictions on um on all the training examples yeah i don't even really need to say that so here's the real house prices the y train histogram and here's the the predictions so it's just it's just garbage it's predicting this is a 10 to the 7 here so uh what is that so it's going like negative 10 million dollars to positive 60 million dollars and the predictions it's all just trying to accommodate uh that one corrupted example and we go into much much more detail on that in uh 340.
um interesting question in the chat can we normalize the target value so that's actually the exact next thing i was talking about so if we happen to have log transformed our targets we will be a little safer um just because a billion dollars is not as extreme and crazy in log space it's just 9 like or 10 to the 9. um so yeah when you do things in log space you can actually survive that a little better um and get reasonable predictions and your test score will not be as horrible um so that's good so yeah log transforming helps with that a little bit um and it's basically the interpretation of log transforming if you remember is like one extra bedroom gives you like a 10 extra boost and so you can get up to that billion dollars by just like doubling the price a bunch of times and so yeah it does help okay so now as promised earlier we'll talk about random forests as well so how does a random forest deal with why train corrupted where the first house is worth a billion dollars um so in this case whoa my gosh did not mean to press whatever hotkey that was um yeah so on some i i don't remember what end is so i don't feel like using it anymore um it it's getting some reasonable predictions here so the thing about random force is the following think about decision trees from a long time ago it's like partitioning and partitioning if this if that if this if that and then at the bottom it's like okay i have this left and so i'm going to predict if if you meet all those criteria all the way down the tree here's what my prediction is going to be because we only corrupted one house house the first house and set it to a billion dollars only that path down the tree is going to have a ridiculous prediction at the bottom and so when you're done and when you use this on test and deployment data it's only going to give you the silly values if you follow the same path down the tree as the as the crazy one and so for other houses like this one i picked house number 800 it's still giving you normal predictions it doesn't care about that one billion because that's like a different path down the tree now random forests are actually a bunch of decision trees but that intuition more or less holds so if i go back to predict on the messed up point itself which is house number zero then i get a big prediction of 650 million which is kind of close to the billion so if i have another house that was similar to the one that got messed up i will also get crazy predictions um and so here i have a histogram of all the predictions again and uh basically most of them are like fine and that like a couple of them are super massive um i don't i don't actually love these histograms that much i don't know about you this is pretty misleading okay let me let me here's what i want to do instead i don't like these that much that's really what i wanted to show you it's only predicting above a million dollars for four houses and for the other 1000 houses is predicting less than a million dollars so basically there seems to be four houses that are similar enough to the crazy one that they went into crazy land as well um because i don't think any of the houses were actually worth um a million dollars yeah so there was no house worth over a million dollars in the training set but only so only four of them went into crazy land here um and yet it said ten and again i believe it's because of the random state i'm sorry about that now you cannot get the same results when you run the code again oh now only one of them went to crazy lines well that's not really the message i want to be sending to the future of applied machine learners oh come on okay last time don't mess with me please thank you okay sorry about that uh okay i just changing the random state okay yeah so about in this case with this random state five of the predictions going to into crazy land um and if i go back to the original uh uncorrupted um case then i i don't get any predictions in crazy land none of them are bigger than a million so to answer the person's question from an hour ago random forests are safer here because linear regression is like a global fit it's like a single line not a line a single regression surface that is supposed to do well on all the points and it is up it is trying to optimize for something that involves all the points and if you mess up one point um it messes everything up it tries to like change all the coefficients to accommodate the one cr point in crazy land and everything gets messed up random force it's kind of like those bulk heads on the boat that like prevent the water from spilling it's it's more compartmentalized the things that go down the tree together with the with the weird training example those ones are going to be weird but the rest of the paths down the tree are completely unaffected because it's not this global fit it's like each thing is done separately as it takes its path down the tree questions this is i like this stuff i don't know about anyone else but i think this is fun okay the last thing i want to talk about is um robust linear regression so yeah linear regression seems to be uh easily derailed by even a single training example with a completely messed up target value and there are ways around this so for example in scikit-learn there's something called huber regressor which you can think about if you would like as basically ridge but not getting messed up by outliers and in fact when you're done calling fit it even tells you hey i think these ones were the outliers and i kind of didn't let them influence me too much so that's actually pretty awesome and i've been debating myself like in this course i tell you never use linear regression i always use ridge and i ask myself should i tell you never even use ridge also use huber regressor and yes i don't want to be too opinionated and non-standard so um i'm not gonna go that far but um i think it it's fine if you want to just always use huber regressor you'll probably be fine it's just a bit less standard than ridge and so i guess my what i'm telling you in the course is use ridge as your default for linear regression but have outliers always on your mind and always be looking for them and keep in mind this huber regressor tool if you need it that's basically like ridge but robust outers but just has some extra messes that makes me hesitate to tell you always use this random idea can we add a linear model at the end of the compartment set up by the random forest yes you can and i really wish that was implemented in cyclone it's a very good idea that i believe works well in practice a lot and i know a lot of people have had success with it and i wish it was insecure and i wouldn't even be surprised if there's an issue or a pull request since i could learn where people are trying to get this in but um it's not in there yet but yes it's definitely a good idea and if they put it in there then i would teach it in this course for sure but as it stands random forest regressor doesn't have a linear regression at the leaves it it just predicts a constant function at the leaves how our future importance is in huber so um huber has the co-f just like ridge has co-f so it's all exactly the same uh yeah this is this is a typo in their documentation it should say coefficients co-f is exactly the same so you have that all carrying over to huber regressor so what i want to show you is i'm just going to run the code i'm going to fit on y train corrupted you'll notice you have this max iter like you do for logistic regression that's okay so i'm going to pass in the crazy billion dollar house and you can see that i have non crazy coefficients uh which is awesome or at least relatively non-crazy and the predictions i don't know i'm predicting on that example but anyway i guess i could have left it you're getting non-crazy predictions that's what i'm trying to show you so i can also do um and you do find the test data so the huber basically um doesn't get super messed up and uh outliers underscore so hr dot outliers underscore it tells you which ones you thought were the outliers and um that doesn't look right to me at all so it seems to have found a lot of outliers but we know there's only one outlier and so there's actually a hyper parameter epsilon which kind of determines yeah the smaller the epsilon the more robust it is the outliers getting a bit running out of time here um seems like outliers can potentially be security threats to models such as ones using self-driving cars really interesting point yeah um there's a lot of security threats to models not just outliers but that's a great point i had some stuff about that that used to be in the computer vision lecture but i moved it to the ethics lecture to make room for the stuff in multi-class classification long story short i will be talking about that kind of stuff like ai safety is kind of the term there i will be talking a little bit about that um and here i thought scikit-learn was perfect one of the examples of libraries that have that function yeah i could give you a whole list of complaints about psychic learn and my wish list it is definitely not perfect um it is made by humans probably many of which are volunteering their time at least i know one person who is what are examples of libraries that have that function i i don't know actually but um you might be able to google it can we hear a bit about your complaints yeah like so for example with random force and decision trees um it should you shouldn't have to one hot encode categorical features for like linear regression and stuff it makes sense that you have to one-hot encode categorical features because that's like the math of linear regression kind of requires it like you're multiplying stuff and you can't multiply a coefficient by uh you know by a string but um for random forests like with the splitting um it would be nicer if it could directly take in the categorical variables because there's no theoretical reason and there's actually something called cat boost that i'll probably talk about later that is like uh i did mention boost to you that like more natively handles categorical variables which might be a little better anyway there's a few other things but second line's pretty great uh overall and i'm very appreciative to the people who made it um two minutes left so i'll just quickly say outliers are not always bad i did already talk about this a bit they might be just regular data that are crazy values and maybe you want to leave them in so you have to think pretty critically about why am i looking for outliers what do i want to do about them should do i want to throw them away do i want to use a huber thing do i want to change my pre-processing there's lots to think about pretty much with any data set which is why i feel like i should move this to the first half of the course because it's more of a fundamentals lecture than a here's a common special case lecture um and there's the different types of outliers um sounds like a huge mess yeah i guess so um yeah my take home for you here is i want you to have this on your mind all the time i want you to have in your mind the distinction between outliers and x outliers and y outliers and train outliers and deploy um and and and even just having this on your radar will make me very happy compared to you all going out into the world not thinking about this whatsoever so um that's that um yeah here is the summary i won't read it out to you because we're out of time so i will end here and i will see you back on tuesday and we'll talk about time series data which should be a lot of fun see you then
Up Next

67:58
Apache Kafka Tutorial: Python & Docker Hands-On Project
@TechWorldwithNana
156.7K views•2025-09-29

87:26
Introduction to Secure Multiparty Computation with Yehuda Lindell
@fhe_org
7.7K views•2021-02-04

4:55
HTTP Requests Explained: GET, POST, PUT, DELETE
@codecademy
103.1K views•2021-10-07

19:25
Enigma Machine Mechanics: WWII Encryption Explained
@JaredOwen
13.2M views•2021-12-11
Related Study Plans & Knowledge Roadmaps
Structured learning paths in Computer Science
computer-science
Container Runtimes: Namespaces, Cgroups & Go
01Linux Systems & Go Programming Foundations
02The Core of Isolation: Chroot and Filesystems
03Linux Namespaces: Process Isolation
+ 3 more learning modules
32h6 modules
Explore Roadmap
computer-science
Building a CHIP-8 Emulator: Rust & CPU Basics
01Computer Architecture Foundations (Bits & Bytes)
02Rust Programming for Systems Development
03CHIP-8 Virtual Hardware Specifications
+ 2 more learning modules
32h5 modules
Explore Roadmap
computer-science
Building BitTorrent: Go, P2P & Concurrency
01Go Fundamentals & Concurrency
02Networking Foundations & P2P Architecture
03Bencode Parsing & Torrent Metadata
+ 3 more learning modules
26h6 modules
Explore Roadmap
computer-science
Actor Models (C++ Concurrency & Lock-Free)
01C++ Multi-Threading Foundations
02Thread Pools and Task Scheduling
03Atomics and Lock-Free Queue Design
+ 3 more learning modules
45h6 modules
Explore Roadmap