














![Tutorial -- Causal Fairness Analysis [ICML 2022]](https://i.ytimg.com/vi/k2hC2jxAmBI/hqdefault.jpg)








This tutorial introduces three key group fairness metrics for measuring fairness in machine learning models: demographic parity (measuring allocation fairness by ensuring equal selection rates across groups), equalized odds (measuring quality of service fairness by ensuring equal false positive and true positive rates across groups), and equal calibration (ensuring predicted probabilities have the same meaning across groups). The tutorial demonstrates these concepts using the COMPAS recidivism prediction algorithm case study, showing how fairness harms can arise from mismatches between what we optimize for and what we actually value, and explaining that it is mathematically impossible to simultaneously satisfy all fairness metrics when sensitive group membership is not independent of the target variable.
Fairness in Machine Learning: Fairlearn Tutorial Guide
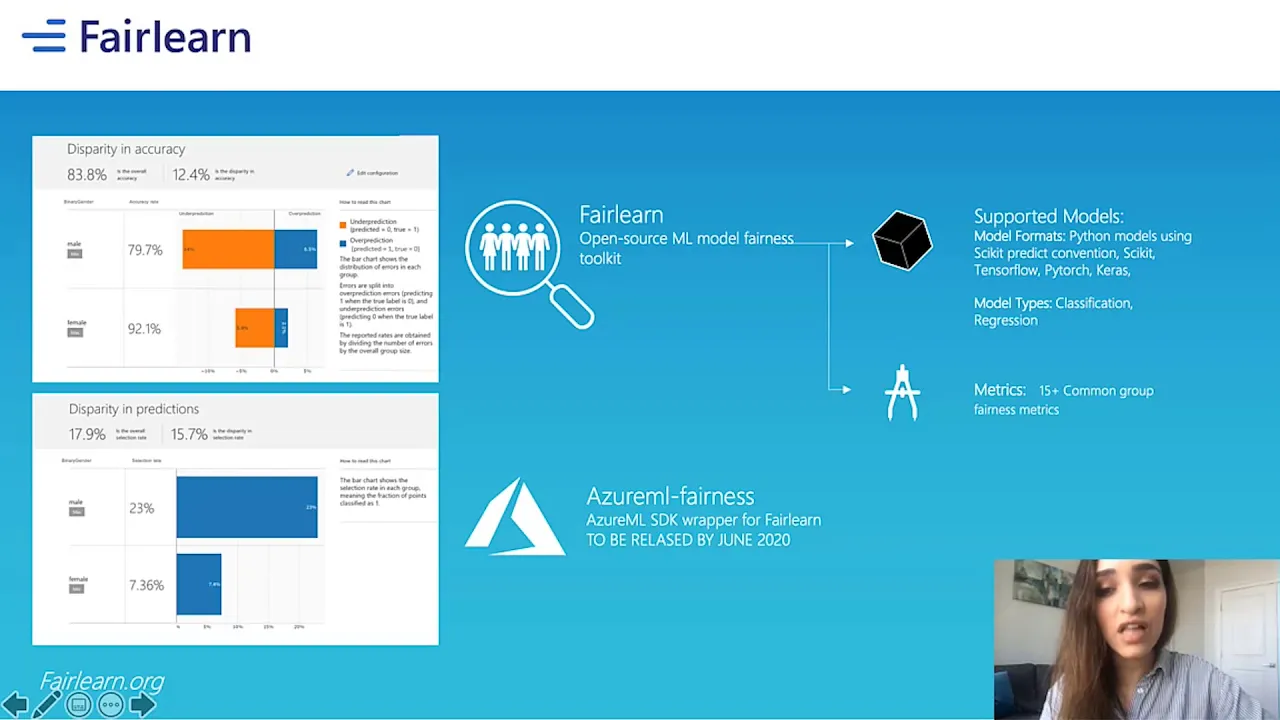
Added:you have any questions during the stream feel free to ask them in the chats and we're going to handle these questions during the stream and if the questions will be really really complex then we can always have some time to handle it later via other medium so welcome once again uh it's an introduction to fairness in machine learning um powered by fair learn and um as a pilot is amsterdam i would like to introduce to you today hildebeers i do hope that i pronounce it likely right close enough great great to know so uh what's important to say that gilda is actually an artificial intelligence engineer at inhoven university of technology and she works in research education and of course tools for fair and explainable machine learning and the last but not least she's also a maintainer of the failed learn project and now i think it's time to give the floor to hilda because she can definitely talk more about this library and also why this library was created definitely all right time to share your screen all right let's see if this works we do hope bam okay great just a sec so i can yes so you can switch all right yes okay so you cannot see me anymore but i'm still here everywhere all right um yeah so like uh alyona uh told you uh my name is hilde vert i'm an ai engineer at eindhoven university of technology and today we're going to um yeah learn a little bit more about how we can measure fairness of machine learning models let's see if i can go to the next slide yes awesome all right so um i'm going to start uh with a very short presentation about algorithmic fairness and then i'm going to give you a short introduction to the tutorial that we're going to do that you can also find on the github repository all right so um as you may have already read in the uh in the description of this tutorial we're going to talk about algorithmic fairness and this is um the definition of algorithmic fairness so to speak is the idea that algorithmic systems so it's in a broad sense of the word of algorithmic systems should behave or treat people without unjust or prejudicial treatment on the grounds of so-called sensitive characteristics so sensitive characteristics could be more traditional characteristics such as um gender race um sexual orientation stuff like that but it could also really depend on uh the case at hand and we've seen in the past few years quite a few um incidents if i can call them that where we've seen how machine learning systems can actually become unfair in one way or the other so first of all we have this example of an ai recruiting tool that was being developed by amazon and what they found is that this so this tool it scanned resumes and then based on that predicted whether somebody should be hired or not and it turned out that this model learned all kinds of things that were not associated with how good an employee would be but whether they were a woman or not so things like women's chess team were very important for the model this tool was never used in practice but it's an example of how things might go wrong another example that's very contemporary i would say in the netherlands is infrared detection we've seen with the child care benefits scandal in the netherlands we've seen that um if algorithms are used in well unfair ways they can really cause harm and this is interesting because the the child care benefits scandal the algorithm that was being used was actually super simple so it wasn't like a very incredibly black box complex model no and still it could really cause uh quite a bit of harm and then the final example that i have on this slide is translation so surely you've seen this example before but if we translate from languages such as turkish in this example that are ungendered to a gendered language such as english then you can see that we have um that she is that she is a cook he is an engineer can result in some stereotypical uh associations with particular uh occupations so these are just some some examples to show you what might go wrong and actually we can identify several different types of fairness related harms i've listed them on this slide so the first uh that i want to talk about is allocation harm so this is the type of harm where the system may extend or withhold particular opportunities resources or information to uh some groups more than to others uh so an example here would be for example the jobs that we've talked about before in a hiring scenario um a second type of harm is quality of service harm so this doesn't necessarily uh relate to allocation of items it could but it doesn't necessarily do so but you could also have a system that simply doesn't work equally well for all groups so for example if you have a skin cancer detection algorithm but it only works on lighter skinned people then that could be an indication of quality of service harm the third type of harm is representation harm so this could actually also be a cause of quality of service harm so if some groups are underrepresented in the data you can imagine that the quality of your model won't be equally well uh equally good for those groups especially if the data distribution differs a lot but also generally speaking if a system over-represents or under-represents certain groups that could also be already a type of harm the fourth one is stereotyping so this relates back to the the translation example another example would be if you google search an image search of ceo and all you get is um white middle aged men then that could be a form of stereotyping harm and this is particularly prevalent in unstructured data so like videos images uh text and stuff like that then a denigration harm and this is the case where the system is actively derogatory or offensive so you can imagine a chatbot that starts spurring out racial slurs there is also an example of google images that tagged a photo of africa to african american people as uh gorillaz which is obviously quite offensive and the final type of harm that we can distinguish is procedural harm and this is where a system makes decisions in a way that may violate social norms so for example if we make decisions on who we should hire or not maybe we feel like you shouldn't be penalized for being older for example in in a particular model so then if the if the model would use age uh in a monotonic fashion for example you um you would violate that social norm this is also closely related to interpretable machinery so today we're mostly going to talk about allocation harms and quality of service harm and we're going to dive a little bit deeper into that during the tutorial but this is just to give you uh an overview of all the different types of things that can exist they can also occur at the same time actually in fact i think in many cases they will occur simultaneously so yeah and one question that you uh may have now is um how do these harms actually arise so i always like to talk through this picture over here so what you can see is um when we are training a machine learning model we're using training data we're going to train a model we have some model and we use it to make predictions and this is all in our very nice and abstract model world so if you're a data scientist and you are usually doing a lot of stuff here but of course the real impact of an algorithm happens in the real world and this is also where you build your problem formulation where you collect your data and also where the actual impacts of the decisions that you base on the predictions occurs and in in this process we actually make a lot of small decisions that will impact what the final model would look like and many of those decisions you make implicitly and maybe they're based on practical constraints such as the availability of a particular data set or something like that and this is where the where those harms can arise so basically it happens when there is some sort of a mismatch between what we really care about so our values and how we have defined or problem or how we are the decisions that we're making and what we're optimizing for so for example in your problem formulation you can if you are developing your requirements of your model like does this really reflect all the things that you care about or maybe just the business value even though you may have other moral values that are involved as well another question is whether the data is actually a good representation of reality we'll also talk a bit more about that during the tutorial um what performance metric are you optimizing for so this is kind of the translation from the uh the things that we defined in our problem formulation to the machine learning context does the model actually make fair predictions um and perhaps even more importantly does the system as a whole produce fair outcomes because usually in many cases the machine learning model is not the final thing that determines the um the decisions like there could it could serve as a decision support system and then other people would make the final decision so this is just a glimpse and like i could talk about this for for a long period of time um but this is just a very short introduction of all the ways in which things uh might go wrong so just to conclude this very short introduction um first of all we've seen that machine learning systems can reproduce amplify or introduce unfairness we've seen different types of fairness related harms including allocation harm and quality of service harm and finally um i've tried to explain how fairness later harms can arise mostly due to a mismatch between what we're optimizing for and what we actually value so i hope this will become a bit clearer during the tutorial but for now if there are any questions at this point then please post them in the chat i think people are mostly thinking about their last uh days what they've done and how they optim for what metrics they are optimizing and all the things and they try to understand what kind of damage we could bring to the real world so i think it could be the case right yes everybody's reflecting right now yeah well let's then let's continue to uh to the tutorial uh introduction so we're going to dive into a very specific case study and it revolves around uh pre-trial risk assessments and this data set that we're going to look into was collected in the united states um and that's also why um i think it's good to give you a short introduction of the context of of how this data was collected so um the goal of the tutorial will be to uh learn how to measure uh particular notions of fairness using fairlearn um and we're going to look at the compass recidivism prediction algorithm um if you have already seen something about algorithmic fairness before then you're probably uh aware of this case study so we're going to use this as a running example and the learning objectives uh because i am also an educator so i like to define learning objectives uh is to learn how to uh apply good fairness metrics in python um we're going to look at some trade-offs between different group fairness metrics and we're also going to look into how threats to construct validity it doesn't matter if you do not know this word yet you will at the end of the tutorial and how it may impact downstream uh fairness related harms so about pre-trial risk assessment in the united states so um this is uh one step uh of the whole i guess criminal justice system um that is currently in place in the united states and what happens is that at some point first you need to get arrested um and then uh usually before you can go to trial so this is basically where they decide whether you're guilty or not guilty um you will have to go through pre-trial risk assessment and this is basically where the judges will assess um to what extent uh releasing you um might be bring a risk to society or it could be that um they just want to make sure that you actually show up for your trial so that's kind of the risk that we're assessing here and then after the risk assessment you have to await your trial and then you actually go to trial so this is all even before somebody goes actually goes to trial so they're still just getting arrested and not uh already convicted or something like that um so this assessment is used to determine like i said whether somebody will detains and this is when they will go to jail while awaiting trial or whether they will be released or not and if they are getting released um then there is the question whether they will be released on bill or whether they won't be released on bill and you will probably know this from the movies um in the us that bill is very often in monetary terms so you actually have to pay money and then you could get released or not get released um if you cannot afford to pay bill um it is possible to get something called a bill bond um where you usually uh you you you kind of borrow the money so to speak uh but this is also at a fee of about ten percent of the bill or something like that that's non-refundable so if you uh the pay the bill uh if i recall correctly you will get it back at if you uh actually show up at the trial um but if you don't you you have to pay it but if you go for a bail bond so if you couldn't afford the bill yourself then you actually have to just pay a non-refundable amount of money to the person who will post the bill for you so this is all very important to understand the context of what we're talking about here and what the consequences are of the model that we are going to uh assess so in 2017 or 2016 i'm actually not 100 sure um there was this analysis of pro-publica where they analyzed compass which is a recidivism prediction algorithm that is actually being used by judges in the united states and they showed that this model filled very differently for african-american defendants compared to white uh americans so we can see here uh this is a nice little overview so we have the percentage of false positives you can see that it's like twice as much for african-americans and the other way around for the false negatives and this is an incident that sparked a lot of discussion about fairness of machine learning systems or of algorithms in general and machine learning systems in particular and yeah that's why i think it's a really nice case to dive deeper into in the tutorial so without further ado let's get to the jupyter notebook tutorial all right uh but let's see first if there are any questions right now feel free to post them in the chat okay we'll be checking i see no questions but please do ask questions to the people watching otherwise i'm just going to assume that everything's crystal clear it is it is for me it's going great awesome all right um so i tried to make this tutorial in a way um that it's also why is this not closed quits so actually you don't have to see all my whatsapp messages um all right um so i tried to make this tutorial in a way that it's uh also readable without the the introduction slides um so this means that we can actually skip this first part because this is what i just told you uh a few minutes ago i think i'm just gonna make this one like this so we have a little bit more space all right um oh yeah something that i didn't mention and i think that's important to mention is um that if you have a false positive in this scenario then it could have a big impact on the defendant's prospect so i hope that i made that clear in this little figure that i showed you earlier what the consequences actually are um because if you are false positive and you are going to be detained um you will have to await trial ngo and this is this makes it much more difficult to prepare adequately for your trial um so that's important to know um and on the other extreme extreme we have false negatives which could mean that dangerous individuals are released into society and there's also a really nice tutorial uh created by i don't remember exactly who created but it was on a fact a few years ago where they actually invited somebody who has gone through this entire process to give you a real good insight into the context so if you're interested i would definitely recommend you to get to go check it out so it's also a final point that i want to make before we move on to the actual contents of the tutorial is that there that using algorithms for pre-trial risk assessment is not like uncontested so to speak so proponents they they argue that there is the option that it can use that it can lead to more efficient and less biased and consistent decisions compared to if you have as just human decision makers um but there have been quite some concerns about how the scores may replicate replicate historical inequalities and um even if you could produce some sort of a fair risk assessment then you could also still argue that that doesn't really solve the problem that we have with money bill this is just to give you a little bit more context all right so the main definition of fairness that we're going to look into is group fairness and this is a particular notion of fairness where we consider the extent to which particular groups of individuals are at risk of fairness related harms and those groups are referred to as sensitive groups in the rest of this tutorial and like i explained earlier they could be defined on legally protect protected sensitive characteristics such as race and gender but could also be very specific um yeah so just an example if you look at an automated essay grading tool then perhaps um the more traditional groups aren't as important but it could be important to check whether the model works equally well for native speakers compared to non-native speakers of a language for example so we're going to look into three group fairness metrics called demographic parity equalized odds and equal calibration and these are the three i would like to say main group fairness metrics that are used a lot in uh fairness literature um and we're going to dive deep deeper into what what these words mean and when you should use a particular metric or not um so first we're going to uh import all the things that we're going to use we're just going to use pandas numpy map lib um from fair learn we're going to use quite a few different things and also we're going to use a bit a few functions from scikit-learn so let's import those right so we're going to use the data set that was actually collected by propublica which i explained earlier is the organization that kind of revealed how compass might be unfair and they collected this data through public records requests in broward county in florida and we're going to use the pre-processing steps similar to the ones propublica used i'm not going to dive very deep into those um but yeah let's see oh i'm not sure if this is actually necessary but uh yeah okay so uh what does the data set look like so we have a few columns so we have uh the sex uh of the uh defendants um which is measured as u.s census uh sex categories so this is just what they were able to retrieve um i do not know whether this is the sex that that is on their passport or whether it's some other version of gender or sex but this is what we have the data that we have uh age um we also have the race of the defendant and this is the race that was uh as it was um um measured uh in broward county's records so this is an adapted version of the u.s census racial categories and it includes african-american caucasian hispanic which is more of an ethnicity i think than race but it doesn't really matter and asian native and asian and and native american uh we also have desile score so that's this one over here and this is uh the compass score um expressed in deciles of the raw risk score and yeah here's some more information about how these are um are collected i'm not going to dive uh very deeply into this but it's good to see that uh one two four is considered as low five to seven is medium and eight to ten is high then we also have the priors count this is the number of prior charges uh up to now um excluding the current offense um two-year received so this is the two-year recidivism although i should probably say that it's the two-year re-arrest um so this is whether the defendant has been re-arrested within two years after uh the con the uh the current charges were registered and then we have uh this uh little column over here so that's just generated uh here and what all we do here is just binarize the decile score based on what we've seen here so everybody who's medium or high is considered as a true and all the other ones are considered as false alright so now let's first have a little look at the distribution of the demographics in the data sets so we can see that males are quite over represented compared to females in a data set and we can also see that african-american and caucasian people are also quite common in this data set and hispanic other quite a bit lower and asian and native american very small subgroups so in the remainder of this tutorial we will kind of replicate some of the analysis that republica did so we're going to focus on african-americans and caucasians it will this will also make it a bit easier to show you all the different fairness metrics but you could easily uh also consider more more categories and yeah you will get just some additional insights so we're just going to select those so now our data set only contains people for which the race was african-american or caucasian all right so now we're going to get to our first fairness metric so this is a demographic parody and demographic parody can be seen as a measure of allocation harm so i've discussed allocation harm before and this is a situation where the system uh disproportionately extends or withholds opportunities resources or information to some groups and we can measure this as differences in the selection rate of the algorithm so what this basically what this means is the proportion of positives equal across groups and for example in a hiring scenario this could mean that we that the proportion of applicants says are female then the sorry the proportion of people that we actually hire based on what the algorithm said is the same um in the group of women compared to the group of men or compared to the group of uh any other gender that you prefer um yeah so what this means is that the output of the model is independent of sensitive group membership and this is the formula so here we have the predicted predicted class we have group membership and we want that the probability that somebody uh is predicted to positive is equal for some group a and some other group a prime so it's very good to realize that this metric does not depend at all on the ground truth data that we have so as you can see it only has y hat which is the predicted uh target variable but it doesn't contain anything any information about the um about the target variable um so you could ask like why when would should we use demographic parity as a fairness metric then because it doesn't take into account our target variable well this is actually on purpose because the underlying assumption of this fairness metric is that either everybody is actually equal even if we do not see it in the data so for example we may believe that the traits of whether you are suitable for a particular job is independent of your gender but it could be the case that due to social biases and historical hiring decisions that the hiring decisions um are do not um adequately represent this um so that's why so basically we're saying we believe that the target variable is not an adequate measure of what we actually want to measure and the other scenario would be that maybe we do believe that it's a good representation of reality but we want to make up for uh wrongdoing in the past so for example again with the gender uh in uh job suitability well maybe there were some lacking opportunities for some groups compared to others and we want to make up for um for those things so these are typical scenarios where demographic parody would hold generally i do think it's always good to just measure this um to get an idea of the proportion of people that you're getting positive predictions for especially if it's used to distribute resources like a job or loans and stuff like that but it is good to realize that if you want to enforce demographic parity and the base rates in the data set are not the same so the proportion of positives in the ground truth target variable uh are not the same between groups then um you will you will have to treat some groups different from other groups so it could be that two people that have the exact same features apart from race they would get a very different prediction but we will talk a bit more about that when we get to the limitations of some of these metrics um so yeah so now let's get to actually uh computing these um so we can use uh fairlands metric frame to [Music] to analyze the uh the fairness of the compass scores so metric frame is a nice class that kind of i think it's it's it's somewhere in between um what you would expect from pandas and what you would expect from psychic learn so the api is also uh will i think will be quite intuitive um [Music] so we have the following parameters so first of all we have the metrics so this is some callable metric and you can use any scikit-learn metric here um we also have some metrics that you can use in a that are defined in fair learn uh we have y true so this is these are the ground truth labels white cred these are the predicted labels so the labels predicted by the algorithm um we have sensitive features so this is a column of your data set that includes the sensitive features we also support multiple sensitive features and then we also have control features and this is a very specific parameter that also contains a column of your data set but this is uh features that you might want to investigate uh disparities for separately so you want to sort of control for this particular uh feature i just realized you cannot actually see but i did the what you call them the hack yes i did them by myself [Music] so for example you might expect that some particular feature could explain some of the observed disparities between sensitive groups so for example if you are predicting um the amount of salary that somebody should get then you could say well the number of hours that you work we should control for that when we compute whether there are disparities between so this sort of like explainable features can be can be included here so um metric frame has a few things that you can look into so we have by group and this is a data frame with a metric value for each group we have overall this is just the metric value for the entire data set and then we can also compute all kinds of methods to compute for example the the absolute difference between groups for each metric but i think it will become clearer when we get to actually doing this um so in addition to metric frame we also have some pre-defined fairness metrics and i will showcase those as well but under the hoods they all use metric frame so that's why it's probably the easiest if i first start with that one all right then we can start with the first exercise where we're going to use metric frame to compute differences in selection rate which is basically um demographic parity all right so we have um in fair learn we have um a a metric so like a base metric that is called selection rate and all this does is compute the the average over the um the target variable that you have predicted so just the proportion of positives basically and um then we have y true um so in this case like for selection rates this doesn't really matter because the selection rate only looks at white price but just for consistency we have here so i could basically use anything here so i'm just going to use the decile score cut up which if you remember um is the binarized version of the compass score and more importantly we're also going to use this at white threads cut off right and then for the sensitive feature we're going to look into the race column all right oh invalid syntax what did i do wrong oh i forgot to close this one is it really a tutorial if you do not make any mistakes i'm not sure all right um so now we've computed this but it doesn't really show you anything yet um so what we're going to do is we're going to look into by group so this is what i explained before a nice little data frame that will showcase the the computed metric for each group separately and then we also going to print the overall score like this all right so here we can see that the selection rate of compass is zero point almost 0.6 for the african americans and for the caucasians more around 0.3 so you can see that it's very different here um and this as we will see later on uh can be quite problematic so what this means is that compass predicts much more often for african americans that they will get rearrested within two years than it does for caucasians in the data set so this is just a data frame and if you have more metrics or if you use control groups and stuff like that it will become bigger um and in some cases it can be nice especially if you're optimizing for something to summarize it in one single number and this is also what people would usually refer to as the actual fairness metric i would definitely recommend you though to always first start with actually checking out the differences manually uh in the in the metric frame because i can give you a lot more insight than just us trying to squish everything down into one single number but we can do that here so um we can use metric frame dot difference and what this does it computes uh the difference and you can choose whether you want to compute the difference compared to the overall uh or between different groups so here i'm going to go for between groups and then we can see that the the demographic parity difference so the differences in selection rate is 0.25 which is what we would expect here so we can also use demographic parity difference which is a function that we have in fair learn we can also use it directly to compute the difference in selection rate and in that case we can just repeat what we also put up here so we have the data i'm just using this one again like the the y true isn't really used here but uh because for selection rate we only consider white red oh i see i forgot the d great put embrace and then here you can see uh methods and this is basically you define here whether you want which is similar as you seen here so uh whether you will use between groups or overall so this is the same same thing and then we can just compute it what did i do wrong oh yeah typos yes there we go so it's exactly the same as we've seen before which is um as it should be so we have seen that the selection rate is quite a bit higher for african americans um and you may wonder whether this is some disparity that is introduced by compass by this by these scores or whether we can see a similar pattern in the uh the ground truth um data so to speak and this uh like the select selection rate um in the data we can refer to as the base rate so we can do the exact same thing here but then rather than considering the uh d cell scores cutoff we're going to compute the selection rate for the actual recidivism uh prediction so that's uh [Music] whether somebody will get re-arrested or not and here again of course we're going to put in this and again we can summarize this by computing the difference and we can see here that the difference is there is still a difference between african americans and caucasian in terms of selection rate but it is much smaller compared to what is happening in uh in the compass scores so um there are many different reasons why uh this base rate difference um exists even in the ground truth data so apart from what is introduced maybe by by the compass scores and um [Music] one of these explanations and i think this is very important to understand is that the observed recidivism rate may not represent the actual recidivism rate so like i've said a few times before what we're considering here is re-arrests and that's just a subset of all cases of recidivism for some people we might not even see that they actually get re-arrested or because um whether they will re-offend or not just simply because they are not caught so to speak um so it could be that um these disparities are more reflective of uh racist policing practices rather than the actual uh crime rate another uh thing that could be the case is that there may have been um some social deprivations that have caused the true underlying recidivism rate to be different across groups um so it might be the case that african americans are indeed more likely to fall back into criminal behavior but this might be due to uh circumstances that are out of their control um and also historical injustices and of course these two like they do not necessarily uh occur um like they could overlap obviously um and there may also be other factors but what i think is very important to realize is that you cannot know which two of these explanation holds from the data alone you really need to understand how the data was collected um what the social context is of the of the model that you're building um yeah so that's just important to realize that we cannot learn everything just from the data sometimes the best thing is to just get away from your computer and talk to people to actually see what's going on and something i've alluded to before already and that is construct validity so some of you might be familiar with this term uh it's particularly useful particularly often used in social sciences and what this means is to what extent does the thing that we are uh well the measurements of what we're trying to measure actually measure what we are trying to measure so the phenomenon that we are trying to measure and this is a really nice way to think more deeply about whether your data is actually suitable for a particular purpose especially in the context of fairness because many of the fairness related harms can be um um traced back to to issues with constructs validity so just to give you a few examples like in addition to that re-arrests is not the same as recidivism um healthcare costs can be a biased measurement of healthcare needs so it could be the case that the cost reflects patients economic circumstances instead of their health historical hiring decisions are not necessarily equivalent to historical employee equality again these could be caused by a systemic or unconscious social biases in the hiring process and similar to the re-arrests uh observed fraud is only a substance sample of the actual fraud and if you do not select uh the cases that you're going to investigate for fraud randomly there could be some form of selection bias and if this is associated with sensitive group membership for example because uh people have um the the fraud analyst analyst may have subconscious biases here then some groups may be over scrutinized and that can cause the observed fraud rate to be inflated compared to the actual fraud rate and each of these cases of of bias for the lack of a better word um is much easier to spot if we look at the data through the lens of construct validity so we do have a nice little section introducing this concept in the user guide fairlearn so if you're interested i would definitely recommend you to check it out but generally speaking i think it's just a very important concept that as data scientists we sometimes forget because we just get a data set and then we you know we just take that as the ground truth um but it can be a very very valuable process to first consider this idea of construct validity of the data that you have whether you collect it yourself or not so this was a nice little intermezzo and now we can go to the second fairness metric and this is equalized odds so this is a measure of quality of service harm so just to reiterate quality of service harm is a scenario where the algorithm makes more mistakes for some groups than for others basically you could use any predictive performance metrics metric to measure quality of service harm but something that is often used is equalized odds and what we do here is that we see whether the false positive rates and the true positive rates or equivalently the false positive rate and a false negative rate because the false negative rates just one minus the true positive rate um and the idea is here that they should be equal across different groups um so just to give an example of um quality of service harm in a hiring scenario um we might mistakenly reject strong candidates so this is again under the assumption that um the uh or how do you say it conditions by the target variable you can see that here like here it does include y whereas if we look back at demographic parity um we didn't have this conditions on on the true ground truth variable um yeah so so it could be the case that we mistakingly reject strong female candidates more often than strong male candidates and this is um this this type of harm can particularly occur if the relationship between features and a target variable is different across groups so the data distribution differs a lot between groups and then if you have a lot more data for one group compared to another group then this could definitely be a cause of quality of service harm so an example that is often mentioned is a facial recognition system that doesn't work well for people with a darker skin compared to people with lighter skin and this was mostly due because the training data sets contain mostly lighter skinned faces i would like to highlight though that it's not just a data problem because as i've tried to show you in the in the slides before um it already starts earlier at the problem formulation and what you care about and measuring the things that you care about like if you're if your team would have consisted of like a more diverse group of people and probably you would have spotted um these these these uh disparities in quality uh before deploying the actual model but that's just just my personal side note here um yeah so getting back to equalized odds so it's simply the false positive rate and true positive rate should be equal across groups so when should you use this so as i already alluded at the main difference with demographic parity is that we actually condition on the ground truth variable and this directly implies that we believe that the target variable is a good representation of what we are actually interested in um yeah so that's that's uh that's what i wanted to say about that one um yeah and as we have seen in the introduction if we have a false positive and pre-trial risk assessment can a very large confidence for the involved defendants um and actually it has it has been shown that uh defendants might even just plead guilty just because they do not want to await trial in jail because it could sometimes even be a year or more and then it's easier to just plead guilty to a minor crime even though even if you didn't do it um but that's uh more about the problems with the us criminal justice system rather than the fairness of the machinery model um okay so now we're going to use metric frames similarly as before but this time to look at equalized odds so we can use multiple metrics in the metric frame so you can just define them as a dictionary and then we can just false positive rate and then we have the false negative rates like this so these are uh also included in fair learn false positive rate and false negative rate um they're based just on psychic learn metrics but cycle earned doesn't actually have these specific ones they just compute what you call it uh confusion matrix okay so here we can see the same numbers that we uh that i actually showed you earlier in the slide so we can see that the number of uh the false positive rate is about twice as high uh for african-americans compared to caucasians and the other way around for the uh for the false negative rate so this is uh exactly what um propublica computed and then we can use the metric frame difference again to compute the difference between groups as you can see if we have two metrics um it will just i can actually also just show you what this looks like so this is just a series of panda series that give you gives you the false positive rate and false negative rates um i just wanted to print it i don't know why i wanted to do that but there you have it um we can also just like before with the demographic parity difference function we can also use equalized odds difference um of course these are two underlying base metrics um so we have to uh somehow aggregate that and then this function we have chosen to use the maximum of the false positive rate difference and a false negative rate difference so if we compute that over here you can see that it just takes this one because it was higher so the false negative rate difference was was higher and can be useful if you um are for example doing um some fairness mitigation uh which we won't discuss in detail today but uh in the next tutorial in january february i think february next year um [Music] now we're going to dive a little bit deeper into that um let's see yeah but again i would always advise you to if you are doing a real assessment of your model always also look at this because it gives you so much more information than just trying to squeeze everything into one single number all right then we have another small intermetro points that i wanted to make and that is the problem of small sample sizes so as you can see many of these group fairness metrics they rely in one way or another on calculating group statistics um and it could be the case that the number of individuals in the data that belongs to a particular subgroup is is very very small so as we have seen in the beginning of the tutorial the number of uh asian and native americans in the compass data set was very small it was like 31 and 11 instances and with those small sample sizes your estimates of those group statistics such as the selection rates the false positive rate etc they become very uncertain and then also your measurement of fairness becomes very uncertain so basically it will be impossible to accurately assess the risk of fairness-related harms let alone mitigate them and this is particularly in particularly important if we consider intersectional subgroups like instead of just considering african-american people and women separately if you look at the subgroups such as black women um then the groups become even smaller and it can be quite problematic because actually fairness-related harms often accumulate at the intersection of marginalized groups so this is um just a small intermediate to highlight the importance of uh making sure that you have enough data of each group even if it's just for assessing fairness and we can actually use the count function which is in inferior learn as well to very easily compute the counts per group we are working on adding some sort of confidence interval style uh things to the metric frame but that's not something that was under development so it's not yet here um yeah and here you can see the same thing as we've seen before and especially if you have like many different groups or you're doing your first estimates then this can be quite a neat little trick to uh so make sure that you take into account to count take into account the account okay um so that's what i wanted to talk about uh to tell you about equalized odds so so far we have seen demographic parity um which measured the differences in selection rates which you can use if you believe that the thing that you're trying to predict might not be an adequate measurement of what you want trying to predict we have seen quality of service time metric equalized odds and there's also this third notion of fairness and that is equal calibration so northpointe which is the company that developed compass they actually responded to propublica's analysis that compass scores are fair because they scores are equally calibrated across racial groups um so um calibration you're probably familiar with the term but what this means is that the probability probability that you belong um to a uh particular class is equal to the actual proportion of people that are classified as such that they also belong to that class so uh in the binaries uh case um we can uh define it as such where we basically we're trying to look at the proportion of actual positives um [Music] conditioned by the uh sensitive group membership and the predicted value so for example if you have an instance that is predicted to belong to the negative class then the probability that this instance actually belongs to the negative class is independent of sensitive group membership and this boils down to equal in the binary classification scenario to the positive predictive value so that's just precision and a negative predictive value so when you should you use equal calibration as fairness metric um so the underlying assumption of equal calibration is that every score should have the same meaning um regardless of sensitive group membership so if you get a score of 0.7 that should mean the same thing whether you are in in one sensitive group or in another sensitive group so here the assumption again is that the target variable is a reasonable representation of what reality looks like or what we want reality to look like but it does not acknowledge that the relationship between the features in the target variable is different across groups [Music] and in most cases it doesn't really require you to do any active interventions because we we sort of get equal calibration for free um and without intro including explicit fairness constraints such as equalized odds and demographic parity we often implicitly optimize for equal calibration so i want to note that [Music] this particular notion of fairness does not very easily translate to the uh the harms that we've discussed before except maybe procedural harm where some groups are treated like if it doesn't hold if 0.7 does not mean the same thing then um yeah then then then uh that could be a form of procedural harm but it is quite difficult to see the direct harm that occurs because of that and that's why i'm usually not a huge fan of equal calibration as a fairness metric but because it is such a big part of this discussion about compass i think it is important to um to explain it to you here okay so now let's uh go and look into that so the positive predictive value as i explained before is equivalent to precision so we can just use scikit-learn's precision score the negative predictive value we can just define a new function to compute that's basically the precision score but then for the negative class so all we do here is just um use a different pause label and then we get that one so that's the negative predicted value score and we can again use metric frame to compute this so we can do precision score and uh yeah i'm just gonna copy paste that because i'm lazy like that oh yeah and because i make typos all the time apparently is this how you spell that yes it is all right so here we can see that um the differences indeed look pretty small and we can again compute it um like this so 0.05 0.06 that's quite small um and uh at least compared to the other differences that we've seen um yeah so it does look like the claim of north point that there is equal calibration that that that actually holds here um another internet so thing that i really want you to think about in the future so um i've talked a bit about construct validity of the target variable so far um but something that is often forgotten is this idea of construct validity but then of the sensitive characteristics so in this data set we have measured race as um the the specific categories just the ones that were used by broward county uh sheriff's office but it's very unclear how these measurements were obtained like is this some form of self identification is this race category based on what's observed by police officers or maybe something else um it is also unclear whether it was even possible to enter multiple categories for race even though people might very easily identify with multiple multiple races and like of course in practice we are usually already happy if we have some sort of measurement of these sensitive characteristics but regardless i would really advise you that if you have the opportunity to collect this data yourself to really think through what you are actually measuring because these are social constructs and many of these are social constructs like race and gender and there are many different ways in which you can actually measure race and it could affect what you can conclude how you measure how you measure this just to give some examples you could include self-reported racial identity observed race based on appearance observed race based on interactions you could even have the racial identity that you think other people think you have so that's like another dimension so just many different ways in which you can measure it um and there are some differences in the conclusions that you can draw based on how you actually measure this so that's just something that i wanted to note to note here like for example if your data is based on some sex category uh that only includes male and female then what are non-binary people or people who identify as a different gender like i mean often sex and gender are of course completed but um [Music] or how do you say that they are mixed as if they are the same thing but does it really matter um just try to think a bit about how you define your sensitive characteristics that's all i'm trying to say here all right um let's see how i'm doing time-wise you're doing good i think i think it's going well yeah awesome um i see there's also no question so far but thank you marlene for uh for noting that you think it's interesting that means a lot um all right um so one thing that i didn't notice so far i didn't uh didn't explain uh so far we've mostly used um the metrics that are already in fair learn so um equalized odds difference demographic parity difference those predefined functions but we actually do have a specific function to make your own fairness metric based on any base metrics so to speak and this is actually what we also use to derive those other predefined ones but you can just use it for anything you like so if you are in your use case for example um maybe the false positive rate and false negative rates aren't as important but maybe precision and recall are important then you could make a recall derived metric where you look whether the recall is different between groups or not so this function has a few parameters so we have metric uh so just that's the the base metric um so to speak we have transform so this indicates whether we are considering the difference the group min the group max or the ratio um we have sample param names so this is a list of parameter names uh of the underlying metric which should be treated as sample parameters i'm not going to dive very deeply into this but usually this will be for example the weight function so if you have sample weight then you could use that one um [Music] over there and let's see what else do i want to note yeah so it's so it's results uh in the same signature that we've seen before but then with a sense the features parameter and the methods arguments so under the hood this function again uses metric frame to compute those metrics disaggregated per group so we can make a custom a custom fairness metric for um the uh let's see for the npv one that we've discussed before so let me go back i already selected this right so this is just where we introduced the callable and then let's just use the difference here so now we have this function and here you can see i cannot see it like this it doesn't really matter so but we can use this uh this function now uh in um to compute the difference between groups similar to before so here you have um the you can input the let's just do this in the right way so we have y true and we have a white thread so that's similar to what the negative predictive value score had as inputs but now we can also input the sensitive features and then we can use we can choose whether we want to compute this compared to the overall or compared to between groups also similar as before like this and then we see this is the exact same thing as we've seen before uh over here so that's just a neat little function that i wanted to show you um then finally um we can also further investigate the calibration so we were looking at equal calibration if you lost track of what we were uh looking into uh and we can also just uh compute uh we can also plot the uh the calibration curves just to see uh whether this is the case or not so um you may remember that we have binarized the compass score so the original d style scores but we can actually create a nice little calibration curve of the of each racial group so um if you have perfect calibration you would have something that goes on the dotted dotted lines plotted here so you can see that it's actually not very well calibrated but the calibration does seem very similar um for the two different groups so that does seem to support northpointe's claim that the scores have equal calibration so at this point um we're going to get a little theoretical but i do think it's important to note [Music] you may think well all of these fairness metrics seem to have some value to them right so like there are some intuitions that sort of make sense so why don't we just optimize for all of them at the same time well um the thing is that in most cases that's not really possible unfortunately so we have seen in this tutorial that some understanding of fairness so in this case equal calibration that does does hold for compass scores but both equalized odds and demographic parity are definitely violated and it's good to realize that these findings are not specific to this case and it has been proven mathematically that in cases where sensitive group membership is not independent of the target variable so basically if the base rates are different between groups and you want the output of the classifier itself to be well calibrated so basically you want it to be as close to this as possible so not necessarily per group which is the overall classifier under those conditions it's actually impossible for these fairness metrics to hold at the same time and i'll try to explain that a bit more because it's actually quite intuitive um so if you consider for example demographic parity and equal calibration then you can imagine that if group membership is related to the target variable this implies directly that one group has a higher base rate so proportion of positives compared to the other group so then if you want to enforce demographic parity this means that you need to uh select more positives in the disadvantaged group than what was suggested by what you have observed in the target variable right because you want to increase the selection rate compared to the base rate that is actually in the data set so the positive predictive value it must be different for each group because the proportion of the true positives that we predicted to be positive it will be lower in the disadvantaged group and we can make similar arguments for demographic parity and equalized odds and also for equal calibration equalized odds i think demographic parody and equalized odds is probably the easiest to um to understand so here again if you have unequal base rates and that means that you have to classify some instances in a disadvantaged group so the one that has a lower base rate as positives even if they should have been negatives according to the observed target variable so um if you want the scores to be well calibrated so if you want um the the 0.7 to mean the same thing for each group um then you cannot you you simply cannot satisfy both demographic parity and equalized odds because you will make some mistakes in quotation marks um for uh for the disadvantaged group so again this is why we only use demographic parity if we believe that the target variable may not be a super accurate measurement of what we're interested in and of course um i'm not saying that you should always only compute demographic parity or only compute equalized odds because both of these can give you very valuable information but once you start to optimize for particular uh things then uh you you just really need to be very careful to consider what the assumptions are of the things that you are trying to compute here and um this is also what i'm trying to say in this uh this bold part that um like it has been these these impossibilities and the impossibility of fairness and blah blah blah it often has been presented as oh it's like the math doesn't hold up but actually the dispute is more of the underlying understanding of what is fairness in our scenario what do we consider fair that's what you need to think about more and not necessarily about the math in my in my personal view all right um yeah so and and then uh yeah so one thing that i think is very important is to make sure that any assumptions that you have about this um you just have to make it very explicit when you discuss fairness with other stakeholders like uh people involved with the business or users of your system all right um i'm gonna start uh finishing up the uh the tutorial part so um there's a few practical challenges if you want to start applying this in your daily work so one thing that's very important is to identify um the right uh sensitive well right i mean in quotation marks again um is to identify the sensitive groups so you need to identify what groups of people might be at risk and as i said before how you're actually going to measure that and it's very it can be very difficult and very tricky like in this tutorial we already decided that's going to be race and we're going to look into that one but of course in practice you need to find those group yourselves and you need to really um have a really deep understanding of the context of where you're going to use your machine learning model so especially if you're going to make predictions about people always always try to identify groups that may be at harm but even in cases where you're not directly making predictions about people this can be this can be a problem um and it's yeah it's something that the data itself cannot solve you need to need to talk to people sorry sorry to uh to break it to you um then there is the access to sensitive features so there might be privacy regulation or just practical constraints uh why sensitive features may not be available and that makes it quite difficult to compute these group fairness metrics although i think that in the ai act they're trying to like that's a new regulation proposal that they're considering in the in the european union where they are thinking about making it legal in more cases to collect this sensitive information for the sake of analyzing fairness but that's in the in the future maybe something um that would be nice and as i explained small sample sizes can be quite problematic in a practical sense so there's also just a few inherent limitations of these corporate metrics so first of all um we're computing averages across groups but that means that we ignore within group differences and it could be the case that there are actually subgroups that are at an even greater risk of harm and then there can be disguise if you only for example if we only look at race um but the actual harm occurs at the intersection between race and gender for example i don't know uh black males for example then that could be i think that could be a problem it's also just observational so it doesn't consider at all like how the prediction was achieved we only look at the outcomes so that might also not give a complete picture of what you're interested in it also doesn't in include at all the individual experience so we're assuming that a positive is just as positive for person a as it is for positive as it is for person b um even though that might not be uh might not be the case at all um and then um it's also very important to consider and this is going back to that picture that i showed you in the well it's already over an hour ago so i don't expect you to recall it exactly but there was this picture with the clouds with the model and with the real world and um these fairness metrics only consider the direct output of your machine learning model um but not the outcome of your system as a whole right so um for example in in compass specifically uh the outcome is not determined by the compass model directly it is determined by the judges and how they interpret the provided risk scores so for example even if we could um somehow make the risk scores in such a way that um that they are fair to some extent if the judges with their own biases interpret a risk score for uh one group differently compared to another group then this could still introduce uh some bias and unfairness in the final result of the system so trying to move beyond the mere algorithmic frame is always a good idea all right then we are at the uh the main takeaways of the tutorial so i hope that after this talk you've learned how different fairness metrics actually represents different theoretical understandings of what fairness even means and that is also reflected in the incompatibility of these fairness metrics i also hope that if you take away one word it's construct validity because it's central in assessing fairness in how you define your target variable and how you measure sensitive group membership and actually also in how you choose a fairness metric because you can also apply construct validity to the idea of fairness like we are using equalized odds for measuring fairness but what do we actually mean with fairness and does this actually measure the thing that we are interested in so it's also a useful tool there um yeah i've added some things that you can just some discussion points that you can just think about um we don't necessarily have to uh like i don't expect you to to give the answer in the chat but i think it's uh it might be interesting for you so for example you can think about um what notion of fairness you think is most appropriate in this particular scenario or maybe even more importantly in scenarios that you are working on in your daily work another question there is a way to account for unequal selection rates by using a different cutoff score for each group so for example for one group you would say oh about everything above 0.5 is a positive and for the other group you would say everything above 0.8 is a positive which means that two people with the same score um maybe classified differently and yeah one nice thing to think about is like when do you think that that's fair or if you think that's fair at all and then finally and this is a question that we get a lot at fairlearn it's like oh so so how so what value should my fairness metric have for it to be fair um and unfortunately the very unsatisfying answer to that question is always it depends and in some cases especially when you optimize for demographic parody there will be some how do you say that performance uh decline there there will be a decline in performance if you want to optimize for demographic parity um so how equal do you think is equal enough that's also something you can definitely think about so if you want to learn more about fairness there is a nice book by so long solon moritz and arvind which is currently still in development but they have quite a few nice chapters for you to look into i also wrote some lecture notes for my bachelor's course uh at eindhoven university of technology on responsible data science so you can also check that one out if you like and also throughout the whole tutorial i've sprinkled in some nice links to research papers or articles that can also be uh be interesting for you if you're if you want to learn more so i think that's um that's it for the tutorial um [Music] i hope uh i hope that you've enjoyed it um yeah so if there are still any questions then feel free to ask them i will stop sharing the screen now and then you can see my face again cool thank you so much this really really valuable information was really goodly that's a good and um outlet i'm mixing that now it's not making a word sorry explanation um while waiting uh for some questions in the chat if there will be some of them otherwise probably people start thinking about all this why's especially related to their everyday job yeah um i have a little bit like question outside of the scope of this lecture but a little bit about fair learn so what you could advise uh to people who want to start with for example their first open source commits to firelord library and this um and second uh yeah what kind of help is really needed right now for fair learning library oh yes oh definitely yes um so um we actually uh are open to like many different types of contributions so if you are really into coding we have things if you're more about um i know thinking about practical considerations like how should people do with this if you want to dive into a particular topic so we have a whole different uh range of things that you can do so the easiest way to find out about these is just to go to our repository we have a list of existing issues um which also have tags like um uh what's it say again um you have easy attack and also like uh something like beginner or the first person probably yeah something like that like it's a it's a very clear attack i just cannot come up with the term like good first issues yes something like that yeah the good first issue yeah so we we have those tagged um and it ranges a lot from um you know adding additional documentation to adding new uh components to the library but we also are very actively developing learning resources resources because we believe that um you cannot really solve fairness just with technology so you also need to step outside of your your technology boxing we kind of try to lure people in with with the tech and then we uh we keep them with the social technical context [Laughter] so that's the idea but there's a lot of things that still need to be done so if people are interested um we also have a weekly community call uh on thursdays at 5 00 pm so it's like 1700. um every thursday um we have a discord but you can find everything on the website fairlearn.org but that's just some info oh let's see i see is a question from marlene in the chat uh when studying data science ai is fairness something that's reflected in the curriculum um so currently um i mean ethics is definitely reflected in the master's program there's a specific course though it's more [Music] philosophical oriented rather than very practical so to speak but in the bachelor program at uh at the tue we have um this course well i teach the course responsible data science which is more of a more practical approach towards responsible uh responsible ai because i feel that if you and it's it's an uh elective actually so people can just choose it but last year we had like uh 100 students who were following the course so that's quite quite a nice number of people um because i personally i i really believe that if you teach ethics um just i mean just it's important to also teach ethics from the philosophy philosophical point of view obviously like it's very important but it kind of detaches like you're oh this is and this is uh deontology and this is utilitarianism like it's kind of detached it detaches it from what you're actually doing in your daily practice so this is why i always really like to um do a little bit more of this practical oriented work as well because like if you are making a very small decision of like how we're going to measure fairness like i mean it's not necessarily very small like it's it doesn't really help you to have this this big ethical framework in your mind right so that's um [Music] yeah you have to apply it somehow yes exactly and and by doing this i hope to be a little bit more of a bridge that's a little bit more practical so people can do both and don't harm the world no big goals we could start with small steps right yes exactly i have a question may i or sure sure gone um because it seems like wow like so do you know probably uh like what was the algorithm behind compass right uh um yeah that's a that's a fun one um so the uh the algorithm um [Music] that is behind compass is proprietary so they so you cannot actually look at the algorithm itself it's supposedly based on like over 100 features which are based on like uh i don't know uh like some questionnaire that people had to fill out um but some paper there was actually a paper by uh cynthia rudin who figured out that if you use if you create a model that only has two features uh age and prior um and prior things then it works just as well as compass oh wow and then you can actually consider like do we think it's okay to use age and to use prior offenses as uh things in the model rather than some proprietary bs algorithm but yeah what i i would think they would after all this uh how do you say scandal then they would force them to publish it i mean they do it with google with facebook so they would they would it would definitely do it with these people like ask them what did you do and basically i mean yeah i mean surely they had the i mean i don't i don't believe that they that they did like purposefully don't try to build something like this right no but just blindly not just blindly right like the bit blind and i mean it was in 2016 everybody who was still blind to this problem right so we cannot expect people to uh uh well some things yeah bias i mean so in this in this uh tutorial we only discussed the fairness part but um that's of course just very very tiny part of everything like if you look at the um child care benefits scandal for example in the netherlands what you saw is that like this algorithm was super easy like it was super like it could have been very transparent and easy to explain to people but it just used features that shouldn't have been used and that resulted in over scrutinizing some groups and then what actually went wrong was all the other things like oh it's a great example for my lectures so accountability went wrong uh transparency went wrong uh like every it was just yeah everything on top of each other um which is all related not so much to this specific technical details of this algorithm but how people used it how people defended it the culture of uh how it was used like it's um yeah so it's a really good real life example right of like how it can become like a weapon yeah yes exactly yeah i think we can have even more like there was like later scandal with zillow uh that like it's their prediction so the price of the houses oh yeah that's this and it's actually i think everything there boils down to the process who wants to be a responsibility for the output and how this output is used yeah i think it's mostly this um i just remember like one of the use cases from our boot camp that we did in the summer and it was just like predicting uh amount of based on the solar and based on the sun and wind a predicted amount of alternative energy that could be produced and then somebody just says oh come on what kind of like fairness questions could be attached to it you know it's like there is nothing you just have like households that's you know like just use energy and then just you want to predict how much energy could be generated so people if they want to cut off from the electrical grids they know how to balance you know like their usage of the energy but there are so much just for this like simple scenario but there's so much to add there imagine that there is like literally disparity between different regions so that's region with more let's say poor people or region with more let's say people with more income they how much energy they use like amount of square meters like there are so much to add to it and although if you do something and generate predictions right now it's immediately alterates the reality yeah exactly that's very important change their behavior so yeah i think there's so much things to it that's um probably we could just visit your lectures if it's possible yes please i'm not sure if it's uh if uh if i i'm sure if i can invite people to the actual lectures but if you are happen to be if i can give them in person and you happen to be a knight over you're always welcome to join great will yes we're gonna think about it but by the way by the way we still have the chance to be one of your wonderful tutorials because yes little teaser so first of all thanks a lot for this beautiful introduction to fairness um for those who are really really curious and interested to go much more in depth in these questions not just technically but as well um let's say in everything that's around the technical parts how oh the dog is here hello doggy so usually the dog is also interested in fairness so we're gonna do deep dive unless it's for cats right probably just somewhere in in in the vicinity right somewhere around them on the other side yes i'm being a bit unfair so next year you have an opportunity to see hilda again and we're gonna do deep dive into this matter um our next event eventually will happen in december it will be also really nice i assume that we we got biased you know with like talking to really smart people and because the next tutorial will be given by to you delve professor so i think we're going into the academia world so we try to balance the sample you know uh so for those who are interested how to communicate um about the the foundings and how the model works and everything around your engineering models so please feel welcome we wanted to have this event at the u delft on primal that you doubt unfortunately due to their strict restriction we decided to made it online so it will be online december and for those who first time watching us um just a quick recap so we are piloting amsterdam we are non-profit chapter we are part of global playlist and our chapter specifically focuses on workshops and tutorials on different levels and um we do this to make sure that everyone ever repeated pythonista despite the gender and any other biases that you can could think of has an access to specific materials so i think that's concluded our session right anything to add nancy from your site or hilda no just wanted to thank everyone who has been watching so far and i hope that you enjoyed it and if you have any questions you can always reach me on the socials so great i think then we could finalize our session good night everybody bye thank you for attending
Up Next

Explainable AI Explained: Introduction to XAI & Interpretable Models
@DeepFindr
89.1K views•2021-02-08

Secure Multiparty Computation (MPC): Foundations & Challenges
@SimonsInstitute
7.3K views•2015-05-28

Bypassing Tor Censorship: Bridges and Pluggable Transport Guide
@Coding_ForEveryone
397 views•2024-06-11
Neural Networks Explained: Math, Layers, and Learning Fundamentals
@3blue1brown
21.9M views•2017-10-05
Related Study Plans & Knowledge Roadmaps
Structured learning paths in Artificial Intelligence