The EU Emissions Trading System (EU ETS) is the world's largest and longest-running international carbon market, functioning as a cap-and-trade mechanism that sets annual limits on greenhouse gas emissions for major industrial sectors; companies receive or purchase emission allowances, which they can trade with each other, creating financial incentives to reduce emissions cost-effectively while gradually tightening the overall cap to achieve long-term environmental goals.
How the EU Emissions Trading System (EU ETS) Works
Added:Deep Dive
The basic economic concept of negative externalities, specifically how unregulated pollution represents a market failure.

Negative Externalities
155.1K
Negative externalities occur when the social costs of an economic activity exceed the private costs borne by buyers and sellers, creating market failure where the market produces too much output (Q1) compared to the socially optimal level (Q2); this can be corrected through taxation or property rights extensions that shift the marginal private cost curve upward, reducing the welfare loss to society.
Click to watch →

Negative externalities | Consumer and producer surplus | Microeconomics | Khan Academy
479.9K
Negative externalities occur when costs are imposed on society that aren't reflected in market prices. For plastic bags, these include environmental cleanup, wildlife harm, and littering. Quantifying externalities requires expert analysis—here estimated at $0.02 per bag. When externalities exist, the original equilibrium produces too much output because private marginal cost doesn't include social costs. Beyond the optimal quantity, marginal social cost exceeds marginal benefit, creating deadweight loss and potentially negative total surplus for society.
Click to watch →

The Air We Breathe
190.5K
In economics, pollution is defined as a negative externality - a situation where a market transaction has a negative impact on parties not involved in the transaction. Because the costs of pollution are not paid by those causing it, producers will produce more than they should, making the market price too low. The solution involves government intervention to correct this externality by aligning the costs faced by producers and consumers with the true societal costs.
Click to watch →
OpenStax Chapter12 Environmental Protection & Negative Externalities
112
Externalities are effects on third parties outside market transactions, either positive or negative. Pollution creates negative externalities where bystanders suffer costs not borne by producers. Social costs equal private costs plus external costs. When markets ignore external costs, supply curves shift leftward, causing overproduction beyond the socially efficient level. This represents market failure where resources are not allocated efficiently. For example, with a $100 externality per unit, the market produces 45,000 units while the efficient quantity is only 40,000.
Click to watch →
Negative Externalities and Market Failure I A Level and IB Economics
74.3K
Negative externalities occur when production or consumption imposes uncompensated costs on third parties, leading to market failure where the free market overproduces or overconsumes goods; diagrammatically, this is shown by the marginal social cost curve lying above the marginal private cost curve, creating a deadweight welfare loss (the green triangle area) between the free market equilibrium (Q1) and the socially optimal output level (Q2).
Click to watch →
Deep Dive
The conceptual difference between price-based instruments (like a carbon tax) and quantity-based instruments (like cap-and-trade) for environmental regulation.

Paul L. Joskow at Nobel Conference 43
256
Economists debate between price-based mechanisms (carbon taxes/emissions charges) and quantity-based mechanisms (cap-and-trade systems). Both approaches effectively internalize externalities by creating costs for emissions. Price-based systems guarantee revenue but allow emission quantities to vary; quantity-based systems guarantee emission reductions but allow prices to fluctuate. The choice depends on political feasibility and uncertainty about abatement costs.
Click to watch →
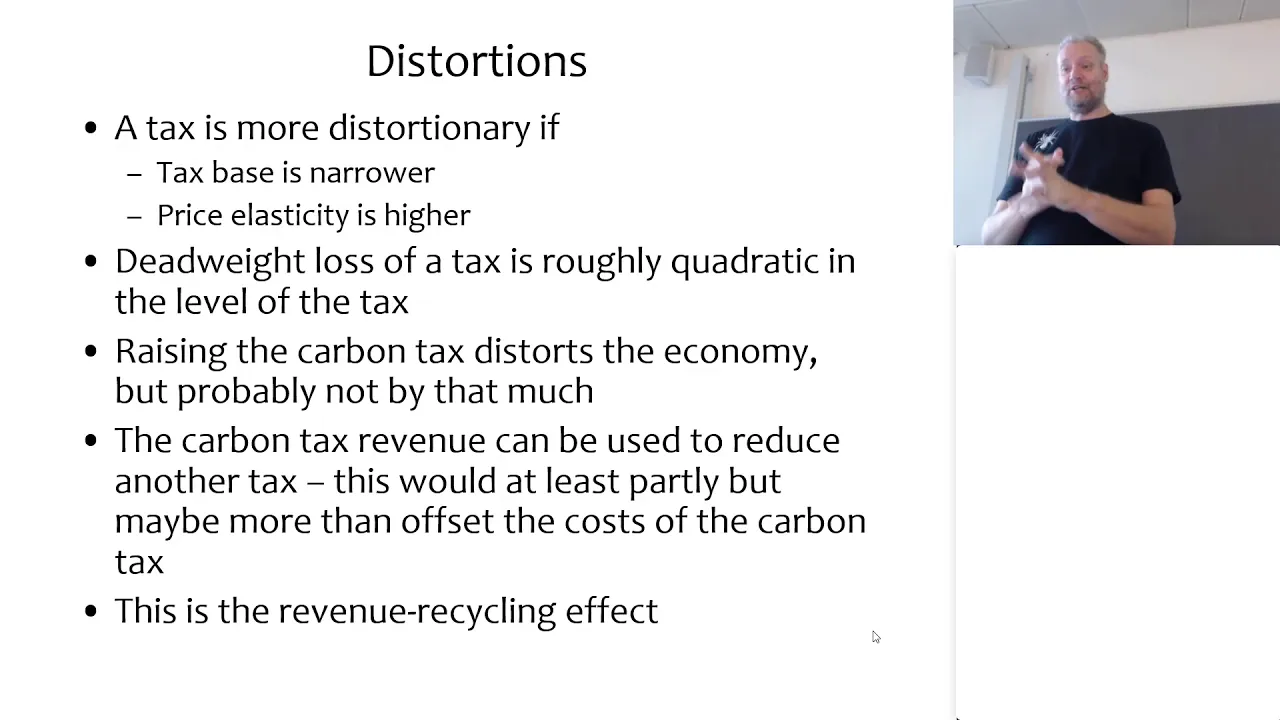
Abatement options and costs
126
Price instruments (taxes) provide cost certainty but environmental uncertainty—polluters know exactly what they'll pay but cannot predict final emissions levels. Quantity instruments (tradable permits) provide environmental certainty but cost uncertainty—regulators know exactly how much pollution will be reduced but cannot predict the final permit price or total economic costs. This trade-off between certainty types is fundamental to choosing between different regulatory approaches.
Click to watch →

Cap and Trade vs. Carbon Tax
32.5K
Both cap and trade and carbon tax are policy tools designed to address negative externalities from carbon emissions by aligning marginal private costs with marginal social costs; however, they differ fundamentally in their approach: carbon tax uses a price mechanism (setting a tax rate) to let the market determine the efficient quantity of emissions, while cap and trade uses a quantity mechanism (setting a fixed emissions cap) to let the market determine the efficient price, with each approach having distinct advantages and disadvantages depending on the context and implementation requirements.
Click to watch →
Public Economics and Finance - Market Failures and Insurance
5.7K
The choice between price-based (tax) and quantity-based (cap and trade) instruments depends on: (1) Heterogeneity of firms - more heterogeneous firms favor cap and trade because it allows efficient allocation across firms; (2) Importance of getting pollution quantity correct versus cost of reduction correct; (3) Uncertainty about abatement costs. A tax fixes the cost to industry but may result in different pollution levels than desired. A quantity regulation fixes pollution but may impose high costs on industry. The efficient choice depends on which uncertainty is larger.
Click to watch →
Policy Instruments 14 part 1
191
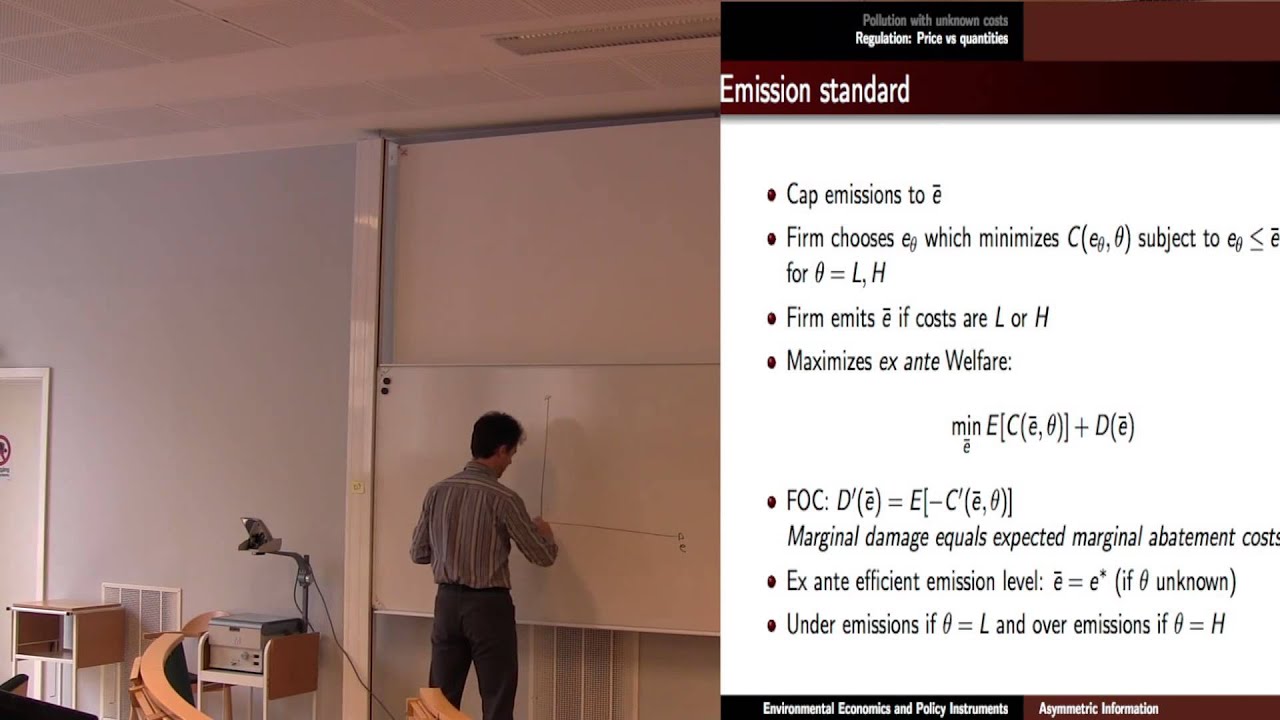
In environmental economics, when regulators face asymmetric information (not knowing firms' abatement costs), the choice between price instruments (emission taxes) and quantity instruments (emission caps) depends on the relative slopes of marginal abatement cost and marginal damage cost curves; with linear marginal abatement costs, the optimal tax rate equals the expected marginal damage at the ex-ante efficient emission level, while the optimal cap equates marginal damage to expected marginal abatement cost, with both instruments leading to welfare losses compared to the first-best solution but in opposite directions depending on whether actual abatement costs are higher or lower than expected.
Click to watch →
Deep Dive
Fundamental knowledge of climate change, greenhouse gas emissions (primarily carbon dioxide), and the international climate targets set by the Paris Agreement.

Webinar GHG Introduction
941
This comprehensive section covers the foundational concepts of greenhouse gas emissions and climate change. It explains the natural greenhouse effect where atmospheric gases trap heat to maintain Earth's habitable temperature, and how human activities have thickened this layer causing global warming. The section distinguishes between global warming (temperature increase) and climate change (broader long-term climate pattern alterations). It details the six major greenhouse gases identified by IPCC: CO2, CH4, N2O, HFCs, PFCs, and SF6, each with different global warming potential values. The section covers various emission sources including stationary sources (industrial facilities), mobile sources (transportation), process emissions, forestry and agriculture, solid waste, and fugitive emissions. It also covers international commitments including the Paris Agreement (2015) and Indonesia's NDC targets (29% domestic reduction, 41% with international support by 2030, net zero by 2060).
Click to watch →

Ladies Beyond Flying - 13th Aviation Women Panel - Focus Topic „Sustainability“
274
Greenhouse gases in the atmosphere are natural and sustain life by keeping the planet warm. Human activities release additional gases like carbon dioxide, methane, and nitrous oxide, which trap solar radiation and cause enhanced greenhouse effect. CO2 remains in the atmosphere for 50-200 years. The Paris Agreement is a legally binding international treaty with a five-year cycle of climate action, best practice sharing, and progress reviews. Key targets include limiting global temperature increase to less than 2°C and achieving net zero emissions by 2050. The agreement emphasizes building resilience to adapt to impacts already occurring.
Click to watch →

EnergyTalks-Fuel Cell Technologies
899
Climate change is driven by greenhouse gases (GHGs) including CO2 and methane, along with particulate matter like carbon black. CO2 has a particularly significant warming effect, with atmospheric levels reaching 390-405 ppm—unprecedented in 800,000 years. CO2 takes nearly 1,000 years to leave the atmosphere and accounts for 80% of global warming. The Paris Agreement (December 2015) brought together 195 nations to limit temperature rise to below 2°C, with nations committing to publish emissions and targets, reviewed every five years until achieving carbon neutrality by 2050. The agreement includes assistance for developing nations to adopt clean energy. The US has committed to an 80% emission reduction through an 'all-of-the-above' strategy addressing all energy sectors.
Click to watch →

「地球温暖化、気候変動、パリ協定」本当に理解してますか?聞いたことあるけど説明できない用語を学んだ直後に即アウトプットする企画「第一弾」温室効果ガスって何? #SDGs #気候変動 #地球温暖化
208
Greenhouse gases (GHGs) are atmospheric gases that trap heat and contribute to global warming, with the four main types being CO2 (76% of emissions, warming potential 1), Methane (16%, warming potential 25), Nitrous Oxide (6%, warming potential 300), and Fluorinated Gases (4%, warming potential 13,000). The Paris Agreement (2015) aims to limit global temperature rise to 2°C above pre-industrial levels by 2100 and achieve net-zero emissions by 2050. Major emitters include China (15 Gt CO2), USA (7 Gt), and UK (5 Gt), with per capita emissions highest in the USA (22 tons). Reduction strategies include reducing emissions through renewable energy and public transportation, and increasing absorption through forest conservation.
Click to watch →

9 -Climate change and carbon pricing
652
Climate change represents humanity's primary 21st-century challenge, evidenced by 0.85°C temperature rise since 1880, 19 cm sea level rise since 1901, and 4% annual Arctic ice shrinkage. Four major anthropogenic GHGs drive warming: CO2 (75%), methane (28× CO2 potency), nitrous oxide (310× CO2 potency), and halocarbons. Global emissions surged from 27 to 49 billion tons CO2e between 1970-2010. The IPCC Fifth Assessment Report established targets: limit warming to 1.5°C and achieve carbon neutrality by 2050. The Paris Agreement, ratified by 191 countries, mandates emission reduction targets with developed nations supporting developing nations financially.
Click to watch →
Prerequisite Knowledge
- Concept 01The basic economic concept of negative externalities, specifically how unregulated pollution represents a market failure.
- Concept 02The conceptual difference between price-based instruments (like a carbon tax) and quantity-based instruments (like cap-and-trade) for environmental regulation.
- Concept 03Fundamental knowledge of climate change, greenhouse gas emissions (primarily carbon dioxide), and the international climate targets set by the Paris Agreement.
Subsequent Learning
- Step 01The structural evolution of the EU ETS through its implementation phases (Phases 1 to 4) and current reforms under the 'Fit for 55' package.
- Step 02The Carbon Border Adjustment Mechanism (CBAM) and how the EU addresses 'carbon leakage' for domestic industries.
- Step 03A comparative analysis of the EU ETS with other major global emissions trading schemes, such as those in China, California, or South Korea.
- Step 04The role of financial intermediaries, carbon offsets, and market stability reserves in modern compliance carbon markets.
Carbon Causes
Trade Solution
Carbon Causes
0:03Playing Section
- 1
Climate change driven by greenhouse gas emissions from key sectors.
- 2
Higher CO2 levels trap more heat, inducing global warming.
- 3
Ripple effects threaten weather, food, water, and health.
Limitations of Market-Based Carbon Trading and the Case for Direct Taxation
Critics of the EU Emissions Trading System (EU ETS) argue that market-based cap-and-trade mechanisms are inherently flawed and insufficient for addressing climate change. A primary concern is price volatility; historically, the over-allocation of free permits led to a collapse in carbon prices, failing to incentivize long-term green investments. Additionally, opponents highlight the risk of "carbon leakage," where industries simply relocate emissions to countries with weaker regulations, resulting in no net global reduction. Critics from environmental justice perspectives argue that carbon trading commodifies pollution, allowing wealthy corporations to pay to pollute rather than mandating actual emission cuts at the source. Many economists and policy experts propose direct carbon taxation as a superior alternative. They argue a carbon tax provides price predictability, reduces administrative complexity, eliminates speculative market bubbles, and prevents lobbying for free permit allocations, thereby driving more reliable and equitable systemic decarbonization.
Deep Dive
The structural evolution of the EU ETS through its implementation phases (Phases 1 to 4) and current reforms under the 'Fit for 55' package.

第3回GX実現に向けたカーボンプライシング専門ワーキンググループ
991
The EU ETS (Emissions Trading System) has evolved through four phases since 2005: (1) Phase 1 (2005-2007) - Grandfathering approach with excessive allocation, leading to price collapse; (2) Phase 2 (2008-2012) - Continued over-allocation, cumulative excess of 17 billion tons; (3) Phase 3 (2013-2020) - Introduced auctioning for power sector, benchmarking for industry, and market stability mechanisms (MSR) to address over-allocation; (4) Phase 4 (2021-present) - Price recovery began with Fit for 55 policy package, prices fluctuating between 60-100 euros. The system covers approximately 40% of EU emissions with 1.3 billion tons of allowances.
Click to watch →
Konferencja Energia Przyszłości - nauka, biznes i samorząd w dialogu o transformacji. Część 1/4.
374
The Fit for 55 package represents a series of EU directives including the Energy Efficiency Directive, Energy Performance of Buildings Directive, Renewable Energy Directive (RED III), and the ETS. The ETS has evolved significantly since 2008, with free emission allowances for energy-intensive industries gradually decreasing, forcing companies to purchase more emission rights if they don't reduce emissions through technology upgrades. This evolution creates increasing pressure on energy-intensive industries to decarbonize.
Click to watch →
![Review of the EU ETS: 'Fit for 55' package [Policy Podcast]](https://i.ytimg.com/vi/fKQ6AGzklPk/maxresdefault.jpg)
Review of the EU ETS: 'Fit for 55' package [Policy Podcast]
2.9K
The EU Emissions Trading System (EU ETS), the world's largest cap-and-trade program covering 40% of EU emissions from power plants, factories, and aviation, is undergoing a major review under the Commission's 'Fit for 55' package to align with the EU's new 55% greenhouse gas reduction target by 2030. Key reforms include accelerating the annual reduction of emission allowances, reducing free allocation of permits to prevent carbon leakage, introducing a Carbon Border Adjustment Mechanism to equalize carbon costs between domestic and imported goods, extending coverage to maritime transport from 2023, and establishing separate emissions trading systems for road transport and buildings. The reforms aim to reduce emissions in covered sectors by 61% by 2030 compared to 2005 levels, with revenues directed toward climate action and a Social Climate Fund to support vulnerable households during the transition.
Click to watch →
![[REPLAY] Webinaire - Les évolutions règlementaires du marché carbone](https://i.ytimg.com/vi/-OquHVQjO-w/maxresdefault.jpg)
[REPLAY] Webinaire - Les évolutions règlementaires du marché carbone
659
The EU committed to carbon neutrality by 2050 through the Paris Agreement, operationalized via the Fit for 55 package. The 2021 European Climate Law established binding 55% reduction targets by 2030. The ETS reform raises reduction targets from 43% to 62% by 2030, expands sector coverage to include maritime transport (2023), and phases out free allowances by 2034. The Carbon Border Adjustment Mechanism (CBAM) will tax carbon-intensive imports from 2026-2034 to prevent carbon leakage. Additional instruments include the Taxonomy for sustainable investments (classifying activities across six environmental objectives) and the CSRD for corporate sustainability reporting. The CSRD requires enhanced climate obligations and common reporting standards for European companies, with France anticipating ambitious transposition exceeding EU minimums.
Click to watch →

WIELKIE OSZUSTWO? Ten nowy podatek zniszczy Polaków! #ets2
1.3K
The EU Emissions Trading System (ETS) faces significant reform proposals from the European Commission, including completing decarbonization, expanding coverage to power plants and aviation, and setting a 90% reduction target by 2040. The ETS represents a massive financial market worth nearly one billion dollars annually, with most trading institutions in tax havens lacking oversight. The Fit for 55 package, created during the pandemic without scientific justification, contains calculation errors and violates EU treaties by addressing energy mix and taxation—exclusive member state competencies. Poland challenged this through the European Court of Justice. The methane regulation demonstrates how political negotiation can modify regulatory frameworks, with member states retaining penalty-setting authority rather than facing EU-mandated fines.
Click to watch →
Deep Dive
The Carbon Border Adjustment Mechanism (CBAM) and how the EU addresses 'carbon leakage' for domestic industries.

탄소배출권 투자 제가 다~ 알려드릴께요 😎 #기후위기 #탄소배출권 #박기현 #sk증권
12.3K
The Carbon Border Adjustment Mechanism (CBAM) is an EU policy designed to prevent carbon leakage—companies relocating production to countries with weaker emission regulations to avoid compliance costs. Under CBAM, importers must purchase emission certificates for carbon-intensive imported goods, with prices based on EU ETS permit prices. This mechanism aims to maintain the EU's emission reduction efforts while preventing carbon leakage. The policy addresses the fundamental challenge of international climate policy: how to achieve emission reductions without creating unfair competitive disadvantages for domestic industries.
Click to watch →
10 Good Things That Will Change in 2025
77.3K
The EU's Carbon Border Adjustment Mechanism addresses 'carbon leakage' where companies shift production to countries with less stringent environmental rules. Under CBAM, importers of steel, cement, and electricity must register with national authorities and purchase CBAM certificates starting in 2026 to cover their imports' carbon footprint. During the transition period (2023-2025), businesses report emissions of imported goods to prepare for full implementation.
Click to watch →

Complete 1 Year CLIMATE CHANGE Related Topics in News | Environment | Udaan 500 | UPSC Prelims 2025
39.1K
The Carbon Border Adjustment Mechanism (CBAM) is a European Union policy that imposes carbon tariffs on imported goods from countries with weaker climate policies. The mechanism aims to prevent 'carbon leakage' where companies relocate production to countries with lax environmental regulations. It applies to energy-intensive industries including steel, cement, aluminum, and fertilizers. Under CBAM, imported goods are taxed based on their carbon content, creating a level playing field between EU and non-EU producers. The mechanism is part of the EU's Fit for 55 package, which aims to reduce emissions by 55% by 2030.
Click to watch →

US in Trumpa thupek chiah an nghak ta | Iran an zam lo, an inpuahchahna in a vawrtawp a thleng ta
47.6K
The Carbon Border Adjustment Mechanism (CBAM) is a policy tool designed to address carbon leakage by imposing carbon pricing on imported goods. This mechanism aims to ensure fair competition for domestic industries and support climate objectives.
Click to watch →

Energia e indústria: como descarbonizar sem perder competitividade | Transição energética
293
The EU Carbon Border Adjustment Mechanism (CBAM) equalizes carbon costs between EU and non-EU producers. It requires importers to pay for carbon intensity differences between products and EU benchmarks (currently 75-80€ per ton). Products below benchmarks receive credits, while those above must pay. Non-declared products face higher default thresholds. This mechanism aims to prevent carbon leakage while incentivizing domestic decarbonization, though critics argue it may function as protectionism.
Click to watch →
Deep Dive
A comparative analysis of the EU ETS with other major global emissions trading schemes, such as those in China, California, or South Korea.

All you wanted to know about Emissions Trading Schemes (ETS) work - a comprehensive introduction
116
By 2024, over 30 ETSs operate globally, covering 8 billion tons of CO2 annually (23% of global emissions). The EU ETS (2005) pioneered the market with prices of 50-100 per ton. The UK ETS is compatible but has experienced price divergence. China's ETS (2021) is the largest by volume (5 billion tons) but uses intensity-based caps covering only power, with prices of 6-10 per ton. South Korea's ETS (2015) covers 73% of national emissions comprehensively. California's ETS (85% coverage) includes transport through fuel distributors and features price floors, ceilings, and equity provisions. Forces driving emerging economy adoption include Paris Agreement commitments, EU's CBAM creating economic pressure, and recognition that carbon pricing can fund clean energy transitions. India's ETS (pilot 2026-2028) builds on the PAT mechanism. Brazil's ETS (2027) uniquely includes REDD+ forest credits. Indonesia's IDXCarbon (2023) is Southeast Asia's first mandatory scheme.
Click to watch →
Chiny trują środowisko bez ograniczeń. Za Zielony Ład zapłacimy wszyscy!
819
The EU ETS covers all CO2 emitters with a fixed cap, driving carbon prices to around 60 euros per ton. China's ETS only covers power plants with generous free allowances, resulting in prices around 10 euros. The EU's fixed cap creates scarcity and rising prices, while China's flexible cap with abundant free allowances creates minimal economic pressure. This fundamental design difference means the EU achieves environmental goals while China prioritizes economic growth.
Click to watch →

제4차 배출권거래제 시장 정보 포럼
3.2K
ETS markets are structured differently across jurisdictions: EU ETS operates through centralized exchanges, Korea ETS uses both exchange and OTC trading, and some jurisdictions use hybrid systems. Global ETS prices vary significantly: EU ETS at $84.89/ton, California at $12.30/ton, RGGI at $2.30/ton, Korea ETS at 27,500 won/ton. These differences reflect varying emission reduction targets, economic conditions, industrial structures, market maturity, and liquidity. The Kyoto Protocol established three market mechanisms: International Emissions Trading (IET) for trading between countries with emission reduction commitments, Clean Development Mechanism (CDM) for international projects generating certified emission reductions, and Joint Implementation (JI) for projects in countries with emission reduction commitments. These mechanisms allow countries to meet targets more cost-effectively by purchasing credits from other countries or projects.
Click to watch →

産業構造審議会イノベーション・環境分科会排出量取引制度小委員会 発電ベンチマーク検討ワーキンググループ(第2回)
1.1K
Three major international ETS systems demonstrate different approaches: EU ETS achieved full power sector decarbonization by 2013, Korea's ETS transitions from plant-specific to average benchmarks starting 2024, and China's ETS uses benchmark-based free allocation ratios. The working group identified six key discussion topics: scope of power generation benchmarks, boundary issues, power source scope, co-firing treatment, miscellaneous items, and allocation quantity calculation.
Click to watch →
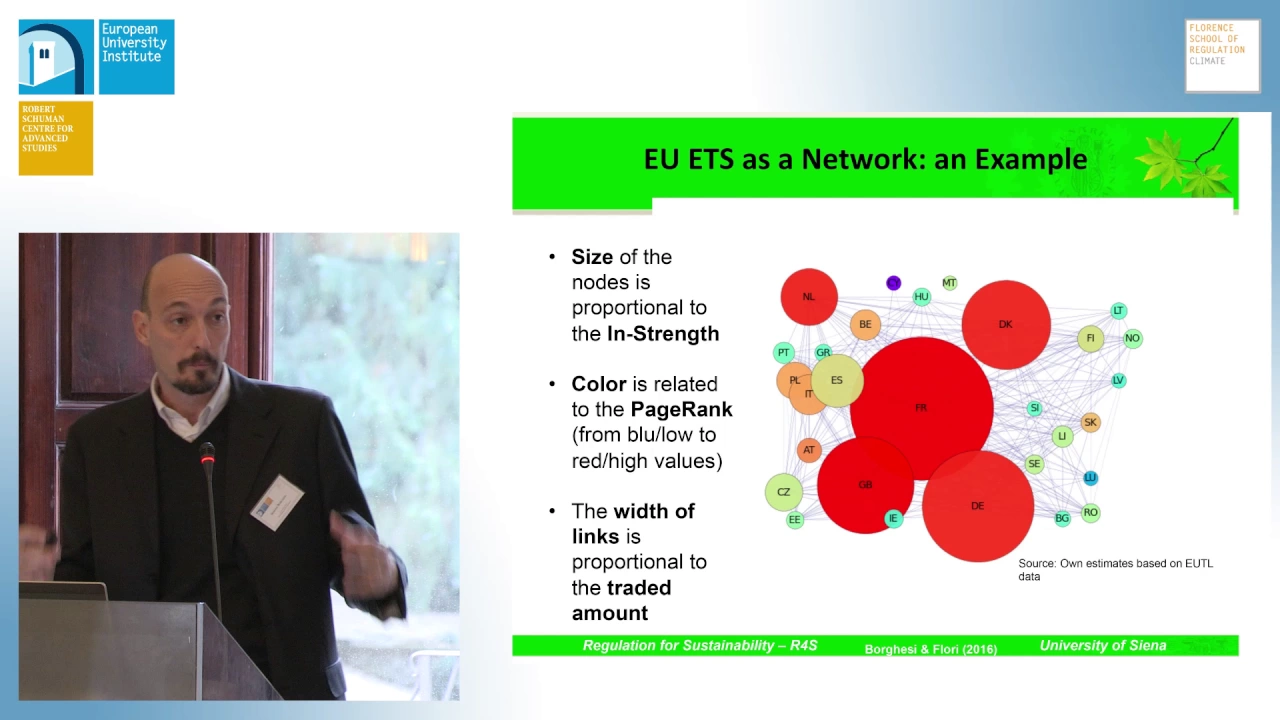
The EU ETS and its followers: connecting the dots | Simone Borghesi
216
Global emission trading systems share common features including targets, compliance periods, auctioning allocation, carbon credits, revenue channels, banking mechanisms, and sanctions. Differences exist in scope (GHG coverage), price floors/ceilings, and borrowing rules. Price floors proved crucial in California and Guangdong for preventing market collapse. Only one bilateral link exists (California-Quebec, 2013), which dramatically increased auction revenues. This 'honeymoon' effect demonstrates linking benefits through enhanced liquidity and compliance opportunities. However, linking requires sacrificing some system flexibility and carries risks of spreading negative effects or accountability issues if partners misbehave.
Click to watch →
Deep Dive
The role of financial intermediaries, carbon offsets, and market stability reserves in modern compliance carbon markets.
Voluntary Carbon Market - The Timeline (feat. Rene Velasquez)
1.2K
Carbon offset quality is ensured through multi-layer governance: registry requirements, annual verification by independent bodies, community engagement monitoring, and third-party rating agency assessments. Projects must demonstrate real, permanent, verifiable emission reductions. Additionality requires projects to be financially dependent on carbon financing—without it, projects wouldn't be viable. Market conditions change over time, affecting additionality status. Concerns about fraud are overstated by media sensationalism; the system includes robust checks preventing false claims. Carbon futures markets attract diverse participants: hedge funds managing risk exposure, airlines hedging price risk for carbon neutral commitments, commodity trading houses, investment banks, and oil majors. These financial intermediaries bridge physical spot markets with financial markets, enabling arbitrage opportunities and providing liquidity that supports corporate buyers seeking to lock in prices for future purchases.
Click to watch →
The Importance of Carbon Pricing - Mark Lewis (Head of Climate Research Andurand Capital Management)
701
The EU introduced the Market Stability Reserve (MSR) in 2017, acting as a 'central bank for carbon' by removing surplus allowances annually to ensure healthy supply-demand dynamics and higher prices. Carbon pricing allocates the scarce resource of atmospheric space for greenhouse gases, not carbon emissions themselves. The Paris Agreement's 1.5°C goal requires net zero global emissions by 2050, driving jurisdictions like the EU, UK, California, and Singapore to implement carbon pricing. The price signal enables investors to confidently invest in lower-carbon infrastructure, creating economic certainty for long-term capital decisions essential for the energy transition.
Click to watch →
Ariadne-Webinar zum EU-ETS: Was die (In)Stabilität für die Dekarbonisierung der Industrie bedeutet
236
The European Union's Emissions Trading System (ETS) Market Stability Reserve (MSR) uses the 'hamster' (stored emission allowances) as its primary indicator rather than actual market prices, which creates counterintuitive effects: when national policies like coal phase-outs reduce demand for allowances, the MSR paradoxically releases more allowances into the market, destabilizing prices and undermining the climate effectiveness of combined national and EU-level measures. This design flaw means that ambitious climate policies can actually reduce the overall climate protection impact of the ETS system.
Click to watch →

El mercado de derechos de emisiones de CO2. Conferencia de Nicolás García Torea.
8.3K
The EU ETS operates through an annual compliance cycle where companies must monitor emissions, develop approved monitoring plans, and surrender sufficient allowances by April 30. Early market inefficiency occurred when excess allowances drove prices from 30 to below 7.5 euros per tonne. The 2008 crisis reduced industrial activity, creating allowance banks. The EU responded by reducing auction percentages and introducing the Stability Reserve in 2019 to remove excess allowances from the market, preventing future savings accounts and maintaining market efficiency.
Click to watch →
What Are Compliance Carbon Markets?
792
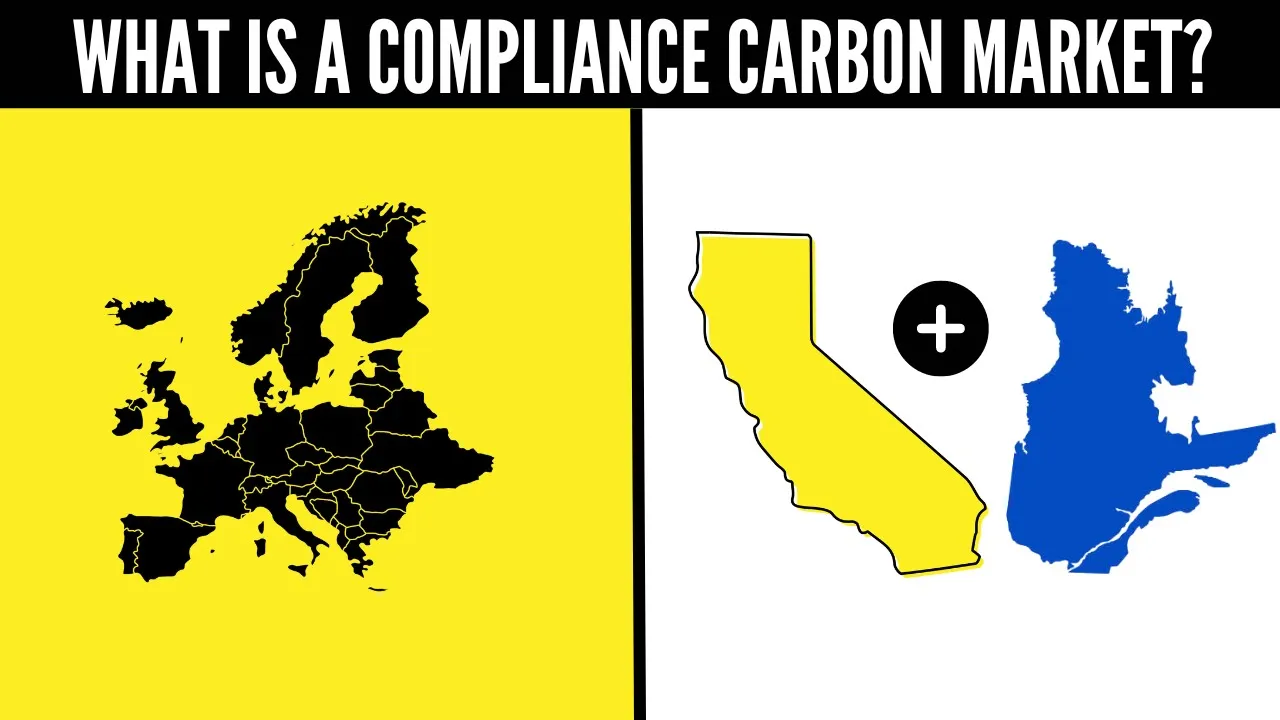
Compliance carbon markets, also known as emissions trading systems or cap-and-trade schemes, are government-established market mechanisms that set a maximum annual carbon emission limit (cap) for participating industries, with each ton of allowed emissions represented by a tradable carbon allowance; companies can buy, sell, or trade these allowances, creating financial incentives for emission reductions while allowing flexibility in how companies meet their obligations, with major investable markets including the EU Emissions Trading System ($900 billion), California ($20 billion), RGGI, and the UK system, each with different annual cap reduction rates ranging from 2.2% to 4%, and revenues often funding environmental projects and disadvantaged communities.
Click to watch →
Carbon Causes
Trade Solution
Carbon Causes
0:03- 1
Climate change driven by greenhouse gas emissions from key sectors.
- 2
Higher CO2 levels trap more heat, inducing global warming.
- 3
Ripple effects threaten weather, food, water, and health.
Limitations of Market-Based Carbon Trading and the Case for Direct Taxation
Critics of the EU Emissions Trading System (EU ETS) argue that market-based cap-and-trade mechanisms are inherently flawed and insufficient for addressing climate change. A primary concern is price volatility; historically, the over-allocation of free permits led to a collapse in carbon prices, failing to incentivize long-term green investments. Additionally, opponents highlight the risk of "carbon leakage," where industries simply relocate emissions to countries with weaker regulations, resulting in no net global reduction. Critics from environmental justice perspectives argue that carbon trading commodifies pollution, allowing wealthy corporations to pay to pollute rather than mandating actual emission cuts at the source. Many economists and policy experts propose direct carbon taxation as a superior alternative. They argue a carbon tax provides price predictability, reduces administrative complexity, eliminates speculative market bubbles, and prevents lobbying for free permit allocations, thereby driving more reliable and equitable systemic decarbonization.
The basic economic concept of negative externalities, specifically how unregulated pollution represents a market failure.
The conceptual difference between price-based instruments (like a carbon tax) and quantity-based instruments (like cap-and-trade) for environmental regulation.
Fundamental knowledge of climate change, greenhouse gas emissions (primarily carbon dioxide), and the international climate targets set by the Paris Agreement.
The structural evolution of the EU ETS through its implementation phases (Phases 1 to 4) and current reforms under the 'Fit for 55' package.
The Carbon Border Adjustment Mechanism (CBAM) and how the EU addresses 'carbon leakage' for domestic industries.
A comparative analysis of the EU ETS with other major global emissions trading schemes, such as those in China, California, or South Korea.
The role of financial intermediaries, carbon offsets, and market stability reserves in modern compliance carbon markets.
172.4K views1.2Klikes3:14@EuropeanCommissionOriginal Release: 2014-03-19
the earth's climate is changing and each one of us plays a role in the products We Buy in the electricity we use and in the energy that powers our businesses manufacturing agriculture transport waste power generation and other sectors release carbon dioxide and other gases into the atmosphere where they trap heat from the Sun but more carbon dioxide traps more of the Heat leading to global warming the result changes in our climate with ripple effects on weather food production Water Supplies human health and more but there are smart ways forward these include emissions trading which is the Cornerstone of the European Union strategy to tackle climate change headon for more than a decade the EU has worked to cut its greenhouse gas emissions with the help of the world's first largest and longest running International System for trading emissions allowances and the system keeps growing stronger in a nutshell the eu's emissions trading system or ETS creates a financial incentive for the biggest emitters to cut back how well since 2005 the ETS has set a cap on the total amount of greenhouse gases companies can emit each year and requires monitoring of these emissions a fixed number of allowances which are the currency of the carbon Market are issued and each year companies hold enough allowances to cover their emissions or face significant fines don't have enough cut your emissions or buy extra allowances from another emitter have extra allowances keep them for next year or sell them this flexibility ensures that emissions are cut where it costs the least to do so over time the cap is reduced fewer allowances are issued techniques to cut emissions are developed and total emissions drop companies have a financial incentive to cut their emissions or pay others to do so today this cap and trade system covers around half the eu's emissions and more than 3/4 of the international carbon Market interest is growing among business and government leaders around the world the eu's ETS proves that putting a price on carbon is possible and makes economic sense this flexible cost effective and business-friendly approach is helping the EU move faster toward a low carbon Greener future visit our website to find out more about how emissions trading Works to secure our future [Music]
Up Next
15:00
Tax Policy and Climate Change: A TEDx Perspective
@TEDx
8.6K views•2016-12-06

12:54
Triumph of Orthodoxy Icon: Byzantine Art & History Explained
@BenCallan
2.1K views•2024-08-06

9:49
FastAPI vs Flask vs Django: Choosing the Right Python Web Framework
@TechWithTim
302.5K views•2024-05-26

1:42
Game of Thrones Opening Credits: A Cinematic Analysis
@gameofthrones
46.3M views•2011-04-18
Related Study Plans & Knowledge Roadmaps
Structured learning paths in General & Interdisciplinary Studies
general-studies
Elevator Engineering: History, Physics & Cities
01From Hoists to Safety Brakes: The Dawn of Vertical Lift
02Hydraulic vs. Traction: The Engineering Physics of Elevators
03Modern Speed, Safety, and Algorithms
+ 2 more learning modules
12h5 modules
Explore Roadmap
general-studies
Rubber: Material Science, History & Geopolitics
01Origins of Natural Rubber & Mesoamerican History
02The Chemistry of Natural Rubber & Vulcanization
03The Geopolitics of the Rubber Boom & Colonization
+ 2 more learning modules
12h5 modules
Explore Roadmap
general-studies
Containerization: Evolution, Logistics & Trade
01Ancient Trade & Bulk Cargo: Amphorae to Barrels
02The Industrial Revolution & Cardboard Packaging
03The Containerization Revolution: Malcom McLean
+ 2 more learning modules
12h5 modules
Explore Roadmap
general-studies
Textile Tech: Evolution, Labor & Global Impact
01Pre-Industrial Textiles: Handloom & Cottage Industry
02Mechanization: The Spinning Jenny to the Power Loom
03The Factory System & Global Labor Transformation
+ 2 more learning modules
10h5 modules
Explore Roadmap