The three financial statements—balance sheet, income statement, and cash flow statement—each serve a unique purpose: the balance sheet tracks what a company owns and owes at a specific point in time (like personal net worth), the income statement tracks income and expenses over a period (like a monthly budget), and the cash flow statement tracks actual cash movements over time (like a checking account); together they provide investors with a complete view of a company's financial position.
Financial Statements Explained: A Beginner's Guide to Fundamentals
Added:Deep Dive
Basic terminology of business transactions, such as revenue, expenses, assets, liabilities, and equity.

Plus One Commerce - Accountancy | Introduction To Accounting | Xylem Plus One Commerce
85.3K
Assets are economic resources owned by a business (cash, buildings, land, machinery). Liabilities are obligations owed to others (loans, amounts to creditors). Revenue is total amount received from sales. Expenses are costs incurred to earn revenue (salaries, rent, purchases). Income is profit remaining after expenses. Debtors are persons who owe money to the business (assets), while creditors are persons to whom the business owes money (liabilities). These fundamental concepts form the basis of the accounting equation.
Click to watch →

Bookkeeping 101 | Bookkeeping Basics and Tips for Business Owners
69.2K
Assets are resources owned by the business with value, including cash, equipment (long-term assets), inventory, and accounts receivable (money owed by customers). Liabilities are debts owed to creditors including loans, credit cards, and vendor accounts payable. Equity represents the owner's value in the company, calculated as assets minus liabilities. These three components form the foundation of all financial statements and apply universally across all businesses regardless of size.
Click to watch →
Basic Accounting | Introduction to Basic Accounting | Book Keeping | Great Learning
5.6K
In accounting, there are commonly accepted terms and terminologies that everyone should know: (1) Revenue - the amount generated by the company from its core operations by selling a product or service in a given period of time; (2) Expense - the total cost incurred by the development of a particular product or service with no future benefits; (3) Asset - something that has a future economic benefit to the company; (4) Liability - something that the company has borrowed either from an individual or an organization; (5) Equity - the amount of capital invested by the promoter of the company representing ownership.
Click to watch →

Basic Accounting Terminology/class 11th accounts/by rahul commerce academy
563
A transaction is the exchange of goods and services between two or more people. Business transactions are categorized into five natures: Capital (money invested to start business), Liabilities (debts owed), Assets (resources owned), Expenses and Losses (money spent or lost), and Income and Gains (money earned). Capital refers to money or goods invested to start a business. Liabilities are debts or obligations that must be paid to creditors, suppliers, or lenders. Liabilities are classified into Current Liabilities (must be paid within one year) and Non-Current Liabilities (must be paid after one year). Assets are resources owned by a business with economic value. Assets are classified into Current Assets (used within one year or convertible to cash within one year) and Non-Current Assets (used for more than one year). Fixed Assets are further divided into Tangible Fixed Assets (physical items that can be seen and touched) and Intangible Fixed Assets (non-physical items with monetary value but no physical form).
Click to watch →

Plus One Commerce | Accountancy | chapter 1 Introduction to Accounting | Eduport
30.7K
Basic accounting terms include: (1) Entity - a person or organization that can conduct business transactions, (2) Business Transaction - a transaction that can be measured in monetary terms, (3) Asset - resources owned by the business used in operations, (4) Liability - obligations or debts owed by the business, (5) Capital - owner's investment in the business, (6) Drawings - money taken by the owner from the business, (7) Sales - revenue from selling goods, (8) Purchases - buying goods for resale, (9) Sales Return - goods returned by customers, (10) Purchase Return - goods returned to suppliers.
Click to watch →
Deep Dive
The foundational accounting equation: Assets = Liabilities + Owner's Equity.

The ACCOUNTING EQUATION For BEGINNERS
1.2M
The accounting equation is the fundamental principle that lies at the heart of accounting and serves as the foundation for the double-entry accounting system. The key principle states that what a business owns (assets) is always equal to what the business owes (liabilities and equity). This equation must always balance, meaning the total value of assets will always equal the combined total of liabilities and equity.
Click to watch →

Short Class Accounting Fundamental | MySkill
1.8K
The fundamental accounting equation is: Assets = Liabilities + Equity. This equation must always remain balanced in double-entry accounting. The equation forms the foundation for all accounting transactions and financial statements. When any transaction occurs, it must affect at least two accounts in a way that maintains this balance. This equation is the basis for the balance sheet and underlies all accounting recording and reporting.
Click to watch →

Elementos de Contabilidad - Clase 2: Contabilidad Básica 🧑🏫
1.3K
The accounting equation (Assets = Liabilities + Net Equity) is the fundamental mathematical equality underlying all accounting systems. Assets represent resources owned by the company, Liabilities represent debts and obligations, and Net Equity consists of Capital (owner contributions) and Results (business profits/losses). This equation, created by Luca Pacioli in the Middle Ages, is unbreakable and forms the basis for all accounting records. The equation can be expressed dynamically as Assets + Losses = Liabilities + Capital + Gains to avoid negative numbers in journal entries.
Click to watch →

Fundamentos de contabilidad
9.5K
The fundamental accounting equation states that Assets (activo) equals Liabilities (pasivo) plus Capital (capital contable). This equation forms the basis for all accounting records and financial reporting. The equation must always remain balanced, meaning that the total value of what a business owns (assets) must equal the total value of what it owes (liabilities) plus the owner's investment (capital).
Click to watch →

اساسيات المحاسبه ( مبادئ المحاسبه )
3.4K
The fundamental accounting equation states that Assets equal Liabilities plus Equity (Assets = Liabilities + Equity). This equation forms the foundation of all accounting records and represents the basic relationship between what a company owns, what it owes, and what belongs to the owners.
Click to watch →
Deep Dive
The conceptual difference between cash basis and accrual basis accounting.

Cash to Accrual Basis of Accounting
66.5K
The cash basis of accounting recognizes revenue when cash is received and expenses when cash is paid, regardless of when the transaction occurred. In contrast, the accrual basis recognizes revenue when services are rendered or goods are sold, and expenses when incurred, regardless of cash receipt or payment. These fundamental differences impact how revenues and expenses are timed in financial statements. The accrual basis is required by accounting standards and conceptual frameworks, while cash basis is simpler but less accurate for measuring true financial performance.
Click to watch →

Contabilidade - Semana de Manutenção para a Área Fiscal - Prof. Silvio Sande
3.8K
The difference between cash basis and accrual basis accounting lies in when revenues and expenses are recognized. Under cash basis, revenues and expenses are recorded only when cash is received or paid. Under accrual basis, revenues and expenses are recorded when the economic event occurs (facto gerador), regardless of cash flow. In the example provided: Cash basis showed a loss of 30,000 (only cash transactions considered), while accrual basis showed a profit of 50,000 (recognizing revenue from sales and expenses when they occurred). The difference of 80,000 represents the timing difference between cash and accrual recognition.
Click to watch →

CASH BASIS & ACCRUAL BASIS ONE SHOT | FINACIAL ACCOUNTING I | SEMESTER 1 CCF BCOM
182
The fundamental difference between cash basis and accrual basis accounting lies in the timing of transaction recording. Cash basis records transactions when cash actually moves (irrespective of the year), while accrual basis records transactions only when they belong to the current accounting year. Under cash basis, the year of the transaction is irrelevant; under accrual basis, only current year transactions are considered.
Click to watch →

CU BCOM SEMESTER 1 | Financial Accounting | DEMO CLASS 1 | #calcuttauniversity #ccf
112
This section explains the key differences between cash basis and accrual basis accounting. In cash basis, only cash transactions are recorded, and no adjustment is made for outstanding or prepaid items. In accrual basis, both cash and credit transactions are recorded, and adjustments are made for outstanding and prepaid items. Under cash basis, income and expenses are recorded only when cash is received or paid. Under accrual basis, income and expenses are recorded when incurred, regardless of cash movement. Operating result can be found by matching cash expenses with cash income (cash profit) or by matching expenses incurred with income earned (true profit). To get true profit of an organization, accrual basis must be followed.
Click to watch →

Cash Basis or Accrual Basis? | Accounting How To | How to Pass Accounting Class
832
This section explains the fundamental differences between cash basis and accrual basis accounting. Cash basis recognizes revenue when cash is received and expenses when cash is paid, providing a clear view of cash inflows and outflows. Accrual basis recognizes revenue when earned and expenses when incurred, regardless of cash movement. The section uses a retail store example where inventory is purchased in November, sold in December, paid for in January, and customer payment received in February, demonstrating how timing differences create distinct financial reporting outcomes.
Click to watch →
Deep Dive
The overall purpose of financial reporting and who the primary users of financial data are.

Intermediate Financial Accounting 1 Exit Exam Questions & Answer2018 መታየት ያለበት ጥያቂ@genanewtutorials
12.6K
The primary purpose of financial reporting is to provide information about financial position, performance, and cash flows to users making economic decisions. Primary users include investors (decisions about equity), lenders and creditors (decisions about lending), and other stakeholders. General purpose financial statements are prepared for external users not specific to the entity, in accordance with frameworks like IFRS.
Click to watch →

Conceptual Framework for Financial Reporting 2018 (Chapter 1 to 5)
83K
The objective of general purpose financial reporting is to provide financial information about the reporting entity useful for users in making decisions. Primary users are existing and potential investors, lenders, and other creditors who make decisions about buying, selling, and holding equity and debt instruments, as well as providing or settling loans. Their information needs include knowledge of economic resources (assets), claims (liabilities and equity), changes in resources and claims, and management's effectiveness. Other users include management, government agencies, regulators, customers, and employees. Financial reports cannot provide information about general economic conditions, political events, industry outlook, or the real value of the entity due to the use of estimates.
Click to watch →
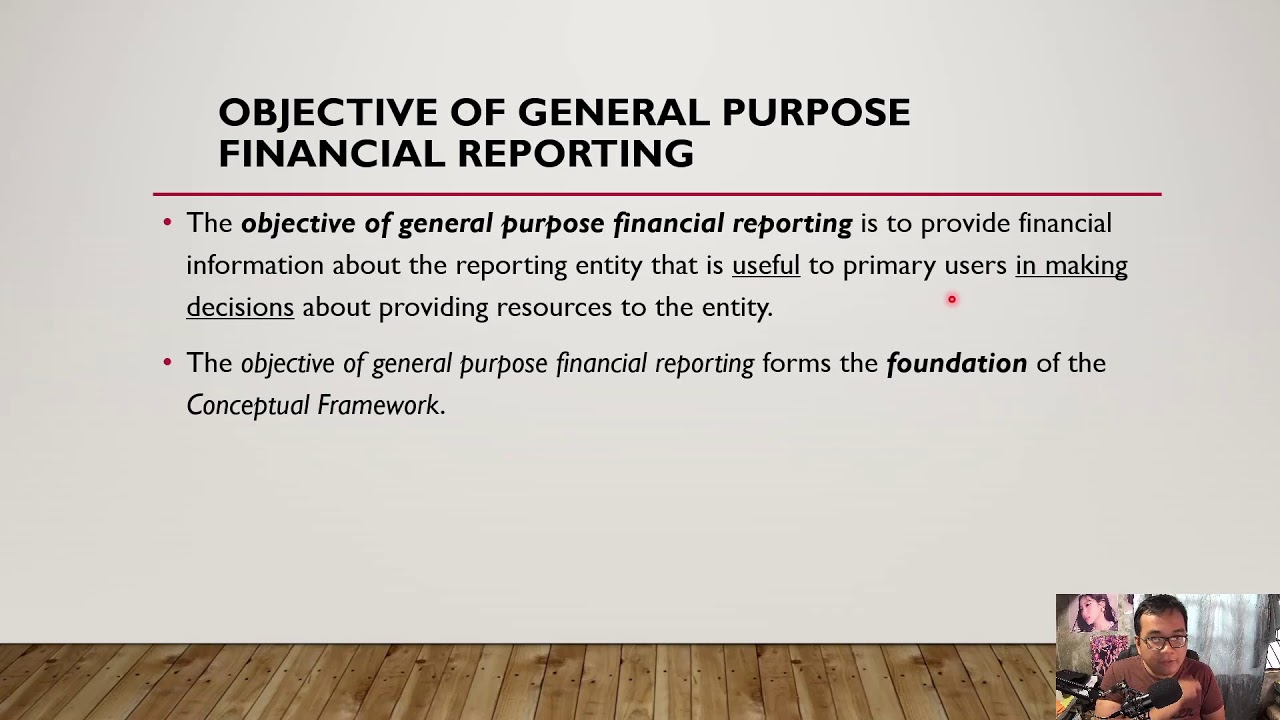
CFAS (Lecture Vid #2) - Conceptual Framework for Financial Reporting
41.7K
The objective of general purpose financial reporting is to provide financial information about the reporting entity that is useful to primary users in making decisions about providing resources. Primary users are those who cannot demand information directly from entities, including investors, creditors, and other stakeholders. General purpose financial statements meet the common needs of these users by providing standardized financial information that enables informed decision-making about resource allocation.
Click to watch →

CR - Conceptual Framework
154
The objective of general purpose financial reporting is to provide financial information about the reporting entity useful to existing and potential investors, lenders, and other creditors in making decisions about providing resources. This information is prepared using the accrual basis of accounting, meaning income is recognized when earned, not when received, and expenses when incurred, not when paid. Financial information includes economic resources (assets), claims against the entity (liabilities), and changes in these (income and expenses). The three primary users are investors (shareholders), lenders (banks/individuals who grant loans), and other creditors (suppliers), who are the providers of risk capital.
Click to watch →

دورة محاسبة مالية بالانجليزي Financial Accounting : الاطار النظري Conceptual Framework
30.7K
The primary objective of financial reporting is to provide financial information that helps users make decisions about whether to provide resources to the company. The main users of this information include: (1) Current and Potential Investors - individuals or entities who provide capital through equity investments; (2) Lenders and Creditors - entities that provide loans or credit; (3) Existing Creditors - parties to whom the company owes obligations. This information is delivered through general-purpose financial statements that serve all users rather than being customized for individual parties.
Click to watch →
Prerequisite Knowledge
- Concept 01Basic terminology of business transactions, such as revenue, expenses, assets, liabilities, and equity.
- Concept 02The foundational accounting equation: Assets = Liabilities + Owner's Equity.
- Concept 03The conceptual difference between cash basis and accrual basis accounting.
- Concept 04The overall purpose of financial reporting and who the primary users of financial data are.
Subsequent Learning
- Step 01Financial ratio analysis, including liquidity, profitability, and solvency ratios (e.g., ROE, Debt-to-Equity, Current Ratio).
- Step 02Horizontal and vertical analysis (common-size statements) to evaluate financial trends over time.
- Step 03How to read and interpret actual corporate annual reports (Form 10-K), including financial footnotes and the MD&A section.
- Step 04Introduction to financial forecasting and valuation techniques, such as Discounted Cash Flow (DCF) modeling.
Three statements
Balance sheet
Income statement
Cash flow statement
Combined insight
Three statements
0:00Playing Section
- 1
Identifies the three core financial statements.
- 2
Explains each has a unique purpose and timeframe.
- 3
Distinguishes between accrual and cash accounting.
The Intangible Capital and Qualitative Value Critique
While traditional financial statements are foundational, critics argue they are increasingly inadequate for evaluating modern businesses. Standard accounting frameworks (like GAAP and IFRS) are backward-looking and struggle to measure 'intangible assets'—such as intellectual property, brand equity, human capital, and proprietary algorithms—which drive the modern digital and knowledge-based economy. Furthermore, traditional financial analysis often ignores critical qualitative factors, such as Environmental, Social, and Governance (ESG) metrics, customer lifetime value, and overall business model adaptability. Consequently, relying solely on standard financial statements can lead to an incomplete or misleading assessment of a company's true intrinsic value and future growth potential, prompting modern analysts to advocate for holistic, non-financial, and forward-looking evaluation methods.
Deep Dive
Financial ratio analysis, including liquidity, profitability, and solvency ratios (e.g., ROE, Debt-to-Equity, Current Ratio).

Learn AI for Finance | Step by Step Ratio Analysis Demo | The Valuation School
34.2K
Profitability ratios measure earnings performance: (1) Return on Equity (ROE) = Net Profit / Total Equity, (2) Return on Assets (ROA) = Net Profit / Total Assets, (3) Net Profit Margin = Net Profit / Sales. Solvency ratios measure long-term financial stability: (1) Debt-to-Equity Ratio = Debt / Total Capital, (2) Interest Coverage Ratio = EBIT / Interest & Debt.
Click to watch →

MANAJEMEN KEUANGAN || REVIEW || P-WBI
106
Liquidity ratios measure ability to meet short-term obligations: Current Ratio = Current Assets / Current Liabilities, Quick Ratio = (Current Assets - Inventory) / Current Liabilities, Cash Ratio = Cash / Current Liabilities. Solvency ratios measure long-term financial health: Debt Ratio = Total Liabilities / Total Assets, Debt-to-Equity Ratio = Total Liabilities / Total Equity. Profitability ratios measure earnings efficiency: Gross Profit Margin, Operating Margin, Net Profit Margin, ROA = Net Income / Total Assets, ROE = Net Income / Shareholder's Equity.
Click to watch →

Ratio Analysis | Revision | Class 12th Accounts | Part 15 |#118| Corporate Accounting
17.5K
Financial ratio analysis evaluates company performance through key metrics. Liquidity ratios measure short-term obligation fulfillment: Working Capital equals Current Assets minus Current Liabilities. The Current Ratio (Current Assets/Current Liabilities) assesses solvency. The Quick Ratio (Quick Assets/Current Liabilities) excludes inventory for stricter assessment. Long-term solvency ratios assess commitment fulfillment: Debt-Equity Ratio shows borrowed funds proportion. Equity Ratio indicates shareholder financing percentage. Debt Ratio shows debt financing percentage. The Interest Coverage Ratio (EBIT/Interest) measures debt servicing capacity. EBIT can be calculated from EAT using: EBIT = EAT / (1 - Tax Rate) + Interest. Profitability ratios measure earnings generation: Gross Profit equals Sales minus COGS. Operating Profit equals Gross Profit minus Operating Expenses. Net Profit equals Operating Profit minus Non-operating Expenses plus Non-operating Incomes. These ratios assess cost management efficiency and profitability.
Click to watch →

CMA Foundation – Fundamentals of Accounting | CMA, CAT – MCQ Practice & Solutions
4.6K
This section covers comprehensive ratio analysis: (1) Current Ratio = Current Assets / Current Liabilities (ideal 2:1); (2) Quick Ratio (Acid Test) = Quick Assets / Current Liabilities (ideal 1:1), where Quick Assets = Current Assets minus Inventory and Prepaid Expenses; (3) Working Capital = Current Assets minus Current Liabilities; (4) Long-term Solvency Ratio = Long-term Assets / Long-term Liabilities; (5) Price-Earnings Ratio = Market Price per Share / Earnings per Share; (6) Profitability ratios include Gross Profit Ratio, Net Profit Ratio, Return on Capital Employed, and Return on Equity; (7) Debt-Equity Ratio = Total Debt / Shareholder's Equity (lower indicates less debt reliance); (8) Average Stock = (Opening Stock + Closing Stock) / 2; (9) Ratio Analysis examines relationships between financial statement items to assess company performance.
Click to watch →

ESP FINANCE : (SOME) RATIOS EXPLAINED
103
This comprehensive overview covers three essential financial ratios used to evaluate company performance. The Current Ratio (Current Assets/Current Liabilities) measures liquidity, with 1.2-2 being healthy and ratios above 2 potentially indicating inefficient asset utilization. The Profit Margin Ratio ((Revenue-Expenses)/Revenue) indicates profitability, with 5-10% typically considered good. The Return on Equity (Net Income/Shareholders' Equity) measures how effectively equity generates profits, with 15-25% being favorable. The Debt to Equity Ratio (Total Liabilities/Shareholders' Equity) assesses financial risk, with 1.0-1.5 being optimal and ratios above 2.0 indicating high risk. Together, these ratios provide a complete picture of a company's financial health across liquidity, profitability, and solvency dimensions.
Click to watch →
Deep Dive
Horizontal and vertical analysis (common-size statements) to evaluate financial trends over time.

ACC501 Lesson 7 Board Practice Cashflow Statement Short Lecture
1.9K
Common Size Analysis has two types: Vertical Analysis (Common Size) expresses each item as percentage of a base - Balance Sheet uses Total Assets as 100%, Income Statement uses Net Sales as 100%. Horizontal Analysis compares items across periods with one year as base (100%). For Balance Sheet: divide each item by Total Assets × 100. For Income Statement: divide each item by Net Sales × 100. This enables trend analysis and cross-company comparison.
Click to watch →

CMA FINAL | P20A: SPM&BV | REGULAR BATCH DEC -2026 | CLASS -2 | DAY 2 | BY CA MANINDER SINGH SIR
156
Comparative statements (horizontal analysis) depict financial position and profits at different periods (previous year, current year). This analysis is useful only when the same accounting principles are followed every year. Common size statements (vertical analysis) consider the percentage of various elements of financial statements. In common size balance sheet, each asset is expressed as a percentage of total assets, and each liability as a percentage of total liabilities.
Click to watch →
B.I.K. | Partnership #3 | Accounts 12 | Koi Fail Nahi Hoga
97.5K
Horizontal Analysis (also called Dynamic Analysis) compares the same items across multiple years to identify trends and changes over time. Vertical Analysis (also called Static Analysis) analyzes a single year's data by expressing each item as a percentage of a base figure. Comparative Statements are examples of Horizontal Analysis, while Common Size Statements are examples of Vertical Analysis.
Click to watch →
Financial Statements, Analysis & Tools | Common Size & Comparative Statements | Class 12 Accounts
514
Horizontal Analysis (Comparative Statements) compares financial data across multiple years (same company, different periods). Vertical Analysis (Common Size Statements) analyzes relationships within a single year's financial statement (different items, same period). Horizontal Analysis shows trends over time, while Vertical Analysis shows the relative importance of different items within a period.
Click to watch →

Plus Two Accountnacy AFS Full Chapter Revision | Eduport Plus Two
2.9K
Common Size Statement is also known as Vertical Analysis because it analyzes items within a single period. Horizontal Analysis (also called Comparative Analysis) compares the same items across different periods to identify trends and changes over time.
Click to watch →
Deep Dive
How to read and interpret actual corporate annual reports (Form 10-K), including financial footnotes and the MD&A section.

How To Read An Annual Report (10-K)
151.2K
When analyzing an annual report (10-K), focus on key sections including the Business section (Item 1) for understanding operations, Risk Factors for identifying investment risks, Management's Discussion and Analysis (MD&A) for understanding performance drivers and future strategies, and the official financial statements (income statement, balance sheet, and cash flow statement) for extracting core financial data; read the Business and Risk Factors sections once, while reading MD&A and financial statements across multiple years to track trends and assess company fundamentals over time.
Click to watch →

AULA 02 - WORKSHOP ENGLISH FOR FINANCE - Inglês para Contabilidade, Impostos e Finanças
362
To access annual reports of public companies, search for the company name plus 'annual report' or 'form 10K'. The SEC filings page contains official documents; Form 10K is the annual report for American companies (CVM is the Brazilian equivalent). Form 10K includes multiple sections beyond financial statements: business overview, risk factors, and MD&A. Financial statements are in Item 8, containing auditor's report, consolidated statements of cash flow, operations, comprehensive income, and balance sheets. Numbers are presented in millions, requiring addition of six zeros for accurate interpretation.
Click to watch →

How to read 10k / 10q reports like a pro
4K
MD&A is one of the two most important sections in a 10K report. It provides management's perspective on the company's financial condition and results of operations. While management naturally presents information favorably, this section offers valuable context for interpreting financial statements. Investors should read it with critical thinking, using it to complement rather than accept at face value.
Click to watch →

How To Read A 10-K
4.9K
The Management Discussion and Analysis (MD&A) section is located toward the middle or end of a 10-K document. This section is considered critical for understanding a company because it describes exactly how management performed over the last year and outlines their plans going forward. The section goes into detailed discussion about specific parts of the business, providing valuable insight into the management team's perspective and helping investors understand where the business might be heading in the future.
Click to watch →

Annual report MD&A
7.8K
The MD&A section in a company's 10-K filing typically includes eight main sections: overview, results of operations, performance by business segment, performance by geographic area, critical accounting estimates, new accounting pronouncements, financial condition and liquidity, and financial instruments. The length varies significantly - 3M's 2017 MD&A was 35 pages, Apple's was 14 pages, and GE's was 90 pages. This section provides management's narrative perspective on financial statements, explaining what happened, why it happened, and what to expect going forward. It serves as a bridge between the quantitative financial data and qualitative business context.
Click to watch →
Deep Dive
Introduction to financial forecasting and valuation techniques, such as Discounted Cash Flow (DCF) modeling.
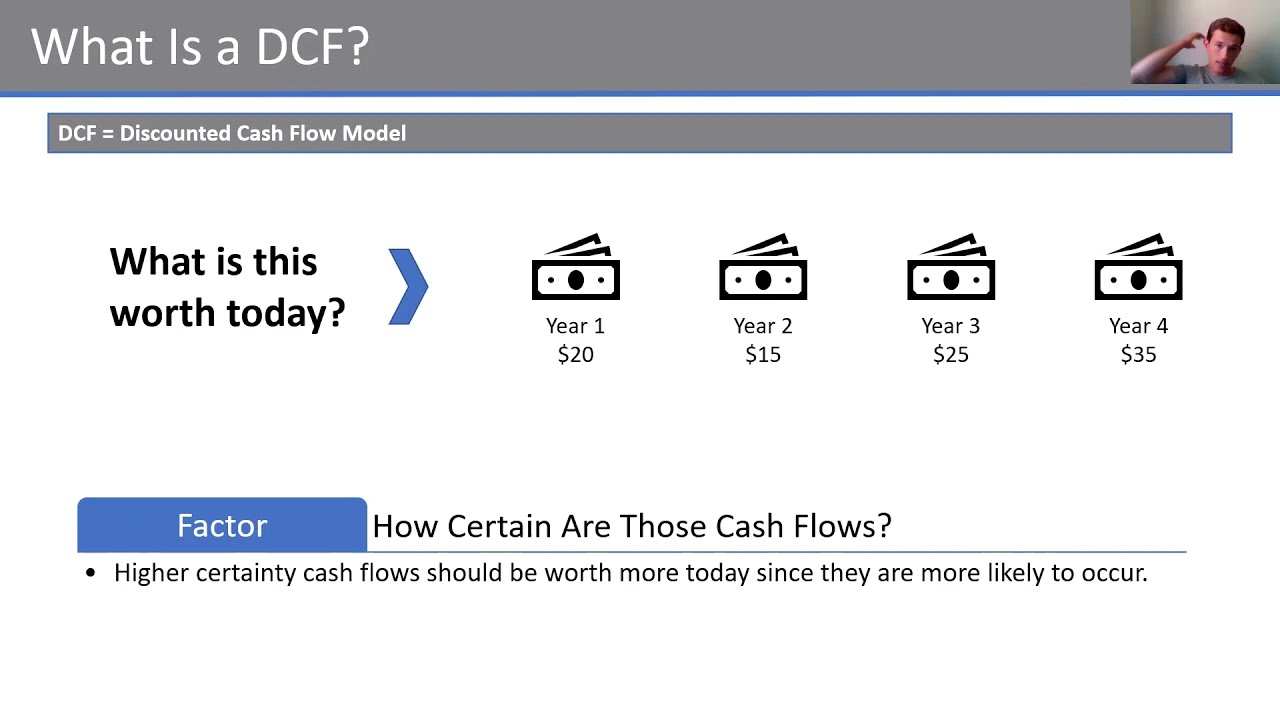
Introduction to DCF Modeling
194
Discounted Cash Flow (DCF) modeling is a valuation method that determines the fundamental value of a business by calculating the present value of its future cash flows, accounting for the time value of money through a discount rate that reflects risk-free rates and risk premiums. There are two main types: Free Cash Flow to Firm (FCFF) values enterprise value using Weighted Average Cost of Capital (WACC), while Free Cash Flow to Equity (FCFE) values equity directly using the cost of equity. The model involves projecting financial statements, calculating appropriate cash flows, applying discount factors, and converting enterprise value to equity value by subtracting debt and adding cash, ultimately yielding a per-share price for investment decisions.
Click to watch →
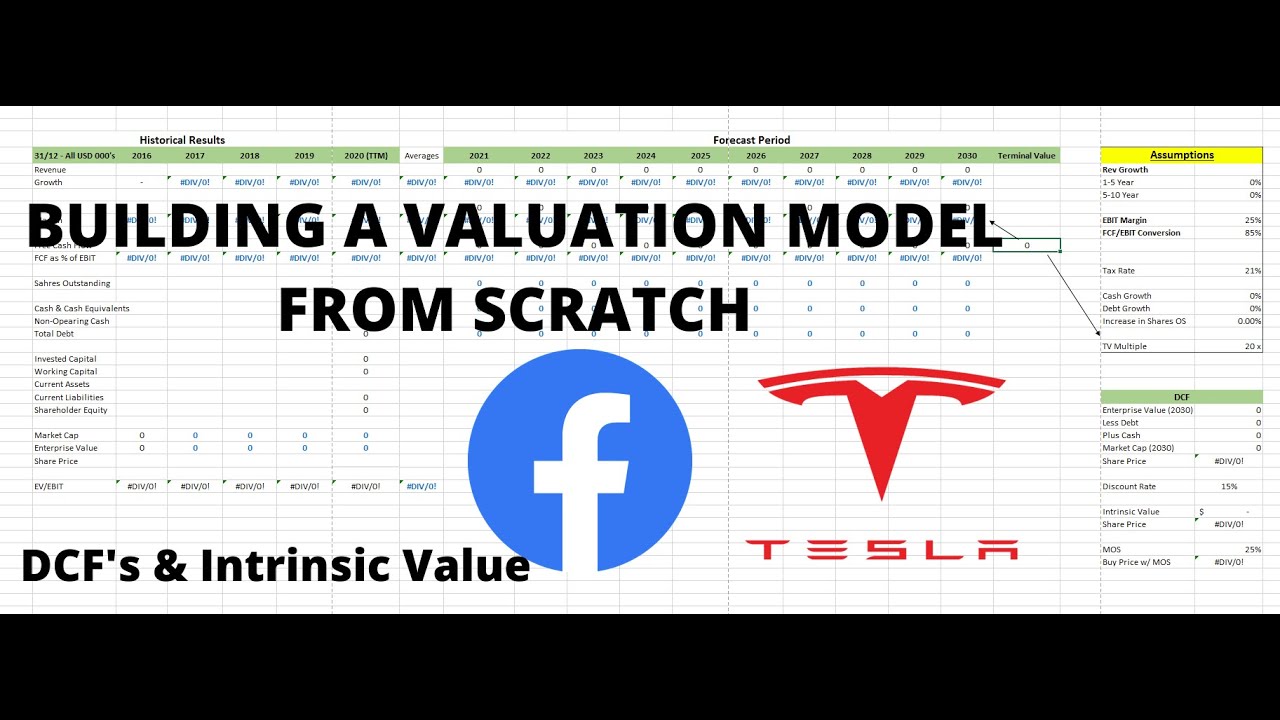
Discounted Cash Flow (DCF): Building a Facebook & Tesla Valuation Model from Scratch - Pt.1 (FB)
21.8K
A DCF (Discounted Cash Flow) model calculates the present value of all future cash flows a business will produce. The model discounts future cash flows back to present value using a discount rate, based on the time value of money principle that a dollar today is worth more than a dollar tomorrow. There are two main approaches: the academic approach uses perpetual growth rates and WACC to prevent valuation flaws, while the institutional approach uses required rate of return and makes assumptions based on real data. Both approaches have their merits and understanding both is essential for effective valuation.
Click to watch →
DCF Valuation Modeling: From Theory to Practice | Course Module
3.6K
Discounted Cash Flow (DCF) valuation is a cornerstone financial technique that determines business value by forecasting expected future cash flows and discounting them back to their present value using the time value of money principle; the model requires pairing unlevered free cash flow (UFCF) with the weighted average cost of capital (WACC) to maintain consistency between cash flows available to all capital providers and the cost of capital from all providers, with the two-stage forecasting structure consisting of a discrete forecast period (typically 5 years) showing above-economic growth followed by a terminal value calculation using the growing perpetuity formula to value perpetual cash flows indefinitely.
Click to watch →

Discounted Cash Flow (DCF) Model – CH 3 Investment Banking Valuation Rosenbaum
66K
The Discounted Cash Flow (DCF) model is a fundamental valuation methodology that determines a company's intrinsic value by projecting its unlevered free cash flows over an explicit forecast period (typically 5 years) and calculating the terminal value beyond this period, which together constitute approximately two-thirds of the total valuation; these projected cash flows are then discounted to present value using the Weighted Average Cost of Capital (WACC), which incorporates the cost of debt (after-tax) and cost of equity (calculated via CAPM), with the final enterprise value converted to equity value by adjusting for net debt and cash balances.
Click to watch →

İNDİRGENMİŞ NAKİT AKIMLARI MODELİ- 4 GELECEK DEĞERLERİN HESAPLANMASI | Hisse Değerleme Modelleri #13
6.4K
The Discounted Cash Flow (DCF) model is a fundamental stock valuation method that projects future cash flows and discounts them to present value. The core process involves forecasting future free cash flows, applying an appropriate discount rate, and calculating firm value from the present value of these cash flows. Two primary free cash flow measures are used: Free Cash Flow to Firm (FCFF) = EBIT × (1 - Tax Rate) + Depreciation & Amortization - Change in Net Operating Working Capital - Capital Expenditures, representing cash available to all capital providers. Free Cash Flow to Equity (FCFE) = Net Income + Depreciation & Amortization + Net Borrowing - Capital Expenditures - Change in Net Operating Working Capital, representing cash available to equity holders. Net Operating Working Capital (NOWC) = Operating Current Assets - Operating Current Liabilities, capturing capital required for day-to-day operations. Three primary forecasting methods exist: the Sales Growth Rate Method projects future sales using growth rates, then derives other items as percentages of sales; the Historical Growth Rate Method applies historical growth rates to the most recent values; the Industry and Analyst Growth Rate Method uses projections from financial institutions. Analysts may combine methods for more robust forecasts.
Click to watch →
Three statements
Balance sheet
Income statement
Cash flow statement
Combined insight
Three statements
0:00- 1
Identifies the three core financial statements.
- 2
Explains each has a unique purpose and timeframe.
- 3
Distinguishes between accrual and cash accounting.
The Intangible Capital and Qualitative Value Critique
While traditional financial statements are foundational, critics argue they are increasingly inadequate for evaluating modern businesses. Standard accounting frameworks (like GAAP and IFRS) are backward-looking and struggle to measure 'intangible assets'—such as intellectual property, brand equity, human capital, and proprietary algorithms—which drive the modern digital and knowledge-based economy. Furthermore, traditional financial analysis often ignores critical qualitative factors, such as Environmental, Social, and Governance (ESG) metrics, customer lifetime value, and overall business model adaptability. Consequently, relying solely on standard financial statements can lead to an incomplete or misleading assessment of a company's true intrinsic value and future growth potential, prompting modern analysts to advocate for holistic, non-financial, and forward-looking evaluation methods.
Basic terminology of business transactions, such as revenue, expenses, assets, liabilities, and equity.
The foundational accounting equation: Assets = Liabilities + Owner's Equity.
The conceptual difference between cash basis and accrual basis accounting.
The overall purpose of financial reporting and who the primary users of financial data are.
Financial ratio analysis, including liquidity, profitability, and solvency ratios (e.g., ROE, Debt-to-Equity, Current Ratio).
Horizontal and vertical analysis (common-size statements) to evaluate financial trends over time.
How to read and interpret actual corporate annual reports (Form 10-K), including financial footnotes and the MD&A section.
Introduction to financial forecasting and valuation techniques, such as Discounted Cash Flow (DCF) modeling.
169.7K views5.5Klikes0:57@BrianFeroldiYTOriginal Release: 2024-11-19
financial statements explained simply by Brian faldi there are three financial statements the balance sheet income statement and cash flow statement each of them has their own unique purpose time period and accounting the balance Sheet's purpose is to track what a company owns and what it owes it's kind of like your own personal net worth statement and it uses a point intime snapshot of what a company owns and what it owes it uses a cruel accounting the income statement's purpose is to track a company's income and expenses it's kind of like your own personal monthly budget it's measured over a period of time and it also uses a cruel account the cash flow statement's purpose is to track cash movements throughout the business it's kind of like your own checking account and it's also measured over a period of time like the income statement however the cash flow statement uses cash accounting which is unlike the income statement or balance sheet and the three financial statements work together to give investors a more complete view of a company's financial position
Up Next
15:59
Reading Financial Statements: Balance Sheet, Income Statement & Cash Flow
@CFI_Official
158.6K views•2020-04-15

46:36
Retention Habits of Top DTC Ecommerce Brands Revealed
@SendItPodcast
44K views•2026-03-03

15:23
Decoy Effect: How Pricing Psychology Influences Consumer Spending
@bobinvestsUS
90K views•2026-01-05

17:30
The Planned Obsolescence of Light Bulbs and Tech
@veritasium
25.3M views•2021-03-26
Related Study Plans & Knowledge Roadmaps
Structured learning paths in Business
business
Pop-Up Retail: Strategy, Design & Execution
01Introduction to Pop-Up Retail & Strategic Goal Setting
02Budgeting, Site Selection, and Legal Essentials
03Experiential Retail Design & Visual Merchandising
+ 2 more learning modules
15h5 modules
Explore Roadmap
business
Reg CF: Startup Funding, Marketing & Launch
01Introduction to Equity Crowdfunding & Reg CF
02Platform Selection & Legal Preparation
03Crafting High-Converting Campaign Assets
+ 2 more learning modules
14h5 modules
Explore Roadmap
business
Productized Services: Scaling Solo Freelance
01Foundations of Productized Services
02Packaging and Scope Definition
03Pricing and Subscription Models
+ 2 more learning modules
15h5 modules
Explore Roadmap
business
Gov Procurement: Find, Bid & Win Contracts
01Introduction to Government Procurement & Business Setup
02Small Business Certifications & Set-Asides
03Finding and Analyzing Contract Opportunities
+ 2 more learning modules
14h5 modules
Explore Roadmap