
















Google Earth Engine is a cloud-based platform that enables researchers to perform large-scale remote sensing analysis by providing access to extensive satellite data archives (including Landsat, MODIS, and Sentinel sensors) and computational resources, allowing users to filter imagery, calculate vegetation indices like NDVI, EVI, and SAVI, and conduct land monitoring applications such as burn severity mapping, mangrove extent monitoring, and forest decline assessment through JavaScript or Python APIs.
NASA ARSET: Google Earth Engine Basics and Applications, Part 1/3
Added:Fundamental concepts of remote sensing, including the electromagnetic spectrum, satellite bands, and spatial/temporal resolution.
Basic understanding of Geographic Information Systems (GIS) concepts, particularly raster data models versus vector data models.
Introductory programming knowledge, specifically basic JavaScript syntax (variables, functions, and arrays) used in the Google Earth Engine Code Editor.
The conceptual basis of vegetation indices, such as the Normalized Difference Vegetation Index (NDVI), and how they measure vegetation health.
Advanced Earth Engine scripting techniques, such as image collections filtering, mapping functions over collections, and cloud masking.
Supervised and unsupervised machine learning classification algorithms (e.g., Random Forest, CART) for land cover and land use mapping.
Multi-sensor data integration, combining Landsat 8 data with other datasets like Sentinel-2, MODIS, or active radar (Sentinel-1).
Developing and deploying interactive Google Earth Engine Apps to share environmental monitoring visualizations with public stakeholders.
20.6K views410likes2:02:23Original Release: 2021-06-17
hello everyone and welcome to the first session of our google earth engine for land monitoring application series my name is zach benson and i'm based out of the nasa ames research center in california along with my colleagues who are joining me for this training juan torres perez and amber mccollum so before we get started with today's content i just want to go over some logistics information with you all the series includes three two hour sessions uh the two remaining sessions after today will be held on the 23rd and the 30th at the same time and that's 12 p.m to 2 p.m eastern time and recordings of each session of the series can be found on the training web page after those sessions are complete so we've provided the link to the webpage here on the slide i mean we'll have a q a session at the end of this part but we're if we're not able to go over every question or we're not able to get to your question please feel free to contact us via email here at the addresses we've provided on the slide so as i mentioned this series includes three sessions um with each focusing on the use of google earth engine as a platform for land monitoring applications um and just as a heads up you'll likely refer to me uh refer hear me refer to google earth engine as gee throughout this series um and in session two we'll go over methods of completing a supervised land cover classification uh to identify cover types like forests shrubs and bare soil and we'll also complete an accuracy assessment of uh to evaluate the performance of our classification and in part three we'll calculate a number of indices to assess environmental parameters over a time series and use this time series to detect land surface change but before we get into these more involved topics we're going to be going over the basics of ge and some general land monitoring applications for today's session and i mentioned our names earlier but here are some pictures of our set eco team just so you can put faces to names i also wanted to remind you all that you'll need a google earth engine account to participate in our activities if you haven't already made one make sure you go to the link listed here which can also be found on the training webpage to sign up for an account uh google earth engine accounts are free and you don't need to have a gmail in order to sign up for one they do however recommend that you use your work or institutional email i mean you can also just search google earth engine account sign up in your browser to find this link so hopefully you saw the instructions to sign up for this account ahead of time but if not really don't worry about it you can kind of just follow along with the activity on screen since i'm going to be mirroring the code editor um as we go through the code um but make sure to sign up for that account as soon as possible um and after the training you can always go through the code that we talk about kind of line by line for your own understanding without any of the instructors being online all right so here's a quick overview of what we'll be doing today first i'll go through some slides uh highlighting the potential benefits of using a cloud computing platform like google earth engine for remote sensing and we'll go over some data products from land monitoring satellites satellite sensors available within ge and a number of examples showing the use of this data in google earth engine for land management and then we'll transition to the ge code editor for our javascript api activity where we'll take a closer look at the interface load landsat 8 imagery and calculate vegetation indices and after this we'll take a quick peek at the google colab platform to briefly look at the python api option for working in ge and i just want to quickly remind you all that this will be a basic intro so if you're a little more advanced with google earth engine we might be going over some things that you already know um but this session is really to make sure that we're all on the same page with the basics of the platform okay so let's go ahead and get started with our first section discussing ge functionalities and available data types so you might have already heard some of the buzz surrounding cloud-based raster computing for remote sensing analysis but computing in a cloud has a variety of potential benefits since you're not limited by your own personal computing capabilities you might be able to process larger data sets simultaneously or reduce the time it typically takes to process data cloud resources can also typically host and store more data and since the cloud can be accessed from anywhere these large stores of imagery and other data types are accessible from anywhere as long as you have an internet connection with particular reference to google earth engine the barrier of cost is also removed for scientists researchers and developers since the platform is freely available to these user groups so the ge platform leverages the advantages of cloud computing to provide users with a single place for accessing satellite data applying remote sensing methodologies and displaying analysis results google's access to data storage and computing infrastructure really allow the platform to host large remote sensing data sets and provide access to global imagery archives and particularly relevant to our interest in ge for this training series is the application programming interface or api which can allow users to easily apply algorithms to complete things like land cover monitoring so the ge javascript api and specifically the the ge code editor interface is the most common method for interacting with ge um it's also the most frequently used by developers so a lot of useful scripts and base code can be found online in the javascript api um i know many of you may already have experience working with python and are likely wondering if you can use python rather than javascript and the short answer to this is yes the python api for ge is available through the google co-laboratory or google colab and it can be a little more difficult to use and it's not quite as common um so we'll be focusing more of our time on the javascript api but we're going to take a really quick brief look at colab at the end of the session and google co-lab essentially uses a specialized version of jupyter notebooks as an interface um so if you're familiar with jupiter notebooks you might be interested in using colab for that reason as well and here on the screen we have a screenshot of an example of visualizing a single map within the collab interface so a quick survey of some of the basic functionalities of google earth engine relevant for satellite imagery purposes includes things like automation of data processing and display uh near real-time monitoring machine learning algorithms and the implementation of graphical user interfaces i mean these capabilities can assist with the processing of large data sets an application of algorithms to multiple images over time series as well as making results and data visualizations a little bit more accessible so you'll also note that many of these functions are common in more traditional gis platforms like arcgis or qgis so it's important to note that a lot of these functions that you're currently using in a desktop gis platform are likely also available in google earth engine and here on the slide we have a screenshot of the ge code editor interface uh displaying a classification and regression tree or cart classifier implemented over the san francisco bay area using landsat 8 imagery to complete a really simple land cover classification delineating urban forest and water cover types just to give you a really quick example of what this kind of all looks like so as i just alluded to in the previous slide um ge has a lot of potential for land monitoring applications um and that's applications like long-term monitoring of landscape change uh computation of relevant indices evaluating parameters like vegetation soil snow cover and time series and change detection analysis of land surface features so ge also includes functionalities for calculating summary statistics validation and accuracy assessment and the visualization and presentation of results and the the earth engine developers have really tried to make the platform as robust as other gis platforms for processing analyzing um and displaying the satellite data now let's talk a little bit about some of the relevant satellite data products that are hosted and available in google earth engine uh the first and potentially most extensive is the landsat series with data from all successful landsat missions uh the total series covers um from 1972 to present day and with data from landsat 4 through 8 there's also 30 meter spatial resolution data available from 1982 onward and this includes raw images top of atmosphere reflectance and surface reflectance data products so these products are typically separated into tiers with tier 1 representing the highest quality images with the least cloud cover typically however the tier 2 images in these data sets are still good but they have higher cloud cover and a little bit more atmospheric influence so using tier 1 images can help to reduce the need for cloud masking or filtering within your analysis since they've already been selected for their high quality but all images should be filtered for cloud cover and potentially masked as well to improve your results so on this slide and in the next few slides i've provided the earth engine data catalog link for your reference so you can take a closer look at the available data products that we're going over so central 2 data is also available through ge and includes top of atmosphere and surface reflectance products uh the applications of sentinel 2 data are pretty similar to landsat but there's a few notable differences that you're likely already aware of sentinel 2 has a higher spatial resolution of 10 to 20 meters a 5-day revisit but it also has an overall lower temporal coverage as the data doesn't start until 2015.
so central 2 is often used in conjunction with landsat 8 data to provide an overall higher temporal resolution an entire spatial resolution is also frequently helpful for finer differentiation of land cover types or or smaller scale features of the land surface so ge also contains the modis archive you're likely already familiar with modis in some capacity but as a reminder modis data spans from 2000 to present day and it's pretty popular due to its high temporal resolution uh with a daily revisit time and in terms of reflectance products um i would say two of the most valuable for computing for completing your own uh land cover monitoring tasks are the daily and eight day global 250 meter surface reflectance products um the eight day product composites the highest quality pixels over an eight day period um which means this product might be particularly useful if your study area is in a place that frequently experiences cloud cover um it and this surface reflectance data has similar capabilities to that of landsat but the reduced spatial resolution um and spectral resolution can be challenging for some study areas and purposes and here on the slide i've displayed an example of the daily global modis surface reflectance product um in the ge map um and there are also a variety of pre-processed modis products that you might find useful such as snow cover vegetation indices and land cover data product type as well so another data set you might find useful is sentinel 1 sar and this data is pre-processed and ready for use in google earth engine we're going to be focusing mostly on optical imagery for this series but i want to make sure this radar data source was included in the presentation um sar data is especially useful for vegetation mapping and if you'd like to engage a little bit further with this type of data in ge i really recommend checking out our forest mapping and monitoring with sar data training this training goes through a variety of exercises to show you how to manipulate our data from a couple of different sensors in the google earth engine platform and you can find it here on the link that i've provided you can also just go to the rsat website and search for this training as well so i briefly mentioned this on the modis slide but there are also a variety of process land cover layers available in google earth engine i've shown an example of one here on the right this is the data from the copernicus global land cover layer data set and there are also layers displaying the modus land cover data type product maps of forest versus non-forest area derived from palsar data and access to the usgs national land cover database layers um so make sure you take a look at these data catalog links to really get a full survey of the available data layers and imagery archives all right so that was our super quick survey of relevant data products available um and now i just want to go over some applications for land monitoring related tasks um so hopefully this gives you a bit of an idea about the versatility of google earth engine and resources that might be helpful for your own work so first i want to touch on something that i actually previously covered in our fire series that just wrapped up at the end of may but there is a tutorial and script for mapping burn severity in google earth engine made available by the un space-based information for disasters management and emergency response program otherwise referred to as unspider and this script uses either landsat 8 or sentinel-2 imagery to calculate the normalized burn ratio for pre and post-fire images um it differences the two to create a difference normalized burn ratio and then thresholds the map and results to create a burn severity map for your chosen location and you can see here is a screenshot of of this google earth engine code for empodrado chile in february 2017 after a series of fires burned in the area and so burn severity is part of your land monitoring efforts definitely check out this training um it can be a really nice resource to use if you're waiting on burn severity products say you're waiting on the monitoring trends and burn severity program to go ahead and release maps of burn severity you might not necessarily have to do that if you can use something like this to complete your own burn severity mapping so another demonstrated application of gee is mangrove mapping our previous training titled remote sensing for mangroves in support of the un's sustainable development goals goes into detail of how to map mangrove extent and display results in google earth engine and the training goes step by step through a random forest classification to create a time series of mangrove extent change and also details the process of creating apps tools and graphical user interfaces in ge to better communicate and display results so you can see an example of the outputs from this training here on the slide displaying mangrove extent for 2000 2010 and 2020. and note that the graphical user interface allows a user to point and click to see the results rather than having to edit the code themselves so to learn more about this work in particular please visit the data explorer and comparison apps created to display this work i've provided links on the slide for you to take a look later after the session is over and i also just wanted to mention that there is a section of the forest mapping and monitoring with sar data training that i mentioned a little bit earlier that goes over techniques in google earth engine to map mangroves using sar data so i also wanted to highlight a couple of nas develop program projects uh that utilize google earth engine develop is a nasa applied sciences workforce development program and it engages early career scientists in remote sensing projects focused on applying earth observations to environmental issues um so if you're interested in this type of work you might want to look into engaging with develop program our first example was completed by the develop massachusetts team for cumberland county maine and public health officials and vector biologists at the maine medical center were really interested in identifying lands within the county that represent forest edge habitat they target these habitats for vector-borne disease mitigation uh since they represent a higher risk of tick human encounters um unless and thus exposure to illnesses like lyme disease so identifying areas of potentially high encounter risk can really allow them to target tick presence assessments and provide risk advisories to the public so for this work in google earth engine the team completed a supervised land cover classification for the county identified borders between forested and developed cover types and calculated edge habitat kind of across all of those different land covered types so here was the team's final result uh the classes used were urban forest and cultivated which accounts for cover types like agriculture um more classes were initially calculated in their analysis but it was determined that the most important classes uh were these three um since the focus of this part of the project was to identify forest urban edge habitat and the map on the left displays these cover types um the edges of urban enforced areas and the overlap between the two and in the second map on the right we see the mapping of forest urban edge habitat highlighted in blue and ultimately the team was successfully able to identify edge habitat in transportation corridors the borders of cities and small municipalities as well as near recreation areas so our second develop example uh used vegetation indices to examine forest decline over the past 20 years in the passing islands in the philippines and biodiversity conservation organizations working in the vasan islands are really concerned about the impact of habitat degradation on endangered species i mean mapping a vegetation decline in the area is particularly important in terms of uh habitat habitat loss for two species of interest and those are the vasan warty pig and the design spotted deer um so in an effort to map changes in vegetation uh the developed georgia team used the terra modis archive um in google earth engine from 2000 to 2019 to map vegetation indices that help to identify areas with critical vegetation loss so here are their results they used the normalized difference vegetation index or ndvi and the enhanced vegetation index or edi i'm in ge to map vegetation change from 2000 to 2019 i mean you probably recognize ndvi which is a pretty classic index for mapping vegetation but the team also chose to compute the evi since it tends to perform better in areas with dense vegetation so note that both these maps display change in their respective vegetation indices with the most vegetation decrease observed on the northern island and ultimately conservation managers can use this data to target their habitat restoration efforts and select prime locations for the reintroduction of the visayan worthy pig and spotted deer all right so that concludes the first section of the session uh now we'll go ahead and move on to our activity in the java ap javascript api um and i'll go ahead and switch over to my browser but before that i just wanted to highlight the link here on the slide this is the link that you can use to get to a snapshot of the code that we're going to be using so you don't have to do any of the coding yourself you'll have it all there once you click this link and i think someone's going to also be putting that into the chat as well so you should have it from a couple different locations and just as a reminder if you don't have a google earth engine account at this point um it's totally fine um definitely make one as soon as you can but for this activity um you can just follow along on screen i'm gonna be mirroring my screen showing all the code um and then you can go over any any code after the session as well on your own so we'll go ahead and switch over to my browser okay so before we take a look at our javascript activity i wanted to just quickly show you this earth engine data catalog website that we linked so much to within the slides you can look at different data sets and categories here there's climate and weather imagery which is a lot of what we talked about within our session um and then some of these other pre-processed land cover products cropland products uh things like that um but for what we discussed mostly today i just want to point you to um the tabs up here so for example we have landsat and so that just shows us all of the data that's available from the landsat series um over the course of uh the years uh that's landsat's one through one through eight um and just as i mentioned for example in landsat eight you can take a look at how they do this process what data products are available um we're gonna be using a surface reflectance product for our javascript activity um but as i mentioned uh there's other data products available too um through modis sentinel as well um and that provides sentinel one sar data as well as sentinel to optical data so just to give you a quick look at the earth engine data catalog but we'll go ahead and move on over to the ge code editor so hopefully you were able to uh get your hands on the link so that we can um follow so that you can follow along with me um as i go through this code um but first i want to give you a quick um kind of overview of how the code editor works um what are the different elements of the interface things like that so you'll notice things are divided here in a similar way that something like our statistical software or rstudio is organized so you'll see the main code editing area here right in the middle um the ge map right below which is where you can visualize your results visualize the imagery that you're using things like that over here we have basically the the fire file structure for organizing scripts um so for example we'll look here um i have a repository that has some of the scripts that i've been using including one here which is for our ge land monitoring sessions um and i have the code nested here for part one you also note the the docs tab this is really helpful so if there's a function that you see within code or something um that you're you're not really sure what it means within the code you can always just search it here um it will give you information about what each command means what the javascript api is potentially saying to you uh things like that so it's a really good search resource if you're not really sure what code is saying and then we also have a section here that displays the assets that are already uploaded these are just some shape files that i already have from some of the other work that i've been doing and basically within google earth engine you have the opportunity to upload assets that you can then use um within the google earth engine platform so that's things like shapefiles for clipping um you can even upload your own imagery say the google earth engine platform doesn't host something that you really want to use you can upload that here in the assets so that you can work with it in ge and we'll take another look over here to the to the right of the screen um you have the console this is basically just where anything that you print goes we're going to use this a little bit to look at some of the the metadata um for the imagery that we're using um the inspector allows you to click through some of the layers that you have displayed on the map to see pixel information or layer information depending on what you've already included within uh the map frame and then it also has a tab for tasks so you can take a look at what google earth engine is running through your account at the moment awesome so we're going to move over to the code editor and and how we're going to do this is um you'll notice all the code is currently commented out as we go through the code what you're going to want to do is uncomment things as i uncomment them the two slashes basically signals the code editor to comment out the code so we'll go ahead and delete these two slashes which kind of activates the code makes it ready for processing and ready to run within the code editor and you'll also notice just descriptions above laying out what each command is doing or what each section of the code is is doing within uh the full series of the code all right so we're going to go ahead and get started um the first thing we want to do is establish kind of a spatial extent for our analysis so we're going to be using landsat 8 imagery but we have to tell google earth engine uh where exactly that google earth image imagery is going to be covering um so in this case we establish a variable which is point and so that point variable is going to signal to google earth engine um what our spatial extent is uh what landsat imagery um we're filtering for and so the function here for uh geometry point um basically just establishes our point of interest as this lat long value which in this case is the the bay area just to filter our data um spatially um for the study area that we're working with and so the next thing that we're going to want to do is import uh landsat 8 surface reflectance data um and so that comes in an image collection basically a series um of all the landsat 8 surface reflectance images that we're going to need to end up filtering and so we established the variable here as l8 basically just standing for landsat 8 and then we're calling the image collection um with this command here ee dot image collection and then specifying um basically the file structure of where that landsat data is located and to give you a little bit more context about how this works um whatever data you're interested in using with google earth engine um you can type in here so we're interested in landsat 8 surface reflectance let's see so we want surface reflectance tier one so we can take a quick look at that it'll go ahead and show us some of the metadata about the about the imagery um it'll provide us with information about how it's processed um what bands are available and this is a really great search function to to learn more about the data that you're using um and basically where we get that command to call this data into the code editor essentially is right here and you can just go ahead and click and copy um and you'll notice that this uh this highlighted copied section right here is identical to what we have here in the code so that's one really easy way to kind of filter and search for imagery that you might be interested in using and then kind of just copy and paste it right into your code and so now that we've established uh the area that we're trying to do our analysis in um as well as the image collection that we're working with um we can go ahead and get some more specific filtering with the imagery so we'll go ahead and uncomment this series so we're trying to get a single image filtered for the bay area for the month of may and let's go ahead and uncomment all of this code here awesome so we're establishing another variable it's a single image the one that we would like to uh process for a series of vegetation indices and as you can see here um we're calling that image and filtering uh the image collection that we just called into the script so to establish that image uh we're working from the l8 image collection which we've just established up here um and we're filtering bounds which essentially is like our spatial filter so we're filtering that to the point that we've provided in the first line of active code um we're filtering for a date which is um the least cloudy image within may so we're looking at may 2021 um so images within that time frame and then we're sorting by cloud cover um there's a cloud cover attribute to the data which we can use to kind of filter for the least cloudy image and then here where we're saying first that essentially is picking the first image that fits all this criteria and has the lowest cloud cover and so with that we want to just take a look and see what that image is um so to view the selected image metadata we'll just go ahead and use this uh the spring command here or print function and so what we're going to do right now is just go ahead and run the series of code that we have uncommented and so this is calling an image collection filtering it um for the point that we're interested in the dates that we're interested in as well as cloud cover i mean we can see here that that selects a single image and you'll see here in the console as we kind of click through it will say 12 elements um which essentially equates to uh one image which let's see here so you can see all of the bands associated with the image um that we've called into the script um you can see some additional metadata let me just blow this up a little bit so we can see this a little bit easier awesome so you can see the cloud cover score as well and then let's see if we can find the date it's just a little bit lower all right we have the the name of the image here which basically shows us uh at the end here uh the date itself so we have the month of may so that's the o5 08 is the day of the month and then 2021 so this is filtered uh all of the the collection of landsat 8 surface reflectance data for the month of may in 2021 um it's given us that um least cloud cover image um so that we can go ahead and proceed with our uh vegetation indices calculations cool so now that we have uh the image established with the variable image um we're going to go ahead and start working with some of the bands that were available within that image so as you saw each of the bands was listed in the metadata of that image i can bring that right back up so we have bands one through eleven which each correspond to a different portion of the spectrum that we're interested in using for calculation um and so we'll go ahead and uncomment this section of the code here and so for our image we're interested in reassigning some of the names of these bands so that's a little bit easier to do our vegetation index calculation so right here basically what we're telling google earth engine to do is select these three bands uh within the image itself and then reassign them the names uh near infrared red and blue um so that we can go ahead and compute some of these different vegetation indices so that establishes uh basically how we're going to be calculating um each of these these indices and it makes a little bit easier for us to work with the data awesome so the first vegetation index that we're going to be calculating is one that you're you're likely very familiar with it's one that we always talk about it's ndvi normalized difference vegetation index um i've shown here in line 23 um basically how that's calculated it's basically just using the the near infrared and red bands um to assess greenness so you can see that calculation here i mean and this calculation is so ubiquitous uh that or really any normalized difference calculation is so ubiquitous that the google earth engine developers have actually created um a function for that so you can see here we'll go ahead and uncomment this um nddi essentially equals the image that we have uh filtered um and then it calculates the normalized difference with the near infrared as well as the red um so that's basically just like a shortcut so that you don't have to do some of the more complex calculations within the code before this function was established i'm used to have to use this code up here which will briefly uncomment which is basically just coding in that equation of near infrared minus red divided by near infrared plus red but we're going to go ahead and comment this out because we have that kind of shortcut function available for ndvi and then we're going to go ahead and display our ndvi results within the gee map section so we're going to uncomment these two pieces of code and essentially this first one is just establishing uh the visualization parameters um that we want to use for this map um so basically what it's telling us is that for each pixel uh the minimum value is a negative one the maximum value is one and then we use this palette to kind of score the values across that mid and max and so the function that you want to use for adding a map to the map section of ge code editor is map.ad layer i mean we're going to specify that we want to add the ndvi with our ndvi visualization parameters that were established in the previous line and then we're going to want to name that layer ndvi image and so we'll go ahead and just run this so it'll take us through all of the code and then it's filtered that single image from from landsat and then it's applied to ndvi applied the visualization parameters we've given it and then it's added that map layer uh to the map interface so we can take a quick look at it um you'll see here layers are displayed um here for you to click on and off we can change the transparency of those um so this is our ndvi layer and really quickly just mapped um within ge so we can take a look um but that's not where we're going to finish things up we want to compute a couple of other vegetation indices for comparison so we'll go up back up here to the code editor and the next vegetation index that we're going to compute is the enhanced vegetation index um or evi you might be familiar with um so the equation for edi is here um it's also a function of uh the near infrared and red but also adding in the blue band as well as a few constants um in there and the edi is typically used for denser vegetation areas um so if you have a dense vegetation study area sometimes the edi is a little bit more accurate at detecting vegetation and so we're going to go about this in a little bit of a different way because as you can see that equation is a little bit more complicated so let's go ahead and start by uncommenting these two lines so we're going to go ahead and establish our variable which is evi which we're calculating and then we're going to use this expression function so that we can just go ahead and type out um the equation that we're using to calculate edi so it it mirrors pretty exactly this uh this equation here that we have commented out and that's just a much easier way of kind of visualizing your equation without having to do a lot of the more complicate complicated math functions and so when you create an expression like this you have to define which what each of the variables you've included means so here we're just defining what near infrared means what red means and what blue means and so you're going to want to go ahead and delete those slashes to activate the code and you'll see here that we're kind of all ready to process um for edi so essentially what this section of the code is doing here it's just establishing within our image what each of these variables that we've coded into the expression means um so we're just letting it know that when we're saying nir in our expression that's just referring to that to the nir band um that we've already established within the image so this is all ready to calculate evi and we'll go ahead and do something similar that we did with the ndvi which is just set our parameters for mapping the evi and then we'll do that same map dot add layer function including the evi parameters that we have for visualization and then naming the layer edi image so we'll go ahead and run that one as well awesome so this is just evil mapped over the same landsat image and we can unclick just to show differences in how those different indices have evaluated vegetation you'll notice that some areas are flagged that weren't flagged within ndvi as being higher vegetation you can also adjust the transparency here um to take a look at how those two vegetation indices differ i mean we're basically just going to do this one more time so there are typically three vegetation indices that come up when we talk about landsat data we've already gone over two the next is the soil adjusted vegetation index and this index is really good for sparsely vegetated areas because it tries to correct for a bare soil surface or bare land surface to get a more accurate assessment of vegetation so similar to the others we have the equation here of how we've done this and you'll see it's also a function of the near-infrared and red but just with a different constant as well as multiplied by another constant as well so we'll go ahead and uncomment this section of the code and you'll remember from the the evi calculation this is just us establishing the variable of soil adjusted vegetation sorry soil adjusted vegetation index which is savi and when we're employing another expression in this case we're calculating uh with that equation for savi and then we have to just establish what each of those variables means as it relates to the bands of the image that we're using so we're just establishing here once again uh basically which band is near infrared and which band is red and so with that we're all ready to calculate soil adjusted vegetation index and then we'll go ahead and just establish those same visualization parameters that we used for edi and ndvi oops we'll just delete those slashes again to uncomment the code and then we'll use the map.ad layer function uh to to go ahead and add that map uh to the google earth engine map interface as well so we'll go ahead and run that see i'm having ndvi now evi now we've got the soil adjusted vegetation index and you can just ignore this line down here that's just to center the map um on the the image that we're using i'm gonna go ahead and ignore that we're not gonna uncomment it awesome so you can see here we have the three layers of each of the vegetation indices we've calculated um and as you'll note kind of as we click through them each one does different assessments of vegetation mostly the same targeting the same areas that are more vegetated um soil adjusted vegetation index for the bay area it's looking a little bit more realistic just because the the vegetation within the bay area is a little bit more sparse itself um except for forested areas so this just shows you an example of a way that you can use google or earth engine to compare indices maybe figure out what your best uh your best methodology is for calculating vegetation or another index that you're interested in using and one last thing that we're going to do is i'm just looking at mapping an index over collection so what we essentially did was call an image collection into google earth engine and then pick out one image that was uh our chosen image based off of our filtering parameters so we chose an image that was in the month of may um that had the least cloud cover um and then we chose that image to do our processing of uh of each of these vegetation indices but when you're mapping over a collection you can essentially take every image within that image collection over a number of dates and then apply that index uh to the full uh collection of images that you filtered for in terms of date so we'll take a really quick look here at how something like this might work so we'll go ahead and uncomment the code and this line of the code is just to establish uh the indices that we're working with so essentially we're just calculating enhanced vegetation index all over again a lot of this looks the same just keep uncommenting the code there so that we can use it we'll just do just do the whole thing all right so what we're doing essentially is a kind of truncated version of what we've done previously for for one image or we're just establishing what the function is um with the variable indices and we're essentially using the same parameters that we used assigning all of our bands names near-infrared red blue things like that if we wanted to compute more vegetation indices and then we're establishing um the enhanced vegetation index which is the vegetation index that we're going to use for this example um establishing the expression of how we want the index to be calculated and then once again calling in those bands so that google earth engine knows what to calculate and we're going ahead and adding a band essentially for evi to the entire image collection um so we're we're doing a rename of this function as uh evi um and we're adding a band here that's evi to each of the images within the image collection and so now we're we're going to go ahead and establish a collection that's filtered to some of our own parameters this is very similar to what we did at the beginning of the code just to filter for one image but it's slightly different now awesome so we're going ahead and establishing our variable of the collection um which is essentially right here if you'll remember the full image collection is l8 that's what we named it uh toward the beginning of the code and we're going to filter bounds uh to uh point which is essentially the same geometric point that we use to to filter for the single um tile of landsat imagery and so we're going to filter the date a little bit differently we're going to go for all images in 2021 from january to the end of may and then for the purposes of this really quick uh intro to applying an index over an image collection we're just going to go ahead and uh filter for cloud cover so essentially what this is saying is we want to filter uh them for metadata specifically the the cloud cover land um and we want less than 20 so that's essentially um that that standard that you might have heard before that we only want to be working with imagery that has less than 20 uh cloud cover so we're filtering for cloud cover that way um typically you would do some some cloud masking and we'll show examples of that a little bit later on in the series but this is just a quick way to do some some filtering for cloud cover and then we're also sorting each of those images in terms of their cloud cover so uh lowest cloud cover first um and then we're calling that index that we established here with the variable indices i'm right here to the map so really quickly we're going to go ahead and just run the code once more after uncommenting this print function and so you'll see this is the initial image that we we picked out to do our calculation of ndvi evi and savi and then here we have the image collection that we've just established for january to may in 2021 and so you'll see there's seven elements let's see here so we have seven landsat images within our collection as we filtered it um so that's seven images that um were scored for less than 20 cloud cover within our date range as well as our spatial coverage of the bay area and so we're going to do something really simple now which is essentially just add this layer to the map so we still have the the evi parameters established from earlier in the code so we're basically just going to be mapping the edi band um with the edi parameters that we established earlier and then naming that the evi collection image so we'll go ahead and run that this isn't necessarily standard practice but i just wanted to show you a really simple example of of mapping one of these indices over an entire image collection so we'll go ahead and untick some of these so the edi collection image is essentially um a reduced mean of all of those seven images um that we established within the collection so this is basically an averaged image of all the evis over the course of those seven images um which is something that that i think you would typically want to do seasonally or at some aggregate that's informative for you um but one thing to keep in mind is that when you're doing this type of averaging between different uh dates you probably want to be doing some cloud masking as well but we just wanted to show you this really quick example of how that's done so that finishes the code that we were planning to go over today and you'll see here we have four different layers we calculated uh three different vegetation indices for one landsat 8 surface reflectance image and then we also applied an enhanced vegetation index over an image collection of seven images uh within google earth engine so i hope that was a good uh first kind of glance at google earth engine if you're not necessarily familiar with coding or with javascript obviously it might have been a little bit confusing but definitely take the time to kind of go through some of these uh activities and exercises after uh the session's over so that you can get a little bit better of a handle of how this all works um and obviously today was kind of like our brief intro to that so uh definitely take a little bit more time with the code and we'll be going be going over things a little bit more extensively in the following sessions all right so next up uh now that we've taken a peek at the javascript api let's take a quick look at the python api um for all you really dedicated python users out there um and we'll go ahead and switch over to google colab awesome so here i have uh the earth engine python api collab setup main page we're going to be going over this really really briefly we're not going to be doing anything too extensive or intense with the python api in colab um i just want to make sure that you all kind of have exposure to what this looks like to what the interface in in colab looks like if you're interested in engaging um with the python api um and as i mentioned we're we're not really going to be focusing focusing on the python api quite as much uh or really at all after after this session we just wanted to make sure you get this quick demo um to take a look at it awesome so here on the main page of the setup they're going to walk you through some steps of getting started with colab you'll notice everything looks very google drive um i've taken a lot of these instructions and commands common functions and moved them over to a different notebook within colab but this is a good step-by-step walkthrough of how to set up collab um how to start doing some initial map visualization sorry this will oh god sorry visualizations um of a static image um an interactive map um and then also i think there is a chart visualization as well which is nice um so i'm going to show you what some of this looks like um essentially what i did was um i looked at the setup page um i just went ahead and started a new notebook for myself to to work with some of this code and if you'll remember when we were first talking about uh colab it's essentially a specialized version of jupyter notebooks so if you're familiar with jupiter notebooks this is going to look very similar to you um and it's gonna function as as a as the same interface essentially um in google earth engine but working with python so hopefully that'll reconnect me awesome so this is essentially the the collab notebook interface that we're going to be um just really quickly demoing with earth engine um the first thing that you have to do is import earth engine into colab um so we're going to go ahead and and run that code you do that with a quick get to this play button here so that'll import earth engine for your initial setup and then this is a a part that i've already done um within the the code to go ahead and authorize and uh authenticate on the running of google earth engine in my google colab notebook um so you'll be walked through this step if you decide to complete that for yourself um but i wanted to go ahead and get to some of the python code that was used to interact with google earth engine so you'll see here's just a really quick example of printing the elevation of mount everest so those of you more familiar with google earth sorry with python will recognize some of these functions or commands that you might be interested in using to interface with earth engine and in this first example you're essentially just printing uh the mount everest elevation just as a test to make sure that the import and authentication went well and that you can run google earth engine in your python api collab notebook so you'll see here it's basically just calling an image from uh usgs srtm that's the shuttle radar sorry topography mission which is especially helpful for getting elevation data they've established a geometry point here um and then defined uh basically what the meaning of elevation is in the context of this code and then just printed out that elevation um which in this case is 8729 meters and so we'll move on to the next section of example code um and this is uh just the import image function basically just to display a map a single static map and we'll go ahead and play that and you'll notice that within this uh notebook interface um your code's going to be up here and then a separate cell is going to populate with whatever map visualization you're completing with whatever chart visualization you're doing um things like that so essentially calling in the image um visualizing it based off of the set of parameters in python within your notebook we've got a little bit longer of a script here um and this is to import a a map that you're able to navigate i believe let's see hopefully that works let's try it again there we go and so this basically just imports an interactive map um this is all srtm data it's elevation and you'll see this is a global data set with topography and so in this case we're looking at elevation you'll notice that in the united states obviously you have the rocky mountains at some higher elevations basically just for your reference the elevation and we'll we'll look a little closer at this but essentially what you're doing is just defining um visualization parameters the object that you're working with which is the elevation established from the srtm earlier in the code um and then you're selecting for the navigable map and then working through some of the visualization parameters with elevation and then displaying the map itself within uh within your colab notebook so as i mentioned we're not really going to be going too much further into this this was just to give you a really really quick brief intro to what this looks like um as i said if you're familiar with jupiter notebooks maybe this is going to be a preferred method of engaging with earth engine for you um but for our purposes um we're a little bit more familiar with the the javascript api and we tend to suggest using it just because so much of the development going on with google earth engine is happening in that ge code editor which uses javascript um so sometimes it can be just a little bit easier to find base code scripts things like that um when you're using the javascript api as opposed to python however um obviously python is a really popular way of engaging with remote sensing data a lot of people are already familiar with it so i think you can expect um things like colab the python api to become more and more popular with the earth engine um and more development to continue happening um with notebooks like this so i hope we didn't disappoint you by only going into that in kind of the most surface level way possible but we just wanted to let you know uh what was available for the python api and kind of what it looks like how you can navigate it and what the platform itself can do for you in general and so that wraps up our final demo of the python api all right so that concludes our first session in the ge land monitoring series um here's some major takeaways from this part uh ge's cloud-based environment can remove barriers to engaging with remote sensing data uh barriers like data storage and personal computing power and it's important to note that the functionalities of ge are similar to many gis desktop platforms used to do things like great land classifications and calculate environmental parameters from satellite data and ge also hosts many relevant land monitoring data sets uh from sensors like landsat modis uh sentinel 2 and sentinel 1 sar and in our activity you saw the capabilities of the javascript api to complete basic functions like image refiltering and vegetation index calculation and we also briefly explored the python api housed in google colab and please make sure you join us next week for our session on land cover classification and accuracy assessment so here's our contact info again just in case you have any questions about today's session um that we're not able to cover in the q a and we've also provided links to the training page the rsat website and to our social media um and we encourage you all to follow us on twitter to stay informed about upcoming trainings and events so thank you all so much for joining today um and i want to give a special thank you to john dilger from the spatial informatics group who helped us out with the javascript api activity and we'll go ahead and switch over to our q a session all right so it looks like we already have the q a doc up awesome so before we jump right into as many questions as we can kind of get through in the next hour i just wanted to give you another quick reminder um if you weren't able to follow along with the javascript activity today because you don't have a google earth engine account um definitely make sure to get one of those so that you can be following along with the code for the next couple of sessions um if it's not something that you want to do if you just want to follow along on screen that's also fine but we kind of encourage you to engage a little bit more with the code that way um and follow along with us in your own uh javascript interface awesome so it looks like we'll just go ahead and start with question one so let's see does ge charge for commercial use what are the costs are there additional features so i believe that ge is not officially available for commercial use at this point um this is likely going to change and private commercial organizations may end up being charged for the use of ge um however all available features of ge are available through the free accounts i mean you can usually contact the developers if you need more space allotted to your account um so basically what this means is that i think the intention at some point in the future is to charge private commercial organizations for the use of google earth engine but that doesn't really affect scientists researchers students non-profits from engaging with google earth engine and using its full functionalities for their own purposes and then this comment here about i'm contacting the the ge developers just to get a little bit more uh space a lot of to your account and that's something that um i have a couple of colleagues who've needed to do they they said i need a little bit more space i'll give them a rough estimate um anywhere from like 50 gigabytes to 300 gigabytes kind of whatever they think their needs are and usually um uh the kind developers that google earth engine are able um to allow for at least some of that space um and i think at some point in the future maybe a huge amounts of storage might end up being something that you're charged for but i would say that's probably not something that you would encounter if you're if you're using google earth engine for say like a 50 gig sorry 500 gigabyte capacity something like that awesome so question two what is the time lag from the time an image is collected by the satellites to the time it is made available in the ge data catalog i'm asking this question because i'm thinking of using ge for real-time vegetation condition monitoring uh where i would want to create a ge app so the processed imagery like the landsat surface reflectance product should be available within a few days of image recapture i mean it kind of depends on the particular product but i i believe the standard is no later than three to four days after the imagery is released by the organization that distributes the data and that organization is usually nasa or esa if you're using sentinel data uh something like that so i think the intention within google earth engine is to provide as many um near real-time uh monitoring products as possible so basically what that means is they'll try to make that data available kind of as soon after as possible um that it's made available to them and i believe they have kind of a variety of processing pipelines so a lot of this is automated so that whenever that data product is available it will be uploaded to the google earth engine data catalog so that you'll have it available and another thing that you can do with um image filtering just to keep in mind within the code is you can essentially set the parameter to a start date and then you can say like up to present so you don't necessarily even have to edit your own code to account for additional images and it you could basically just ask the code to process all the images leading up to present day as well as present day and if you're most interested in that in that current image you can also just say the most recent image is what you would like to process so i think that something like google earth engine would probably work well for a near real-time vegetation condition monitoring app all right question three can we create shape files using ge if yes can you please show a demonstration um so i think for this question so we're not jumping too much back and forth between the q a doc i'm in the interface um i'm going to go ahead and just direct you to some of the exporting resources available through the developers and basically the short answer is that you can create shape files using google earth engine and normally the way that you would create this is by using a geometry in the interface and typically that's you creating a polygon maybe establishing a set of points establishing a rectangle that you would like to be your shape file um and you can make that a feature collection and then export uh that as a shapefile using the export table function so definitely follow that link right here to learn a little bit more about how to do this i believe it's a relatively simple process we typically get our shape files from say county or national organizations and then we end up uploading those actually to google earth engine as an asset um but you should be able to export any of the geometries that you create in google earth engine as a shapefile and question four is there integration between ge and github so i'm not sure about direct integration between ge and github but there is an active group of ge developers on github with a variety of scripts and tools available that you might find interesting i'm going to link to a repository here i've also seen quite a bit of google earth engine code hosted on githubs sorry hosted on github repositories um kind of on an organization by organizational basis for example a lot of a lot of academic labs working with google earth engine will have their own github page where they just host all of their google earth engine code and that kind of helps them push and pull between various researchers within the lab but it's not necessarily something that i think you'll be able to access through like say the javascript api great question five what are the limitations of the javascript codes using ge over python and functionality so essentially javascript is uh currently the primary api for engaging with google earth engine so while i don't really believe that there's any uh real differences in potential functionality of the apis uh the current ge developer community tends to favor the javascript api which basically just means that there are usually more available scripts trainings tutorials and tools available using the javascript api so you'll probably find that some of the scripts that are available for the things that you want to do any trainings that you might want to take are typically happening in the javascript api and the python api also requires um an intermediate platform like colab rather than the direct engagement possible with the javascript code editor um and so basically that's kind of your decision to make based off your preference whether or not you'd prefer kind of a notebooks interface with the python api in colab or direct access to google earth engine using the javascript api all right let's see so question six can you please explain the difference between top of atmosphere and surface reflectance data sets of landsat and sentinel which data set is recommended for applying images image classifications and indices so essentially a top of atmosphere data doesn't complete an atmospheric correction to eliminate the influences of the atmosphere um it does a radiance correction it does some simple geometric uh corrections as well um but it's not really accounting for the full effect of of the atmosphere within the data um whereas surface reflectance data does complete this correction so the reflectance data is more representative of the reflectance of light directly uh from the surface of the earth back up to the sensor itself and we typically recommend using surface reflectance products uh since they account for the influences of the atmosphere um so so in short i guess our recommendation of between the two types of data would be going for surface reflectance if that's something that's available to you and in the case of landsat and sentinel you do have access to those surface reflectance products and we would typically recommend that you use those especially for land applications all right question seven can we change the coordinate reference reference system in google earth engine uh so ge is designed to take into account the projection of data on a product by product basis which essentially means that you shouldn't have to worry too much about the coordinate reference system um between each of your data sets because google earth engine will attempt to account for those i mean any calculations that you make um but if you would like to change the coordinate reference um and the projection of of your data within the javascript api i've provided a link here that shows a little bit about how to do this and hopefully that kind of points in the right direction with any questions you might have about the coordinate reference system in google earth engine and question 8 can shapefiles generated by the user from platforms such as arcgis or qgis be used for information queries so yes these shape files will just need to be uploaded as assets in google earth engine so basically what this means is that you can take um really any shape file that you're interested in using um whether it's produced in arcgis sorry arcgis qgis um or any other gis platform as long as it's a shape file and you can upload that to google earth engine um as an asset and you'll have full access to that asset once it's kind of uploaded into google earth engine um and you'll be able to do uh queries of different data products um imagery um using that asset as a feature collection and we're actually going to show an example of this in uh the next session with land classification we'll be showing um an uploaded shapefile asset that's a county boundary um and we'll be making that a feature collection uh essentially so that we can map a composited landsat image just over the bounds of that shape file so it's actually a really good um question about doing some spatial filtering when you're working with imagery as well okay question nine can i perform data fusion for multi-sensor i guess multi-sensor data in google earth engine so the short answer to this is yes i think there's quite a variety of ways to do this depending on your data inputs but it's a little beyond the scope of the session um and after we conclude this session i'll try to look for some more information about potential standard operating procedures or ways that this is done in the past and i'll try to link you to those so definitely take a look back at this q a doc after the session's over and i think that's that's an important thing to note as well you'll you'll notice that the the q a doc as it looks now won't necessarily look the same once you're looking at the pdf of it on the website because we try to add some of these little extra information points in there to fully answer your questions all right question 10.
can i integrate the ge app sorry api with some web application to display the results um so you have um a couple of options here um you can display the results directly in the map section of the javascript api and you can even code a graphical user interface so that the user just has to run the code in the code editor and then they can just kind of point and click their way through the rest of the results using the code generated user interface um that will pop up in the mac section of the the javascript api and you might also choose to develop a ge app which i believe can be embedded on web pages to make them a little more accessible i mean you'll notice back in the slides where we were talking about some of the mangrove work going on with google earth engine there are links to two google earth engine apps um on that slide that you might want to take a look at um so when you create a google earth engine avid it's a really kind of nice clean experience where really all the user has to do is plug in a url um and it essentially just shows the app within your browser so that you can navigate through any data results i think some of them give you the option as well to do some of your own processing if you'd like to either filter that by a certain boundary whether that be like a shapefile or a point or do some of your own calculations based on averaging between years and there's kind of a lot of different opportunities to to utilize the full functionality of uh the ge api um but through a more accessible um platform like an application that let's say the user only has to point and click through so it's a great way to display results and then also do some generation of uh results that the user is most specifically interested in and they can even be used as a way to kind of distribute data products as well okay question 11 does the code editor allow for collaborative editing i.e can it be shared amongst different users and track changes so the short answer to your general question is yes the code editor allows you to share um snapshots of code like we've done today you'll notice you just had to click on the link and it kind of took you directly to the code in the javascript api um but you can also share the the file itself of the code so that multiple editors can change the same script however this editing can't be done simultaneously i think you can do some version control just to make sure you're not losing anything or you can see what updates were made by a different editor but it's not quite the same as say on a google doc where you can have multiple editors at the same time so if you're collaboratively collaboratively working with someone on code you might want to just make sure that you're working on that at two different distinct times so that you're not kind of saving over each other i mean as i said i think you can kind of manage that with with versions to make sure that you're not losing anything it's just important to note that that editing isn't going to happen simultaneously within the same script file so question 12.
we can upload our own data interesting how much data uh how do we upload it are there proprietary constraints um is there a space limitation for upload and can we also upload external spatial data that is not imagery and use it for modeling in ge like uh tiff or grid files um so these are all great questions that kind of get at the root of working with external data sources in google earth engine and that's basically just any data source that isn't coming from the google earth engine data catalog i mean isn't already kind of pre-loaded and available within the ge um api so the the really short answer to to uh writing your questions here um is yes you can upload your own imagery and other data sources as assets in the ge platform um i i don't believe that there are any proprietary constraints since you can keep your assets private so that kind of gets at the proprietary constraints question that you asked i mean basically what this means is that if you're uploading an asset once you upload that asset it will be kept private private to your google earth engine account you can choose who you'd like to share that asset with um or you can just make the asset public um so that anyone can use it kind of with uh uh basically a directory section of the code referencing um that asset within your own repository and so your question is there a space limitation for upload um so space is currently limited per account but as i mentioned a little bit earlier i think you can usually contact the google earth engine developers to ask for additional space um and they prefer to do that on kind of a case-by-case basis um with an estimate of how about how much data you would need um so if you're uploading a huge record of of imagery that's definitely something that would warrant a bigger ask in terms of data storage available in google earth engine and then let's see what's your other question um can we also upload external spatial data that is not imagery and use it for modeling gee um so there's actually a variety of non-imagery based products already available in google earth engine which includes things like prism ground data that is displaying air quality metrics temperature data from the fields things like that that aren't necessarily um remote sensing data sets um or maybe only have a little bit of remote sensing data included in them um that you have the option to access directly through google earth engine but more to your point i think what you're interested in knowing is that you can upload any additional data this is typically done by uploading a csv file as an asset and then after uploading the asset um it can also be kept private um unless it's shared or made public and so to that point um that's basically just to say that any data that you're interested in incorporating into remote sensing analysis modeling as you mentioned that's something that you'll be able to upload to ge um and use for your purposes um and calculations within the code editor i think actually a a good example of this is um uploading training data for a lan classification and that's something we'll go over next week but we're basically going to be showing you um how to use an asset that basically shows points of different land classifications and use that to train an algorithm so that it can classify the rest of an image for land classifications okay question 13.
um is it okay to not have any info and scripts and assets while using the code.google link i think this was in reference to um the link that we provided for today's activity um and i think this this raises some really good points about how sharing vl link works um so you shouldn't have any issues um with our code in particular and we we hope that you didn't um because everything that we used was basically called directly from google earth engine um and this is a really good point about uh the links itself so if you're sharing a series of code if everything is readily available in google earth engine it's all public data um and you're say doing your spatial reference based off of a lat long rather than like a shape file you shouldn't have any problem just sharing that code in a link and then letting the user use run the code and then see any results that you might be interested in them looking over the only thing that you might run into with this is if you have any assets that are being used within the code um just sharing via a link isn't going to make those assets public or shared with whoever you're giving the code to um so an example of this is say you're calculating a series of vegetation indices and you're filtering over a shape file that you've uploaded as an asset um you need to make sure that that asset is either made public or that you've shared it with whoever is going to be accessing the code otherwise they're not going to be able to use the asset to do the spatial filter and that's just a pretty simple example of how that that works with the link and making sure that you've you've shared all of the necessary elements of your code to make sure that anyone can run it all right question 14.
so for landsat data how can we check whether we are accessing collection 1 or collection 2 data sets um and can we access both in google earth engine so you're able to check all of the metadata um of the imagery that you're using in the catalog window so i think in the the data catalog search demonstration we showed the the various data windows that will pop up when you're navigating the data at least in the catalog and then also when you search for data directly in the javascript api it will basically show you a window what the data is any metadata what the data coverage is typically how it's processed or provide you links to how the data was processed as well um so that's a really good source to go to uh just make sure that any image collection you're using is is the one that you're actually interested in um and i think that a lot of the landsat data available in ge that we typically see use typically comes from collection two since it's just a little bit more updated in terms of processing and i think this collection too is also where the surface reflectance data product is calculated um so in our case within this exercise using the surface reflectance data um everything from uh from the data that we imported is going to be collection too um but i believe that with with something like a simple print function you should be able to tell um exactly where that data comes from or at least the the name of of the file that you're you're looking at so that you can clarify that and i think that both collections one and two are probably available and that's not necessarily something that i've looked too much into since when i'm looking at landsat data i'm typically filtering for you know top of atmosphere reflectance versus uh surface reflectance and then also the quality of the images which i think is a good segue into question 15 uh which is what is the difference between landsat 8 surface reflectance tier 1 and tier 2. and so we went over this a little bit uh within the slides um essentially the difference between tier one and tier two um is based off of quality so the tier one images are going to be your highest quality um landsat eight images they're the ones with the least amount of cloud cover um they went through processing and quality control successfully these are the images that you typically will have to worry about i guess the least in terms of interferences um from things like clouds the atmosphere cloud shadows stuff like that um and then the tier 2 images are still very good quality images um but they typically have a little bit more influence from from things like cloud cloud shadow and the atmosphere so they're kind of separated that way um just to provide context for the quality of the imagery and usually when you're working with tier one images um it basically gives you the confidence to know that the imagery might have uh the least amount of uh cloud cover uh possible within the collection that you're working with and for example i think this is something that we've mentioned a couple of times throughout a variety of our site trainings but we usually recommend only using images that have less than 20 cloud cover i mean i'm not sure if that's exactly how it works for tier one um but just to give you some context about how that um that sorting of cloud cover typically works i think another another important thing to mention with that that data is when you're working with the surface reflectance product that's been um pre-processed and there's also a qa band there that a qa band a cloud band and i think also a cloud shadow band potentially which can allow you to filter simply for cloud cover simply for cloud shadow and can kind of eliminate the need for more complicated masking so you can essentially just exclude pixels based off of how they scored in [Music] the quality control phase of the analysis of the product rather than having to do some of your own more complex cloud mapping okay question 16 are the atmospherically corrected data ready for analysis to publish in peer-reviewed journals so um this is a little bit of a difficult question to answer but surface reflectance imagery is typically ready for your own analysis and as long as the atmosphere correction is adequate for your work um you likely won't need to do any more pre-crossing pre-processing of the imagery um so for example say you would like to do a land classification with this surface reflectance data product you're probably going to be good to go on that you can complete your land cover classification and and i would assume that something that kind of passes this level of quality control would be good for a peer review journal that kind of depends on your own study area one thing that i'll mention uh for example if you're trying to use um say landsat surface reflectance data um for any body of water say that would be fresh water um coastal inundated areas things like that you're going to want to be a little bit careful with the atmospheric correction because typically these atmosphere corrections are completed for land specifically and some of this works a little bit differently for water so that's just to give you an example of of how you should be looking at atmospheric correction and just making sure that it's adequate for your study area all right question 17.
if the user uploads their own imagery for analysis through ge is this imagery only available to them so short answer yes we've covered this a little bit um once you upload an asset to google earth engine it's kept private to your account um but you can make the asset public if you choose to do so in question 18 i want to learn ge i have zero knowledge of programming zero knowledge of javascript um i am interest i am trying to learn jupiter notebooks i don't have a computer science background should i start learning ge using python or javascript um so this is a great question because i'm sure that's something that a lot of you are wondering but ultimately it really comes down to your preference um so in this example if if you like using jupyter notebooks and that's something you'd like to continue doing um i would suggest looking into the python api in colab since it basically uses just like this specialized version of a jupyter notebook to interact with google earth engine um however the caveat to that is that you'll likely find more learning resources in the javascript api i mean that's just because as we mentioned um the javascript api has kind of been around for a little bit longer it's typically used um a little bit more by developers so so you might find that within your own um search for trainings tutorials and things that are going to help you learn how to use google earth engine you might just find that there's more available for javascript but it really does kind of come down to whatever you're most interested in using and hopefully the the demonstration that we did showed you just a little bit about the difference in kind of the user interface and how you interact with with each of the possible platforms all right question 19 does the filter point tell gee where the center of the landsat image should be so no the filter point selects the landsat tile which can change which contains the chosen point um so basically what this means is that if you filter by point as we did in our example today um google earth engine is just going to select the spatial bound um that covers this point so landsat images are recorded in tiles i mean in this case um the tile that was selected um includes the point that we provided in the bay area and we're kind of lucky that this tile covers uh most of the bay area within this one uh tile as well so that's not necessarily something you always see or experience so you'll you'll typically find that an area that you're interested in working with um isn't covered by a single landsat tile maybe it's like a couple of tiles a few uh landsat images um but we'll go ahead and show you away um next week during our land classification session um to show you how to filter spatially using a shapefile as a feature collection in question 20 will be covering the machine learning approach in this course short answer yes we're going to be covering machine learning algorithms available in google earth engine and we're going to go a little bit more in depth about the ram forest algorithm during the next session um so we're definitely not going to give you an inclusive approach to machine learning we're not going to go too much into detail about um how this machine learning works on on a wider scale but we're going to go a little bit more into detail with that random forest algorithm and and show you one of the approaches to using machine learning within google earth engine particularly for land classification in question 21 are the images atmospherically corrected so the images that we used in this activity are atmospherically corrected um since they're from the landsat 8 surface reflectance tier 1 collection and as we mentioned the the surface reflectance product um what what really makes that valuable for us is that atmospheric correction so we're looking at surface reflectance um directly off the surface of the earth question 22 here in var image we select the first image of the collection but how do we select the second or third image from the collection awesome so that's a great question um that's not necessarily a typical way that we filter um usually when you're using um that first function that typically is in reference to um that's typically in reference to whatever the first image is in whatever filtering metrics you've provided beforehand so in our case we're basically just looking for the highest quality image um in may which ended up being uh what was that may 8th and basically how that image was filtered first was that it had the best um uh cloud cover metric with the least cloud cover associated with that image um so that's what we're using the the first image for um but typically you're not going to necessarily filter that way unless you are only looking for one image i mean we'll go over this a little bit further about how to select for images how to filter images and then also how to do some some compositing and mosaicing as well so i think in the next session we'll provide a little bit more detail about that that'll be helpful for for this purpose all right question 23 is there a certain order of arguments location day cloudiness etc or can they go in any order all right let's see okay so essentially when you're when you're filtering images there's not necessarily a specific order that that has to go into um you can set your filtering parameters um before or after you import an image collection you can just use them as a variable um but typically what we like to do is essentially load the imagery and then do all of our filtering after that so you'll note note that when we were establishing our our chosen image within the example that we provided we essentially called in the imagery that we would be using and then filtered that imagery within a series of functions all back-to-back line by line um and it doesn't necessarily matter what order you do this in in terms of location date cloudiness um but i would say if you're if you're thinking about this in a workflow sense typically what is the easiest for me is to first filter by that location then date and then go further into the quality of the imagery which gets it cloudiness um so this uh kind of list of things that you've provided here isn't an order that i would personally use um just because i think it's easiest to load the imagery establish the location that you're interested in working in um filter by date and then other quality metrics like cloudiness water pixels things like that afterward okay question 24 how do you merge slash analyze imagery with different spatial resolutions um so you can re-sample and reproject data to reduce facial resolution um i think that's that kind of gets that the question you're asking here um so i've provided a link of how to do this from the ge developers um but essentially um i guess the the most simple uh example that i'll give you is say you would like to use landsat 8 imagery and sentinel 2 imagery um within the same analysis um obviously the the spatial resolution is going to be different there most of the bands that you're probably interested in for um sentinel 2 are at 20 meter resolution whereas landsat 8 would be at 30 meter resolution um so in this case to to use both uh data sets of imagery you'd probably want to uh resample and reproject the the sentinel data to reduce the resolution to 30 meters instead of 20 meters um and then at that point hopefully that helps you work with the imagery and pretty much the same way and use them within say one collection of images um in terms of merging the data or doing anything like data fusion um i think there's a lot of different ways that this has been approached in google earth engine that's a little beyond the scope of of this training but i'll try to provide some more links about how this is done um after the session's over okay question 25 selecting the near infrared and red bands and then using the normalized difference function like what are we doing here is that only when our data set doesn't have its own ndvi band so yes so if your data already has an ndvi band um you can feel free to just use that ndvi band but we were just showing a really simple example of how to calculate normalized difference vegetation index and other vegetation indices in google earth engine um if that band is not already available to you um so in this example uh the the normalized difference function is basically pre-loaded into google earth engine as a function since this normalized difference comes up in a lot of different calculations for different environmental parameters i'm going to give you a little bit of context about that the normalized difference function isn't only useful for vegetation you have things like a normalized difference water index a normalized different snow index normalized difference um soil index kind of the list goes on and on with different band combinations to assess different environmental parameters and so with the with the ubiquitous nature of all of these normalized difference calculations uh the google earth engine developers kind of just went ahead and made this a function so that it's easier to calculate those things and then with our other examples of the vegetation indices we kind of showed you how to complete these calculations for something that isn't necessarily already pre-loaded into google earth engine using the expression function [Music] all right question 26 is there a resource similar to ours crayon manual with a glossary of functions so i think that there might actually be a manual somewhere out there um i would i would link you back to the google earth engine developer website and i'll probably do that here but one thing that i want to mention is that at the very beginning of our work in the javascript code editor um i showed you that docs tab that's to the was it to the left of the screen same place as the assets tab and you can go to that docs section and basically search any function that you're interested in working in it will display kind of all of the functions that you have available um in a list and you can use the drop down arrows to look at what each of them mean and what you can do with each of them but if there's a particular thing you're looking to do whether that be like reprojecting or resampling something like that you can just go ahead and pop that into the search bar and it will show you what functions you can use to complete that which is really nice because it basically means that you have that reference kind of built into the interface itself all right question 27 with ge can i do gifs let's see so so yes um i've provided an example here of how to do this with modis data um and i think that's actually the same gif that i provided in the slides as well and that's a good a good screenshot right there so thanks for clicking on that um it's a pretty simple process i believe so if you're interested in taking a time series and then turning that into a gif there's a series of lines that you can use to do that and the script is available a little bit lower on this web page so we definitely encourage you to take a look at something like this just because it can be a really engaging way to present a time series analysis and you'll notice and yeah at the bottom of the page there was the code to do that awesome perfect so question 28 can you elaborate on the evi formula uh used in the code why is there a function for nddi uh but not for edi and ge um could this be added by someone and shared for calculating ndvi and ge is it better to work with surface reflectance or top of atmosphere images all right so to your first question um evi is essentially just another way of of using band combinations um typically available from landsat or really any other multi-spectral sensor um that was specifically designed to correct for some issues that happen with really dense vegetation um so for edi um typically that's something that you would want to use for dense forested areas maybe a really dense rainforest or something like that we just showed an example for the bay area picking one of the vegetation indices that we um that we had already calculated just to show how to map that over a collection but this is typically something that um you'll only need if you have a densely vegetated area i'm into your question about why is there a function of for ndvi but not for edi and ge um that's just because evi is a little bit more complex of a calculation it's not quite as ubiquitous as i mentioned with the ndvi that falls into the spectrum of these normalized difference calculations that are just really common for a lot of different um environmental parameters um so that's why that that function is kind of already built in to google earth engine um and not for edi since it's kind of a more specific calculation that has a number of coefficients that that have to be included in there as well and so could this be added by someone and shared um i don't believe that the function itself could be shared you could probably do some variable coding just to automatically calculate evi with a set of bands from a specific image if that's what you're interested in um but there are also and i should mention this there's a series of evi products available in google earth engine most of which are deprecated though so we don't necessarily recommend using things that no longer have support for them um so that's just something to keep in mind as you're kind of looking at these different parameters that are available in google earth engine sometimes you might want to end up calculating those yourself especially if the data set itself is is going out of use or will be depleted soon and so for calculating ndvi and ge is it better to work with surface reflectance or top of atmosphere images so once again we would we would just recommend surface reflectance because it takes away some of the effects of top of atmosphere images um that's not to say that we we don't condone the use of top of atmosphere imagery it's something that can be really helpful a lot of land classifications use it as well um that data set itself has its own uses but if we're talking about i'm kind of our most ideal standards for calculating something like ndvi we would want to make sure that the the atmospheric influences are corrected for um so we would recommend the surface reflectance product for that question 29 how can i export this ndvi within a boundary in general i have a vector file boundary of a specific county here and i want the ndvi exported just for that many thanks awesome well i think these first two sessions of of the series are going to be particularly useful to you then um because we are going to go over um using a shapefile boundary of a county um for land classification uh section next week um and so you can kind of apply things that you've learned from this session as well as the next um to do something like this but basically in short the way that you would do this is you would want to make sure that whatever vector file boundary you're using um is uploaded to google earth engine um as an asset um for that specific county and then you would want to make that county shapefile a feature collection which basically just um tells google earth engine that it's a boundary that should be filtered by and then you can filter by that feature collection um so then the imagery itself um will basically populate only that that spatial area which can be really good for mosaicing too um so say like i mentioned before your county exists over two or three landsat images using a feature collection this way can really help you get all the available imagery together for your specific spatial bounds um and not really restrict you to only using one uh landsat dial so it's a it's a nice way around doing some more complicated mosaicing too let's see so question 30 the classifiers in ge are let's see the classifiers in ge are mainly for classification of images is there any code or material for implementation implement regression random forest or support vector machine in google earth engine uh please do sheriff available yeah awesome so in the i know i just keep mentioning the next uh session but in the next session we're going to go over some of the algorithms that are available in google earth engine um for classifying any imagery that you have doing any other machine learning that you might be interested in and so off the top of my head i know that there's a naive bayes classifier random force classifier support vector machine classifier and a cart classifier available in google earth engine i don't think that that's an inclusive list um there are likely others available as well um but those are just ones that kind of exist off the top of my head and then we'll go into how that random forest classifier works in a little bit more detail um over our next session as well so if you're really interested in seeing how one of these classifiers are implemented um uh for an image um it looks like classification images okay yeah so for a single image um we're gonna be showing an example of essentially compositing and mosaicing um landsat imagery uh over the bounds of a county in maine um and let's see and that should provide you with a good example of how to start doing some of this work question 31.
in which cases is it better to use ge before gis software or other earth imagery analysis processing language yeah so this kind of get backs it gets back to preference um i think basically what you're asking is in what cases is it better to use ge as opposed to a desktop gis software um for imagery analysis and processing um and it looks like you're also asking about the coding language as well so i would say for a lot of the reasons that we talked about earlier um google earth engine can be great if you have any computing limitations um if you're worried about data storage things like that since everything exists on the cloud with google earth engine those aren't necessarily barriers that you have to worry about um and then a lot of the same functionalities that exist in say like arcgis or qgis are also available in google earth engine um the caveat there is you'll just need to be using an api to do that so if the coding is something that's a little bit more um scary to you it's not something that you necessarily want to use for for your entire project or it seems um beyond say like your expertise in coding um i would say using google earth engine for things like image filtering um getting mosaics and composites can be really useful and then you can always pull those into gis software um but i wouldn't say that there's any specific reason to use one over the other they both have their advantages um and then in terms of a processing language or an api which is like what i think that you're getting at um it really just depends on what you have the most experience with so if you're interested in um using python because that's what you use as an interface with arcgis um maybe google earth engine will be slightly more complicated for you because the the python api is um a little bit different it's not necessarily the same as an api for arcgis um it really i guess i'm just getting back to the same point where it's it's something that just is really based off of your own preference i think when we talk about the advantages of google earth engine it's it's mostly because of that cloud-based nature and then your ability to engage with remote sensing data um with say uh 50 lines of code um to do things like import filter and calculate like vegetation indices for um for imagery that you're interested in using so it ends up being a little bit less of a point-and-click experience and more of just getting your lines of code down to filter for some of that imagery and and make sure you're doing what you need to do in question 32 would analysis classification need to be done for each image tile separately or can imagery be mosaic together for further analysis yeah so i think we've touched on this a few times you'll you'll be able to mosaic imagery together so that you can do the same analysis and classification on images that you need i mean basically that's just going to get back to the point that a lot of the same functions that you're able to use when you're processing spatial data in desktop gis are also available in ge so you can definitely composite mosaic bring together those pixels and images that you're interested in using within one image per se so that you can complete the same analysis and classification on them okay question 33 how can we get statistics of the maps created by us is ge capable of producing grass charts tables with results for the various analyses yes so short answer to that is ge is definitely capable of producing those graphs charts um tables scatter plots those things that you might be interested in um and those will typically uh populate within the console when you're just running them in the in the javascript api i mean i think we're we're planning to show a couple of examples of this um in the following sessions um but essentially it's just a function that you type into the code editor um and that will kind of spit out a line graph a bar graph a pie chart whatever you end up coding um to display a specific uh parameter that you've already calculated say something like ndvi over a time series analysis something like that um you definitely have the option to display that data i'm in whatever way works best for you and then export that as an image and how can you add a color bar map a color bar to the maps a legend yeah awesome question um you can use a series of different legend codes it's something that um a lot of developers don't really implement until uh say like the user interface stage of their coding um but we're also going to show an example of this um in the following uh sorry in the following sessions um just to show how you can display that legend um directly within the map section of the ge interface so more to come on that um and hopefully that will answer your question in the future okay question 35 is there a shortcut to commenting and uncommenting several lines of code at once in google earth engine so yes there is that's actually what we used for the headings of of each of the code sections you'll notice that we left um each of the headings of what we were doing within the code uh uncommented and basically the the shortcut for that is at the very beginning of what you would like to uncomment and we do a slash and an asterisk and then at the end of what you're interested in commenting you do an asterisk and a slash so i think someone someone's going to type that other way there you go and then you would end it um with an asterisk and a slash and that will just comment out everything within the bounds of the the slash asterisks so question 36 is it possible to change the var from point to polygon if we want to process some specific area so yes this is definitely something that you can do um basically what you would want to do is make sure that well actually i guess you could you could create your own polygon that is a function that you can do in google earth engine um to filter bounce that way one thing that we typically do since we're usually working with shape files of a specific area is we upload that shape file as an asset um we make it a feature collection and then we basically just tell google earth engine that we're only interested in mapping over the spatial bounds of that feature collection and so it works pretty similar to what we did with the the point but just implementing a future collection of a specific area and as i mentioned before we're going to show a direct example of this on the next session as well all right question 37 how can we apply the expression as evi and savi for date interval collection and not for a single image yeah so we basically showed you how to map one of these parameters that was edi over an image collection and basically we do a similar calculation to that but we choose the image collection rather than um one single filtered image and then when we map over that collection without doing anything else um it will basically just reduce that collection to a mean so what we're getting is the mean value of all the pixels and then the edi is calculated for um that that mean itself so it's not necessarily image by image you can calculate edi image by image that way so say you're interested in filtering your uh date by i don't know what what we did january of um it was 2021 january of 2021 uh to may of 2021 um and then you can basically tell google earth engine to create a separate map for each of those available images um that's something that i think will approach a little bit more in session three um where we're going to be taking an image collection and then uh calculating times here a time series of normalized difference functions over a series of those images as well so we'll have kind of a coded visual example of that for you in the future question 38 is it possible to establish the variables before calculating the indices once and for all yeah so you can establish any variables uh that you're interested in using kind of at any time um the only thing that i would say is you probably want to establish which boun sorry which bands you're using before then because just keep in mind that with any of these variables you want to make sure that google earth engine is able to reference what each of the points of the variables means and so in our case we're we're typically um focused on making sure that the correct bands are selected um from whatever sensor it is that we're using and then we tend to do things like calculate all the variables um or at least establish the calculations of those variables so so in this case we we used image sorry we used expressions for calculation of edi um and savi and that's something that could be placed at various parts within the code just to establish what that expression means but the way that we showed it to you was basically step by step just showing the expression calculating the expression and then adding it to a map um but like like i think you're getting at you could in theory establish all those expressions beforehand and then do all the mapping at once question 39 the output for the edi collection image january to may doesn't look different from the original output of the evi image may only would we normally expect to see a difference or is it just depending on location technology time span etc mostly i'm just interested to not see a difference between one more than five month outputs yeah so this was a very rudimentary example of mapping over a collection um so in this case um we reduced that image to mean and then it showed any area that had green with over this within the span of those dates um so i think in our first example of evi we were looking at just an image from may where we would expect a lot of green up anyways so i think that might be why you're seeing a lot of similarities between those images um but typically when we reduce to a mean we're not necessarily using and comparing that to another image we're not necessarily using one of those same images that was used within the average itself which i know is a complicated way of saying that but um typically the way we would do something like this is say aggregating over a c over a season comparing yearly seasonal outputs things like that where you would expect to see a little bit more of a difference so you're kind of spot on there um mentioning uh phonology and time span and things like that and i would also say that for the bay area um there's still quite a bit of green kind of throughout the year so you might be noticing some of those effects of having green vegetation year round right question 40 what's the best way to filter imagery to have uniform lighting i've come across certain areas where one image is brighter and thus generating those eggs becomes very difficult so i think one of the few well one of the times that i've encountered this is when using top of atmosphere data typically when you're using surface reflectance data um i would hope that you don't see quite as much variation in terms of the lighted image um but i think this also depends on time of year um surface exposure to the sun things like that which i believe are actually corrected for within the surface reflectance product so i'm going to need to look a little bit closer at this question and hopefully i can provide you with some links um to give you a little bit more context about why you might be seeing this and and how you can improve your mosaics question 41 in the example uh the speaker chose a specific date for imagery and has the that has the least cloud cover i assume we have to identify it ourselves by looking at the image collection we'll use well actually so the way that we did this filtering was using uh the cloud cover band um that's available in the surface reflectance product um so we didn't have to pick out a date in terms of cloud cover ourselves within the surface reflectance products the the cloud cover is estimated and it will classify um a pixel as covered in clouds or not covered in clouds and then using that identification of cloud-covered pixels we were able to filter for the image that had the least amount of cloud cover so we didn't actually have to take a look at any of those images to establish which one had the least cloud cover okay question 42 if i want to use the same code for another area um let's give a lot long here is it not sufficient to change the center map point um what else has to be changed so i believe in this case if that's the only point that you're interested in um you can just change that that small portion of the code where you're establishing the latin long and that will just change the geometry point that ge is filtering by and i think you should be good to go if you want to keep everything else the same and then the map center point is something that you can kind of just leave off that really just centers the map for your own viewing purposes so if you need to get rid of i think there was a little bit of leftover map center point code there that that you don't need to worry about question 43 in this example we have seven images of the region how can i display all seven images to assess them individually and can you go over the dynamics of a future collection and a single image awesome yeah so if you're interested in mapping all seven images of the region that's just gonna be a difference in filtering and so we'll show this a little bit more um like i mentioned in the last session where we're going to be establishing an image collection and then mapping a time series over those images um so i'd say definitely stay tuned for that um and we'll we'll show basically a way to just map all seven of those images um and then display those maps within the the map section of the interface and the dynamics of a feature collection in a single image so feature collection is essentially like say a feature that you'd expect to find in something like arcgis um and the single image is just one image so feature collection um is something that we tend to to map over it's not necessarily just like a single image or a single point um whereas that single image is just that one image from that single date um it's not a collection of anything um and we kind of have that one static image i believe that's what you're asking but i'll go back through this and give you a little bit more of a distinction between the two after the session because i know we're about at times so i want to go ahead and finish up real quick so question 44 i'd be very happy if you include how to import and use training points for classification accuracy assessment and ge would you include it so we'll definitely be going through uh the classification and accuracy in part two um so definitely join next week um it's the same time the same link um and we'll have this recording of part one up on the webpage um yeah so that's just basically a really nice way of saying that you should definitely uh stay tuned for part two of this um and we'll be going through that exact thing that you've asked for awesome so i think that's where we will cap the questions um just two minutes over uh thank you all so much for taking the time to join us um and thanks for asking so many great questions um so we'll see you next week thanks everyone you
Up Next

15:08
Rust Programming Tutorial: Installation & First Program
@TechWithTim
581.1K views•2022-05-09

12:54
Triumph of Orthodoxy Icon: Byzantine Art & History Explained
@BenCallan
2.1K views•2024-08-06
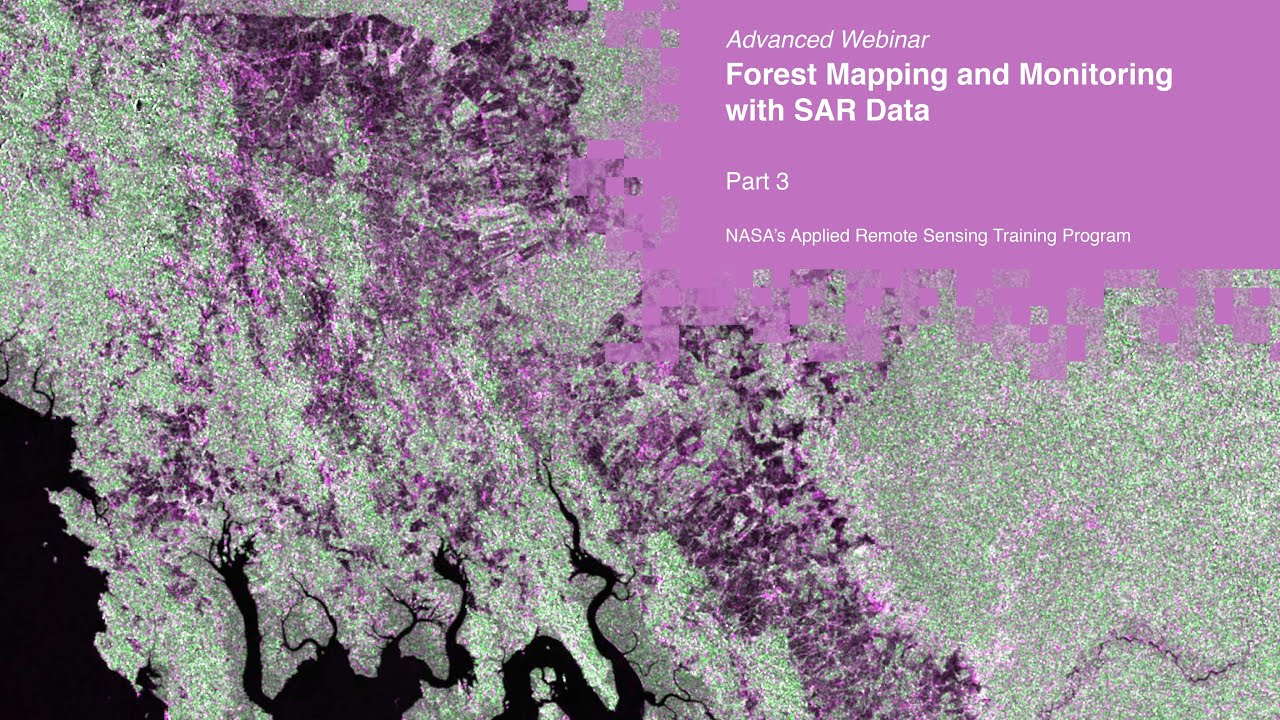
152:24
NASA ARSET: Mangrove Mapping with SAR Data | Tutorial
@NASAgovVideo
7.7K views•2020-06-01

1:42
Game of Thrones Opening Credits: A Cinematic Analysis
@gameofthrones
46.3M views•2011-04-18
Related Study Plans & Knowledge Roadmaps
Structured learning paths in General & Interdisciplinary Studies
general-studies
Elevator Engineering: History, Physics & Cities
01From Hoists to Safety Brakes: The Dawn of Vertical Lift
02Hydraulic vs. Traction: The Engineering Physics of Elevators
03Modern Speed, Safety, and Algorithms
+ 2 more learning modules
12h5 modules
Explore Roadmap
general-studies
Rubber: Material Science, History & Geopolitics
01Origins of Natural Rubber & Mesoamerican History
02The Chemistry of Natural Rubber & Vulcanization
03The Geopolitics of the Rubber Boom & Colonization
+ 2 more learning modules
12h5 modules
Explore Roadmap
general-studies
Containerization: Evolution, Logistics & Trade
01Ancient Trade & Bulk Cargo: Amphorae to Barrels
02The Industrial Revolution & Cardboard Packaging
03The Containerization Revolution: Malcom McLean
+ 2 more learning modules
12h5 modules
Explore Roadmap
general-studies
Textile Tech: Evolution, Labor & Global Impact
01Pre-Industrial Textiles: Handloom & Cottage Industry
02Mechanization: The Spinning Jenny to the Power Loom
03The Factory System & Global Labor Transformation
+ 2 more learning modules
10h5 modules
Explore Roadmap