


















The RUSH protocol (Rapid Ultrasound for Shock) is a systematic approach to evaluating hypotensive patients using POCUS, organized around the Pump-Tank-Pipes framework: evaluating the heart (pump) for cardiac dysfunction, the peritoneal/pleural cavities and IVC (tank) for fluid status and obstruction, and the aorta and lower extremity veins (pipes) for aneurysms and DVT; this method helps differentiate obstructive shock (large non-collapsible IVC with right heart strain or pericardial effusion), cardiogenic shock (low LVF with pulmonary edema), and hypovolemic/distributive shock (hyperdynamic LVF with small/collapsible IVC) to guide resuscitation decisions.
RUSH Protocol: POCUS in Hypotensive Patients
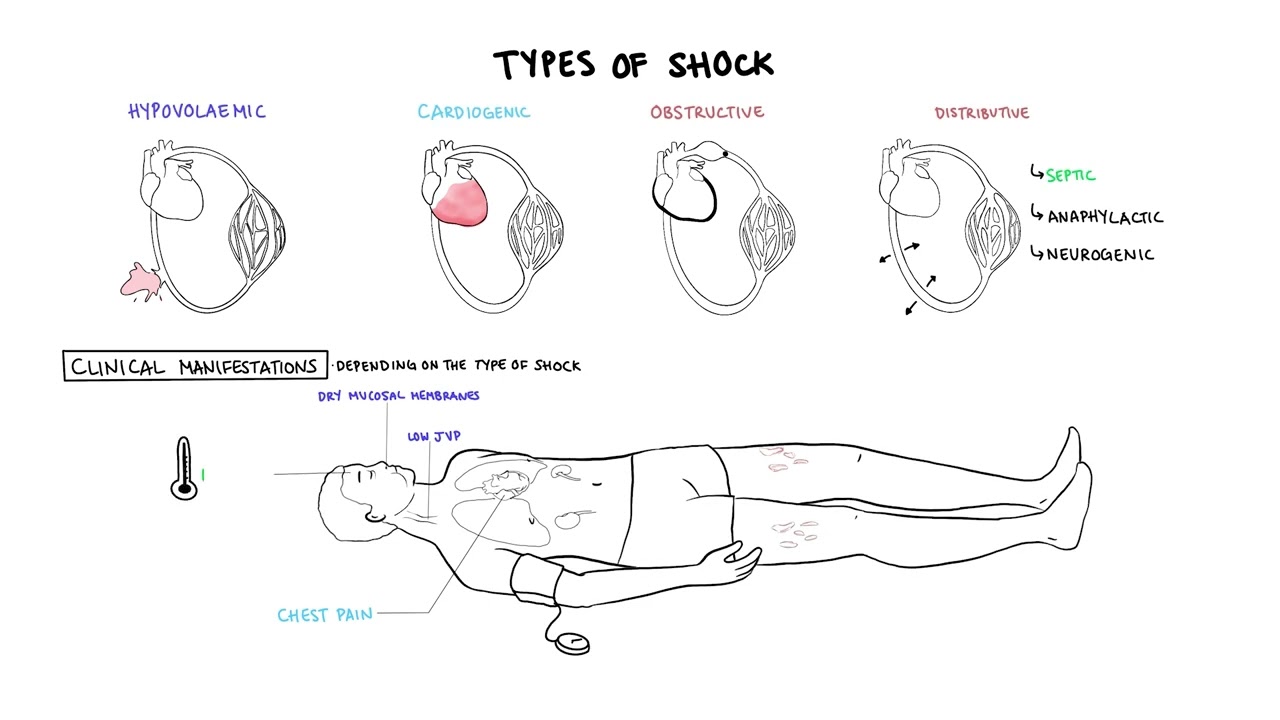
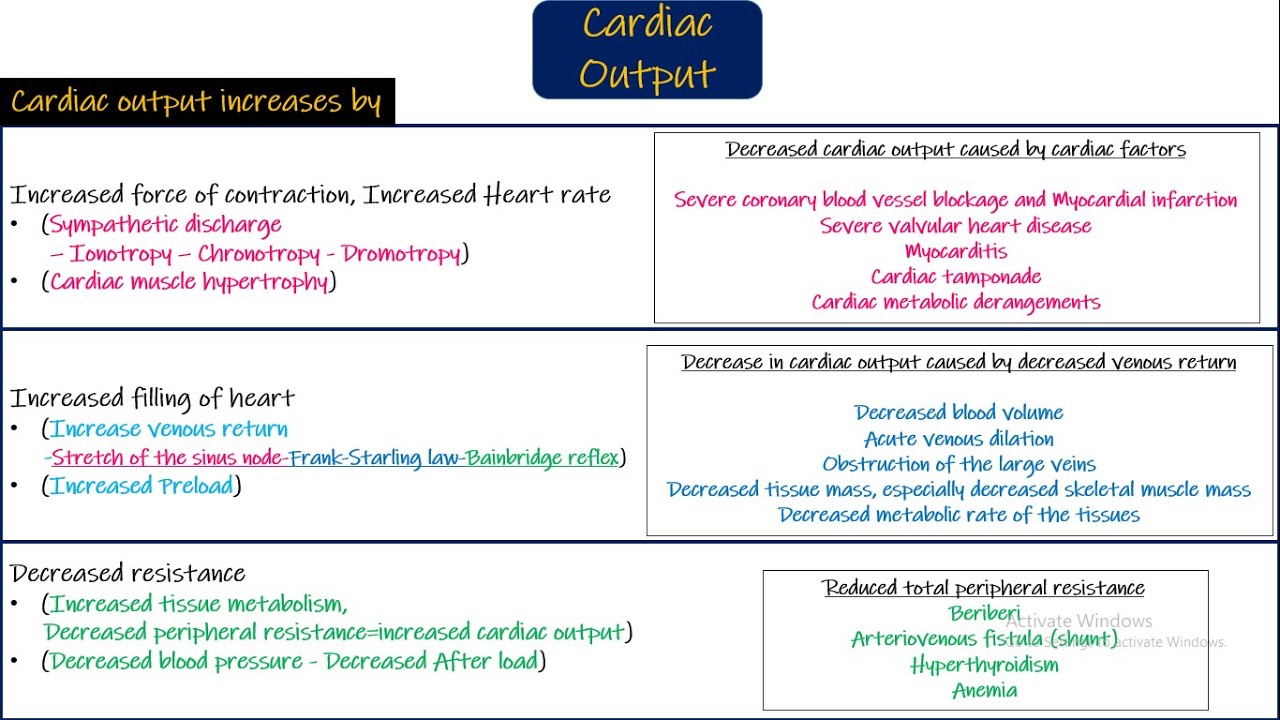
Added:Classification and pathophysiology of shock states (cardiogenic, hypovolemic, distributive, and obstructive shock).
Basic physics of medical ultrasound, including echogenicity, transducer selection, and fundamental imaging controls.
Gross anatomical landmarks of the thorax and abdomen, specifically the heart, lungs, abdominal aorta, and inferior vena cava.
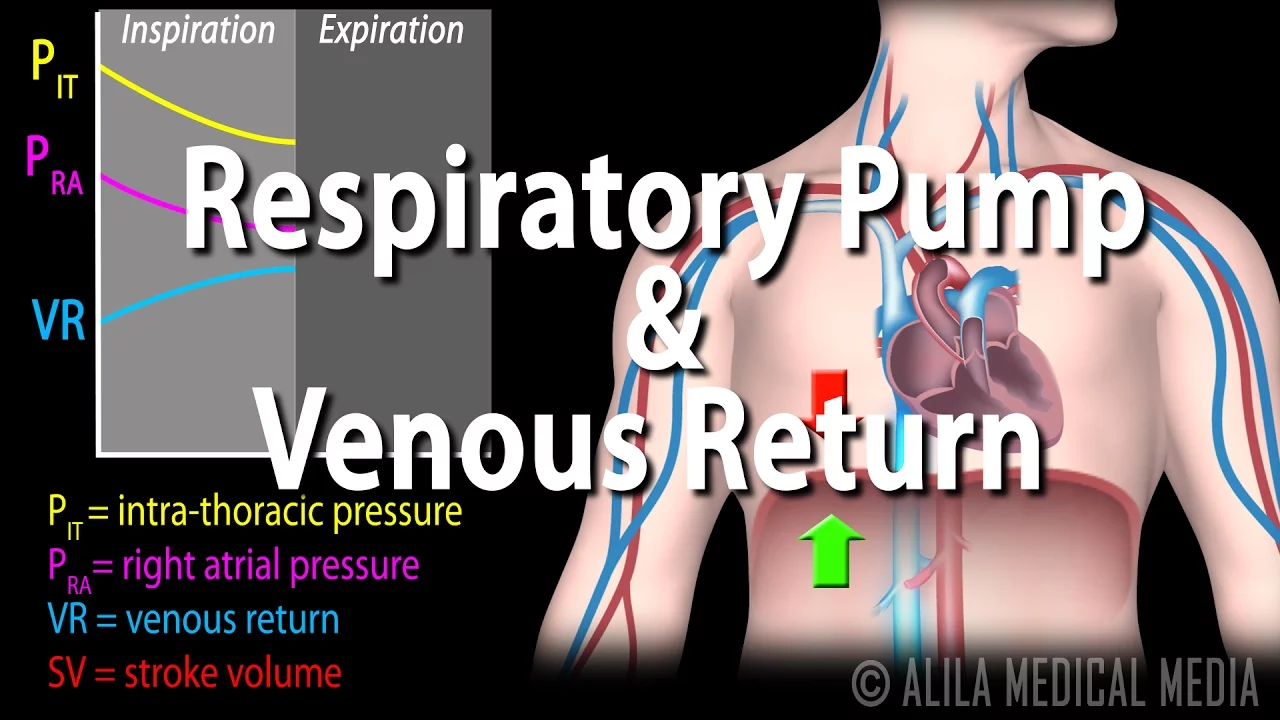
The physiology of venous return and how changes in intrathoracic pressure affect the dynamics of the inferior vena cava (IVC).
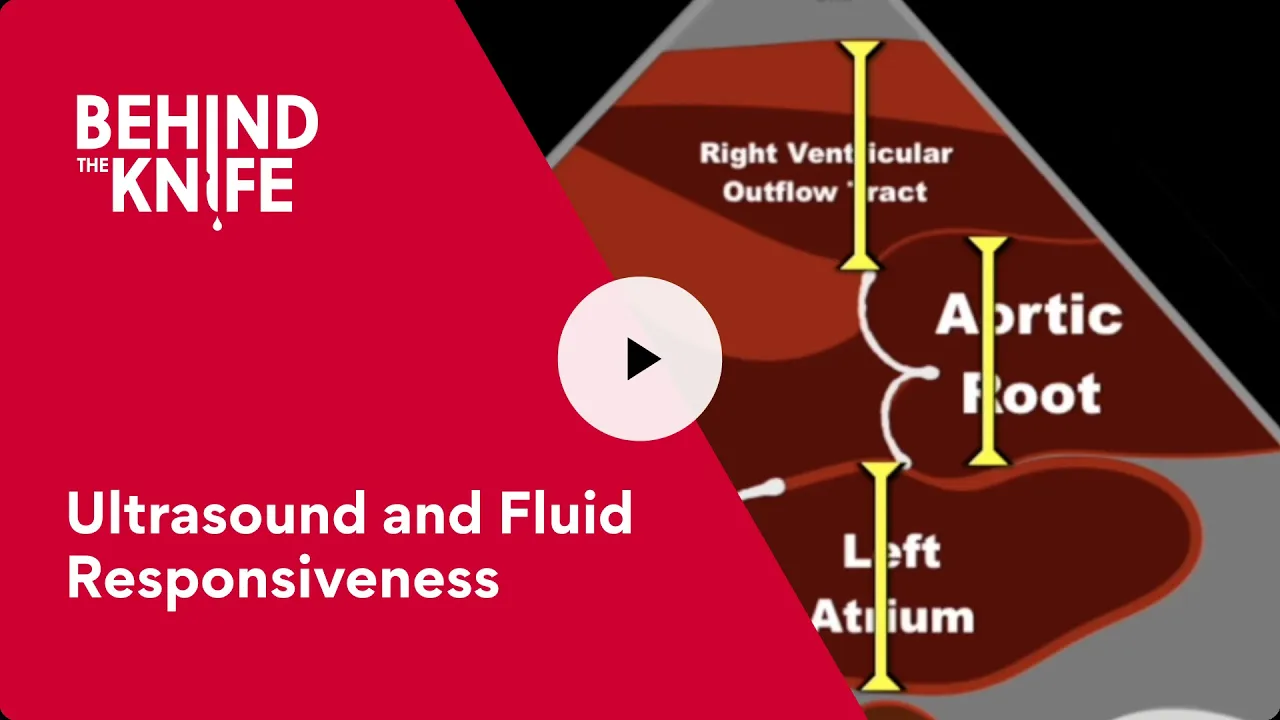
Evaluating fluid responsiveness using advanced quantitative Doppler parameters, such as Left Ventricular Outflow Tract (LVOT) Velocity Time Integral (VTI).
Integration of RUSH protocol findings into comprehensive emergency resuscitation algorithms and goal-directed shock therapy.
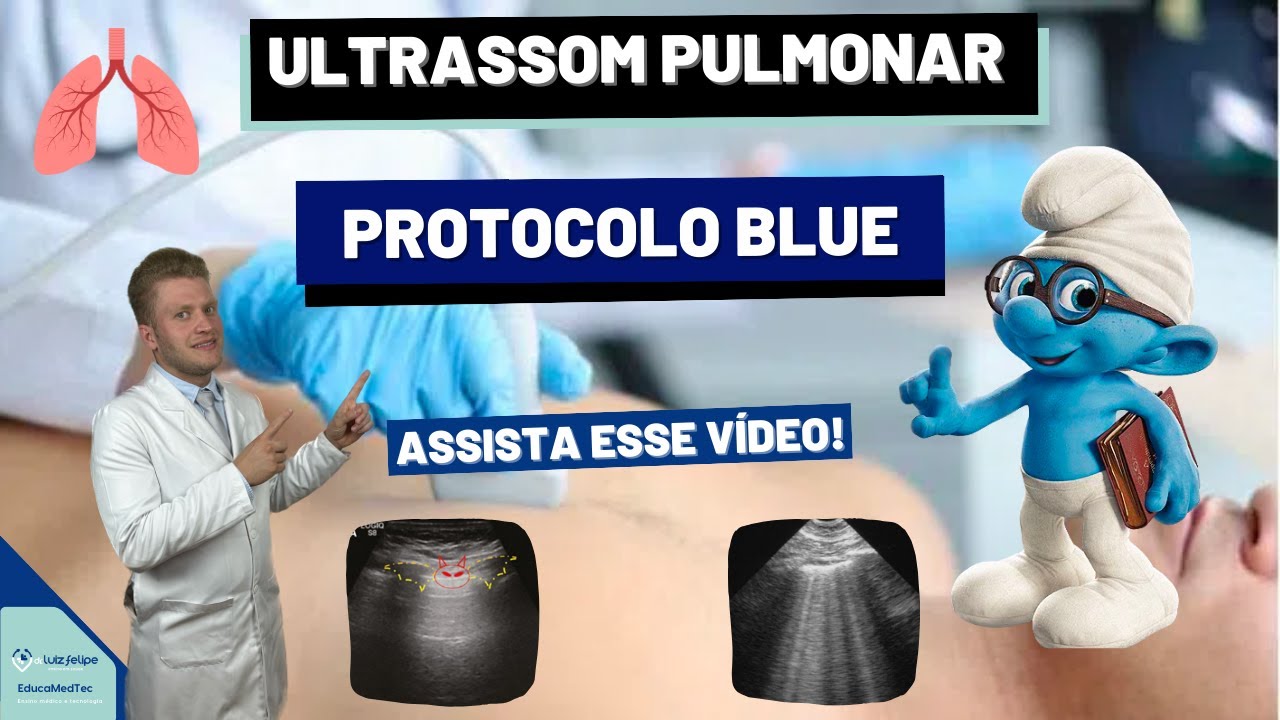
Mastering complementary diagnostic ultrasound protocols, such as the BLUE protocol for acute respiratory failure and the FAST/eFAST exams for trauma.
Differentiating complex, mixed shock etiologies (e.g., combined septic and cardiogenic shock) through serial ultrasound evaluations.
101 views3likes53:15Original Release: 2025-12-27
Hi everyone, my name is Dr. Patel and I'm an emergency physician at the University of South Florida and at Tampa General Hospital. Today we'll be talking about the hypotensive patient, a systematic focus approach.
I have no disclosures to report. Here are some of the objectives that we'll be covering today. I want to help you appreciate how Pocus is a tool in a global assessment for your patient.
We'll be talking about how to get essential views, what pathology can expect, and how we can synthesize all of that into different shock phenotypes. We are not going to be talking about the management of shock. And this talk is intended for novice and intermediary pocus learners. With that in mind, we've excluded more advanced techniques.
These are the major shock states and a list of differentials we hope to evaluate with pocus. uh with obstructive shock we will identify tension pneumothorax a massive PE or a paricardial tampenade with cardiogenic shock we'll be talking about LV RV and bentricular failure we will not be talking about LVOT obstruction or valvular disease contributing to the cardiogenic shock with hypoalmic shock we'll be looking at fluid loss or blood loss and with distributive shock we'll be equating that with septic shock since neurogenic anaphylactic shocks will have a higher reliance on history and examination.
So here are some of the findings that I'll touch upon right now and then we'll review this at the end of our talk again. So with obstructive shock because we have impaired filling of our right heart that fluid is going to be sent backwards into the Venus system. We can use the IBC to reflect this degree of retrograde flow. We will identify a large non-colapsible IBC with evidence of one of these three findings. So a large non-colapsible IBC with RV strain is going to be your tip off for something like a pulmonary embleis, RV infar or RV failure. Large non-colapsible IBC with a large paricardial eusion is going to be your tip off or cardiac tamponade. Similarly with absent lung sliding, this is going to be your tension pumothorax.
With cardiogenic shock, we'll identify a low LVF with diffuse belines in multiple lung zones and that is going to be paired with a large non-colapsible IVC.
Now with hypoalmic and distributive shocks just using pocus alone, it's quite difficult differentiating the two.
Both of these will have the same findings of a hyperdamic LVF with a very small and collapsible IVC. This is where your history, your examination really comes into hand because you'll want to know if there is a suspicion for a blood loss, volume loss, or if there's a source of infection to help you decide which pathway you'll go down. Now, of course, your patients may have mixed shock states that may make interpreting some of our findings more difficult, but that is beyond the discussion of our talk today.
Here's the mental model I'd like to share with you. For that patient who just arrived to your unit or the one that is decompensating right in front of you, there's always a degree of uncertainty when you're approaching that patient. We'll approach the bedside.
We'll do a thorough agent, review what information we already have. If available to us, we'll rely on invasive monitoring and then we will use focus as the final piece in this puzzle to help provide some degree of clarity. This ultimately will help us arrive to a narrowed differential and if not maybe even having identified the pathology and let us take the next steps. Now pocus doesn't replace any of these but is an essential adjunct in making for a comprehensive evaluation.
Now why pocus exactly? We should be considering pocus for shock because it's been studied to reduce a number of differential diagnosis. It's been shown to have high accuracy with the correct final diagnosis and we can achieve that correct diagnosis in a fraction of the time likely on the order of minutes.
Here are some of the studies that have been shown to have favorable test characteristics with regarding pocus and shock. Now ultrasound also avoids some of the other risks to the patients like ionizing radiation. We no longer have to schedule a departure from the unit. It's been shown to be cheaper than some of the alternatives. And because it's point of care, we can change management in real time. And unlike relying on more advanced imaging modalities, we can often have a suspicion, an answer, and a plan within minutes.
Like any other skill, the quality of our findings and their interpretation is operator dependent. And I if you are regularly caring for critically ill patients, I believe a strong foundation in Pocus can help elevate the standard of care that's being provided.
Now, here's a sample of various ultrasound protocols for shock that have been proposed. Long story short, all roads lead to the same place. If you look closely, they're evaluating the same structures. None of them have been evaluated head-to-head in a randomized fashion. We today will be using the rush protocol as a basis for this talk.
Should you like any one of these protocols or have familiarity with an alternative instead, feel free to use that one as well.
So the rush protocol was first ideiated in 2006 by Dr. Weineard and colleagues and it was published in 2010 by Dr. Pereira and colleagues. It's the rapid assessment of key structures to help clarify the driving ideology. And everything is in the name right there, rapid ultrasound for shock and hypotension. A systematic review and metal analysis actually reported a sensitivity of about 87% and a specificity of about 98% for identifying the type of shock using this exam. Now it starts with the heart and works its way down the list moving on to the Morrison's pouch, splinternal uh view, the bladder views, then looking for the aorta and the pulmonary views.
In that paper and in the protocol, they proposed a highmap pneummonic to help us remember the order in which to evaluate.
They start with the heart, then the IBC, they look at Morrison's pouch and the fast views, then they take a look at the aorta, and then they move on to the pulmonary examination.
These findings in this order helps clarify the phenotype of shock. On the right side of the screen, they also proposed a analogy of the pump, the tank, the pipes as a framework, as another memory aid on what to evaluate for each organ system in the protocol.
Now, the heart is the pump, the peritineal, the plural cavities, and the IVC together are the tank. And the pipes will be the aorta and then lower extremity veins. And you can see exactly what we're evaluating for at each of these spots.
Now the analogy I want to share with you all is that the heart is the engine of the body. So all of the protocols will start here. If an unstable patient arrived to your unit, this is where I would start. If a previously stable patient is starting to decompensate, this is where I start.
So starting at the heart using the views you learned in the previous lectures, I'd like you to evaluate for three big things. The three big questions to ask yourself is that is there a large paricardial fusion? Is there any right ventricular dysfunction or strain? And how is the LVEF looking? Here's a clip of a patient with cardiac tampenade. And you can see the right heart chambers collapsing against that very large anacoic fluid collection.
Here are some of the findings you can expect in cardiac tampon. Because the right atria is the lowest pressure chamber of the heart, it's also the first to collapse against increasing paricardial pressures. The next chamber to collapse is the right ventricle. And once the right heart is collapsed, all that fluid will be transmitted retrograde leading to a large non-olapsible IVC. For the sake of completion, I'm mentioning mitro valve inflow velocity changes. However, this is an advanced topic beyond the scope of our talk. Here are some clips of a paricardial fusion causing cardiac tampenade.
Here you can see the large paricardial fusion. You can see the right heart chambers that are collapsing and we see a large minimally collapsible IVC.
After a fusion, you should evaluate for any right ventricular dysfunction.
Here's a clip of a patient with McConnell sign. You can see that the RV apex looks as if there's somebody jumping right on top of this. This is a highly specific finding for a pulmonary embolis. If you have a poorly functioning RV, but the LV looks okay, this could be a PE, RV infar, or RV failure. This is because the RV delivers blood to the left heart. And if this is disturbed, the underfilled left ventricular cavity will try to adapt by beating harder and faster. If you notice bio ventricular dysfunction, this is likely cardiogenic shock that's developing.
Here are the major things to look for to suggest RV dysfunction. Unlike the muscular LV able to tolerate high after loads, the RV has evolved to pump against a lower resistance. As it starts to fail, the RV cavity will start dilating in general and will start approaching the size of the LV.
Normally, the RV is 2/3 the size of the LV, but with a severe insult, it approaches the LV in size and can even take over the apex right over here. In the perial short axis view, you may see bowing of the septum into the left ventricle known as the D-shaped septum.
The RV, which normally contracts in a parameal fashion, may be stunned and unable to do so. And this can be measured by a tapsi that's less than 1.6 cm. This patient had a tapsi of 1.4 cm, suggestive of right heart dysfunction.
We already talked about McConnell sign for PE just before. And for the sake of completion, I measure RV wall thickness for acute versus chronic strain. And we'll talk about this at the end of the talk.
Lastly, you want to evaluate how well the left ventricle is functioning. Big picture, you want to know if the LVF is high, normal, or low. Here are some examples of a low LVF. Notice that the ventricular walls are barely coming in contact with one another. the mitro valve is quite a distance away from the septum. Here we have a clip of a patient with a normal LVF where the mitro valve is coming quite close to the septum. You can see what appears to be normal contraction. And on the patient on the right side here, we have a very hyperdamic EF. You can see that the ventricular walls are kissing one another and that the mitro valve is slapping the ventricular septum as well.
If the LV appears very low, this is your sign that this could be a cardiogenic shock developing over here. If the LVF appears normal, this may be a sign that the heart may not be the problem. If the LVF appears high, this may be a sign that the heart is compensating for another process like bleeding or sepsis.
One of the nice things about point of care ultrasound is that you can compare your findings against what we already know about the patient. So for example, let's say if your patient had an echo done just a week ago, you can compare what you're seeing now against what they just had. You can also perform this examination serially. So for example, if your patient is in septic shock and hasn't yet received the initial resuscitation fluid and antibiotics, you may find that the LVF appears to be hyperdamic, something closer to this.
And then once the patient is in your care several hours later, you may find that the LVF may have normalized after the resuscitation.
Now when the LVF becomes severely low, that's when we start thinking about cardiogenic shock, blood is going to go from the left ventricle into the pulmonary veins, then into the right heart, and then backwards into the IBC.
As the degree of shock worsens, this will manifest itself on pocus as a syndrome of a low LVF with Veline morphology in multiple lung zones with a very large ample IVC. This syndrome is very similar to a decompensated heart failure patient, but we're not seeing signs of imper perfusion in the isolated heart failure patient. Now, if your patient has altered mental status, cold extremities, signs of congestive hepatopathy, nephropathy, these are your tip offs that this is now a cardiogenic shock picture developing. Now, today we're discussing only this subset of cardiogenic shock. I understand that there are high output states, valve disease, ariththmogenic ideologies, and other types of cardiogenic shock, but that's beyond the scope of this talk today.
Here is an example of some clips you may see in a patient with cardiogenic shock.
The LVF is low. We see global hypocinesis in the short axis view. We have bio ventricular dysfunction over here evidenced by a low LVF as well as a larger RV.
And we have a large non-colapsible IVC.
Putting all these patients together and somebody who's showing the signs of impaired profusion. This is a patient who's experiencing cardiogenic shock from bentricular failure.
Now how can we exactly measure LVs systolic function? There are a few different methods that I want to touch base on. Most simply, we can take a look with our eyeball to see how the LVF is.
Again, low, normal, high, like we just did. If you want to get more objective, we have measurements such as the e-oint septal separation or we can take it a step further and if we're interested in calculating actual cardiac output very quickly, non-invasively and at the bedside, we can use something called LVOT VTI to get just that. Again, we are trying to go left to right. We will anticipate more difficulty as we progress to the right side. though we will also have more accurate measurements of how our LV is functioning.
Again, you want to drive home the point that the categories of injection fraction are more important than the actual number. For example, low, normal, high as opposed to 50% versus 30%. For example, a newly reduced LBF would suggest something like intrinsic cardiac disease contributing to the shock state.
or if in the setting of septic shock may now be a septic cardiammyopathy. A high LVF may suggest the heart is reacting to another insult and these point of care findings can be repeated later again that same day after treatment or again several days serly to see how the patient is doing.
Here is an EPSS tracing for a patient who is found to have a severely reduced LVF. They had a EPSS of 1.6 6 cm which is just on the cusp of having a severely uh reduced LVF. Please see Dr. Dur's talk on cardiac pathology to learn how to obtain an appropriate EPSS measurement.
Taking it one step further, we can calculate an actual cardiac output in this moment without the use of a swan gans catheter or any other central line and AG combination and without the need to use the thick equation. All the blood that's leaving the heart on the way to the body has to go through the left ventricular outflow tract. And we can see exactly how much blood that is with our ultrasound machine. The LVOT or the left ventricular outflow tract is a cylindrical shape just like the one over here which is a conduit where the entirety of the cardiac output travels on the way to the body. I'll show you how we can measure the LVOT diameter and we'll use that diameter to get the area of this particular circle and which each contraction there's a particular stroke volume that is traveling through this area right over here. And using our machine, we can integrate this particular area here to convert the velocity and time graph into a distance in centimeters to get the volume for the cylinder, which we can then multiply by the heart rate using one beat to the next beat to get the cardiac output.
Please see Dr. Kibani's talk for an in-depth tutorial on how to obtain LBOT VTI measurements, but I will briefly mention it here.
To get the LBOT diameter using a pier long axis view we will identify the aortic valve and in midcysally what I want you to do is hit pause move the cursor around until you are able to see the hinges of the aortic valve and just on the LVOT side of the valve I want you to place your calipers right at the hinges a normal range is between 1.8 to 2 cm and this patient had a lvot diameter of 1.9. Now this measurement right here ends up becoming squared in the final calculation. So any error here will lead to a larger discrepancy in the final cardiac output measurement.
From your apical 5 chamber view, we will place our pulse wave Doppler gate right over the LVBOT where my cursor is. And we'll try to align the angle of our beam that comes from the top of the screen with the angle of flow right here.
Ideally, we'll be as parallel as we can or we'll have to use a little bit of an angle correction to help us get there.
If we hit the pulse wave dabbler button once again, we can get a tracing similar to what I have on the right side of the screen. To get to this particular tracing, I've had to make some adjustments with my baseline by dragging it up. I've had to change the scale of my uh tracing to get something that looks nice and triangular like this. And I've adjusted my sweep speed so I can get multiple contractions in one tracing.
Now once we start using the LVOT trace feature on our machine, we can actually trace the outline for each of these tracings to get a distance in centimeters that corresponds to LVOT VTI. We then take one beat to the next beat to get our heart rate. And multiplying all that together, we get a cardiac output.
The green tracing right here is where I've appropriately traced my LBOT VTI.
And to the right of the screen in this yellow arrow, I very intentionally overestimated this tracing. You can notice the black areas inside of that tracing that the machine is also including in my VTI measurement. And I've also intentionally used a higher heart rate than what I used over here from 94 to 105. And you can see how a very little change in the tracing from one to the next speed leads to a very large overestimation in cardiac output.
This is one of those skills where the more you do this, this you can avoid some of these errors and gain mastery.
Moving on from the pump in our analogy, now onto the tank. The tank will help us understand how much fluid is in our body and help us identify any body cavities where it may be pooling. In the rush protocol, there are three structures used to evaluate how much fluid there is in the tank. With the point of care ultrasound, we can quickly evaluate the peritineal cavity for introparitinal free fluid, the plural cavity for plural eusions or any other parankal disease and we can also estimate our right atrial pressure or our CVP using the IVC measurements. When evaluating the peritineal cavity, we are not able to adequately assess for free fluid in the retroparitinal space. So for something like a retroparitinal hematoma that may be missed with our point of care ultrasound evaluating the peritinal cavity, these are some of the fast views and specifically we'll be talking about the right upper quadrant, the left upper quadrant and two different orientations of the pelvic views. We are omitting the cardiac view since we already evaluated the heart in our earlier evaluation. For all of these evaluations, we are using a curve linear probe for the right upper quadrant and the left upper quadrant views. Imagine that there's a line that runs from the zyphoid process right here horizontally and laterally all the way to the edge of the bed. This is where we want to start with a probe marker facing towards the patient's head. You may have to do a s you may have to do a gentle rotation in the probe to align itself with the interccoal space right here and right over here. And that'll help you open up the space a little bit better.
Once you get the upper quadrant views, you want to go down to the pelvis. You want to identify the bladder in two different planes and really fan through the entirety to make sure you're not seeing any free fluid there. Some common pathology you may expect would be a sites in a serotic patient, intraabdominal hemorrhage from, let's say, a motor vehicle collision, a ruptured ectopic pregnancy, or ruptured AAA.
Here is a clip of a large anacoic fluid collection in the inferior tip of the liver. And this is what blood would look like. This particular patient was a victim of a motor vehicle collision and was found to have a small bowel injury and liver laceration as the source of their hemorrhagic shock.
in this patient on the left upper quadrant and they ended up having a spontaneous splenic rupture that was picked up on the peritineal cavity evaluation. You can see the uh lesion right in the middle of the screen right here in the pelvis. You may think that this is a very distended bladder here until you take a look at the end of the clip and you start realizing that there are loops of freely floating bowel inside of the peritinal cavity. This patient had large volume of sites and had a history of cerosis. They presented with abdominal pain and fever and they were found to have SBP with bacteria as a cause of their septic shock.
Moving on to the plural cavity. This is where we're looking for the tension pneumothorax, the pneumonia or the cardiogenic pulmonary edema or even plural of eusions that could be contributing to our shock. You have options here on which probe to use. You want to evaluate this space with either the linear probe that provides excellent resolution for superficial structures that can very easily and clearly identify things like plural disease. Or if you're suspecting more of a parankal disease like pneumonia, fusions or pulmonary edema may want to appreciate that more better with the higher depth that something like a curve linear or a phased array probe allows. Personally for this evaluation I use a curve linear probe and I adjust my depth up and down the screen to my liking. But you can also use something like the phased array probe which still provides comparable depth though that smaller footprint right over here is much easier to fit inside the intercostal space as opposed to the wider and thicker curve linear probe. But all both of these should suffice.
Here's a scanning strategy to evaluate from four different zones in each hemithorax. Here you can see I'm using a curve linear probe beginning in a sagittal orientation with the probe marker indicating towards a patient's head and I'm scanning superiorly to inferiorly in the anterior chest and then I'll do the same again in approximately the third or fourth intercostal space between the mid and axillary line and the anterxillary line superiorly to inferiorly and we want to report the pathology in each of these zones in our report here is anter alternative scanning pattern popularized by Dr. Likenstein in his seminal blue protocol that put ultrasound and pulmonary disease on the radar. Similarly, we start with a curve of linear probe in a sagittal orientation and we're sliding inferiorly and laterally towards the costal margin as in this tracing right over here. If you are highly suspecting a tension pumothorax in your hospice patient, you can scan the anterior chest. Thought being that tension pneumothorax causing obstructive shock is seldom a subtle finding and all that air in the supine patient should be located in the anterior chest. At zone two we're evaluating here for pulmonary edema and pneumonia. And in zone three here we're slightly higher than the fast view in position and we're evaluating for plural eusions.
Here's a demonstration of a scanning pattern where I'm starting in the anterior chest sliding inferiorly and then once I get to the approximately costal margin here I'll pick up my probe and I'll do the same in the anterior axillary line starting at the third intercostal space working my way down.
Let's say you start your scan pattern and you pick up some pathology. You can interrogate that space better by changing your orientation to 90 degrees, fanning through that space, and then continuing on your search.
Let's say you come across something that looks like this. Here we see two ribs and we see a plural line over here. You can make out some motion to the edge of the screen, but notice that the plural line here is immobile. In your shock patient, this is highly suspicious for attention pneumthorax. So, let's go ahead and confirm if this is the case.
What we did is we turned the M mode cursor on. We place it right in the middle of the plural line. And hitting the M mode button once again, we get a tracing that looks like this here.
Notice how all the lines in the top of the screen look the same to the bottom of the screen. And they're all nice and straight. This is something that's called the barcode sign. Because we want to make sure that we're not missing other disease, we'll compare it to the normal side. Using the mode cursor again, we place it right on the middle of the plural line. And with respirations, we hit end mode again. And we get this picture right over here.
I hope you notice that at around 2 cm of depth, right where that plural line is, that the lines in the far field here are much more coarser and more granular appearing in nature, as opposed to these relatively smoother and straighter lines in the near field. This is what we call a sandy beach morphology. The sand is all the way at the bottom of the screen here. The plural line is the water's edge and the straight lines on the top is suggest the horizon. This patient was found to have a tension pneumonthorax on the left side that we confirmed quickly with our bedside ultrasound and they are also found to have a large dilated IVC consistent with the obstructive shock phenotype.
Let's say we find this artifactual pattern instead where we are now seeing greater than three plus bel lines in this intercostal space and we're seeing that same beline pattern bilaterally. In the right clinical context, this is highly suspicious for pulmonary edema.
If you're seeing this in multiple lung zones and your patient has a low lbef, this is your tip off that this could be cardiogenic pulmonary edema that's causing your patient the symptoms. Now in your hospitalized patient fluid tends to accumulate in the dependent areas and then as the congestion worsens the fluid will start accumulating in the superior portions as well. When you start seeing these belines I encourage you to pay attention to the distribution of the beline morphology. Is it only in one zone on one side? Is it in multiple zones in the same side? Is it in the same zone on both sides of the chest? or is it in different zones on both sides?
In the end of the talk, I'll talk to you about how there is a differential for this beline artifact aside from just cardiogenic pulmonary edema.
Let's say you come across something that looks like this. Uh the patient on the left side was found to have a subplural consolidation with violation of the normal straight thin plural line up at the top. And we also see hypercoic fosai within this. This is termed the shred sign and these are air broncograms within the actual consolidated lung highly suggestive of a pneumonia. The patient on the right here had a unilateral large simple plural eusion.
Once a thorosentesis was performed on this right here, it ended up finding a malignancy that was actually the tip off to the clinician that the state of shock for their patient was actually something like a PE as opposed to iocardiogenic shock. Moving on from the peritineal and plural cavities now onto the IVC. The IVC is our measure of Venus capacitance.
Because the Venus system is the capacitance system and all the veins lead to the heart, our assessment of the IVC size and collapsibility is our measure of how full our tank is. Another way of saying that is also how congested is our Venus system. The interpretation of our findings will require a measurement of the IBC size and the degree to which it's collapsible. And we notice that these two taken together correlate pretty well with the right atrial pressure. And because the right atrial pressure does not or the right atri does not have any valves between the vennea, this is effectively the CVP.
This interpretation of our findings does depend if our patient is spontaneously breathing without any positive pressure ventilation. Uh this is relevant because when we introduce positive pressure ventilation, we are increasing intrathoracic pressures which will manifest itself as a larger IVC that is not as collapsible. So for you and I, if I were to measure our IVC's, I'd measure the diameter. Then I'd use a cutoff of 50% for collapsability. Greater than 50% collapsability would suggest fluid responsiveness. and I can give you more fluids. Less than 50% collapsible would suggest a higher CVP and I should be judicious with my additional fluid because we know that a positive pressure ventilation will increase the size and reduce the degree of collapsability in your intubated patient. A small and collapsible IVC would suggest truly a fluid tolerance.
We'll use the size of 2.1 cm as our distinction for small and large.
Anything less than 2.1 cm is considered small. Anything larger than 2.1 centimeters is considered large and again depending on the use of positive pressure ventilation will use whether either 50% or 18% for the degree of collapsability.
You can measure the IBC from the subcoid view changing your indicator towards the feet or you can also obtain this view in the right upper quadrant view. Looking at diabet like we talked about we'll pair the size and degree of collapsibility together to measure our right atrial pressure. 2.1 centimeters is a cutoff and 50% is a cutff in spontaneously breathing patients.
At the top and the bottom of the screen we'll notice the extremes of the situation. Here we have a small and highly collapsible IBC suggestive of a low right atrial pressure. This is the patient in whom you can consider additional fluid resuscitation.
Conversely, if you have a patient that has a large and minimally collapsible IVC, this would suggest a right atrial pressure that's elevated and you should either minimize or avoid additional food resuscitation. And if your patient is still showing signs of shock, consider something like either diaresis or inotropy or presser.
validation studies have shown that when co correlating the size and collapsibility of the IVC to the right atrial pressure really at the extremes so either at the top of the screen here or at the bottom of the screen perform very well but these findings in the middle the rap measurement tends to be more variable that's just something to keep in mind here are some different phenotypes I want to share with you of your IBC putting together what we just talked about on the left Here we have a very small and very collapsible IVC. The IVC is so small that it almost goes in and out of the screen. That's difficult to appreciate. Here in the middle of the screen, we have a small IVC that measured here at 1.3 cm, but you notice the walls are not come collapsing greater than 50%. This would suggest a medium right atrial pressure. In shock for this patient here in the middle, you can perform a more detailed assessment of volume responsiveness and fluid tolerance or you could provide a low volume resuscitation and then reassess to see if that improved your cardiac output. And the patient all the way on the right over here, they have a very large IVC that is very minimally collapsing and this would suggest a higher CVP. In the setting of shock, this patient right here is unlikely to benefit from additional fluid administration.
And just putting it all together, you can see as the size increases and as the collapsibility decreases that you have an increase in your CVP.
Here's a video demonstration on how to actually measure the size and the degree of collapsibility using the M mode feature. Ideally, you want to have the picture of the IVC that is draining into the right atrium right over here. And you're able to see the hpatic vein draining here as well. You want to place your emote crush approximately 2 cm distal to the right atrium and try to get it as perpendicular to the IVC as you can. Using the calipers, you'll measure the minimum and the maximum distance of that IVC. And the computer will measure the degree of collapsibility right over here. So for example in this patient they had a small IVC less than 2.1 cm and had a non-colapsible IVC which is just a medium range CVP of about 5 to 10 mm of mercury.
Your machine also has an automatic IVC feature to help measure the maximum and the minimum and to calculate the collapsibility index for you. Just be mindful that the machine is placing this cursor and that should you disagree with it, you can click and drag to readjust it. This particular patient again had a very small and minimally collapsible IVC here.
Now that we've seen how well our pump is working, let's go see how well our tank is. And now after that, let's go ahead and examine how our pipes specifically are doing with regards to our looking for a AAA or a DVT. Now, while DVT itself is unlikely the source of obstructive shock, this should raise suspicion for a pulmonary embleis as the likely source.
Unlike a dedicated talk on evaluating for AAA's, we are interested in identifying whether our AAA seen right over here is a cause of shock. And with that in mind, I'd like to propose a more abridged evaluation of the abdominal aorta. Because we know that greater than 90% of all AAA's are infraral, what I do is I start inferiorly and I slide superiorly using a curved linear probe.
And I'm looking for a binary size of 5 1/2 cm. More or less. Is my aorta greater than 5 1/2 centimeters or less than 5 1/2 cm? And if my patient's in shock with a greater than five and a half sized aorta, I'm going to presume this is the ideology of shock until proven otherwise.
Here we have a clip of a patient with a very large AAA that has this is the actual lumen. This is a contained rupture and this is a very large neural thorus.
So starting in the transverse orientation approximately at the level of the umbilicus. I'm hoping to first identify the bifurcation of the abdominal aorta into the common iliacs.
Once I see that then I'll start sliding superiorly noting the approximate size of the aorta to complete the exam. I travel all the way up just to the level of the zyoid process. From the transverse orientation I then switch to a sagittal orientation and I run the entire length of the aorta as much as the patient's body habitus and their windows allow.
there tends to be lots of bowel gas obstructing our ideal view. So here in this clip, what I'm doing is I'm essentially trying to jiggle that bowel out of view. And once I provide some pressure and some great compression, I will continue sliding with that increased pressure to keep all that bowel gas displaced to give me the best chance at visualizing the aorta.
This is what you can expect to find with the probe indicator to the patient's right here. We'll first identify the vertebral body evidenced by the hyperccoic contour that's shadowing. The IVC will run on the right side of the body and the aorta will run along the left side of the body. And you can see both of those structures here. You can also compress and notice that the IVC right over here is more collapsible than the thicker walled and pulatile aorta.
Now, while an aorta diameter that's greater than 3 cm is abnormal and diagnostic of a AAA with your patient in shock, the size measurement that you care about is 5 1/2 cm. And if you have a patient who is in shock with a AAA visualized of at least this uh diameter, go ahead and evaluate your fast views to see if there is evidence of intraparitinal extension. Despite the abdominal aorta being a retroparitinal structure, we have seen multiple times that large ruptures do extend intraparitinally. And this is something you could pick up with your bedside examination.
Here's a clip of just an outer wall to outer wall measurement. Outer wall to outer wall measurement again. And this patient had a 7.6 by 8.14 cm size AAA and was ultimately taken for emerent intervention.
Here in a sagittal view, we also want to image the aorta just to make sure that we're not missing any secular aneurysms.
I mentioned that for the sake of completion, but it's really the size, not the shape of the aorta that we care about in regards to shock.
The last part of the protocol is evaluating for DVT in the lower extremities, and that's partly to raise our suspicion for a massive PE. Some patients may have very difficult echo windows. So finding a DVT in these areas may be enough to possibly even thrombolize your patient. Unlike the more comprehensive examination performed by synenographers, we're doing a simple threepoint compression test at these three areas to evaluate for DVT.
And this examination requires a linear probe. Though if your patient is larger, you may have to use a curve linear probe and they both will get the job done. The validation studies have shown very favorable test characteristics of a sensitivity of 94% and a specificity of 92% for ruling out lower extremity DVTs requiring anti-coagulation.
Here is a diagram of the lower extremity veins. We want to compress the veins and we're anticipating that the veins should ideally collapse. If the vessel walls do not entirely collapse with our pressure or you start seeing echogenic material within the lumen, this patient has a DVT and you should consider massive PE for your shock patient. We really want to image and compress the veins with our probe in these three spots right here.
The staff formoral junction is where the greater saphinous vein seen all the way on the right side of the screen will come off the common formoral vein. We want to compress right here. And then moving approximately 2 cmters inferiorly, we want to compress the femoral vein right here as it runs alongside the femoral artery. And then inferiorly, we want to compress at the pablatil fossa. If your patient is able to cooperate, we may try turning the patient's leg via external rotation and having a slight bend at the knee to help image more easily. From a point of care perspective, we do not image below the knee as these DVTs seldom embleize or require anti-coagulation.
Here's a video of my colleague performing compression of the lower extremity vessels. She's starting with the linear probe in a parallel fashion at the ingral crease and every few centimeters she is moving the probe inferiorly and using the probe to compress the Venus walls together.
Now although we only care about these particular areas, you can increase the sensitivity for ruling out a DVT by performing more compression at more spots down the leg. And lastly, we have uh evaluation and compression of the papil fossa. Just here here is a clip where at initially we see compressibility but as we move down the leg at the formoral level we actually see an echogenic thrombus within the venus wall and that the venus walls right here are not collapsing. In the start of the clip we actually have the greater saphinous vein at the top of the screen and we actually identify the safal junction right there and then as we move inferely we notice that the vessel walls just aren't collapsing.
This is what a DVT looks like on your bedside exam.
Here are some more clips of a non-compressible uh left femoral vein right here. And the picture on the right side, this person is providing enough compression of the popatil area that the paplotil artery is compressing, but the papal vein on top still is not compressing. This patient had a popilial DVT right here.
Now that we've seen the pump, the tank, the pipes, let's put our findings together into our shock phenotypes. In trained hands, this entire exam takes less than 5 minutes to perform. And when you perform this examination, you should ideally leave the bedside with a narrowed differential of what could be going on and with a better idea of how you're going to now manage your patient.
To review again the shock stage we talked about earlier. For obstructive shock, we anticipate finding a large non-colapsible IVC with evidence of right heart train to suggest a PE. A large paricardial fusion plus a large non-colapsible IVC to suggest cardiac tamponod absent lung sliding to suggest tension pneumothorax.
With cardiogenic shock, we anticipate finding a low LVF. With diffuse belines on our plural examination with a large non-colapsible IVC with hypoalmic and distributive shocks, we anticipate finding hyperdamic LVF with a small collapsible IVC and then really using our history and exam to then lead our suspicion for either a septic or a volume related ideology.
Touching briefly on hypoalmic shock, you can expect a small collapsed YVC with the hyperdamic LBF. The next question then should be driven by your suspicion if this is a blood loss or if this is fluid loss. And if there is blood loss, is this external to the body such as in a trauma or is this internal in the body? We can evaluate some of the internal body cavities with our fast views, especially looking for something like a triple A in the infraal area. And if we do find any evidence of hypoalmic shock, we can provide fluids, bloods, and reassess our patient.
This is where I really think pocus shines in the evaluation, treatment, and reassessment, and that has to do with septic shock. We will not be discussing neurogenic and anaphylactic shock in this talk. And here you can use ultround to evaluate for different suspected sources in your septic patient. You could also do a detailed assessment of fluid tolerance versus fluid responsiveness to decide what the next best treatment should be. Whether fluids, pressers, inotropes, diaresis or dialysis. And then based on your initial resuscitation, you can perform advanced techniques like LVOT, VTI or corateed blood flow or corateed flow time to decide the next treatment. Here are some of the sources that we were able to pick up on bedside ultraography. The top left, we have a shred sign. This patient ended up having a pneumonia.
Next, we were able to find a patient with colostitis, evidenced by a thickened gallbladder wall with a gallbladder that's filled to the brim with gallstones.
In the bactermic patient who then developed a red hot inflamed joint, they were able to use pocus to identify what appeared to be an unexpected joint eusion that they performed ultround guided artosentesis and made the diagnosis of a septic joint. The patient to the top right was sold to our team as having a cellulitis. But on pocus evaluation, they had a very large abscess cavity that required emergent surgical intervention. Again in the backic patient we used bedside ultrionography to identify a vegetation on the atrial side of the tricuspid valve right over here and we saw this upon admission. The patient had a formal TE done 2 days later which did corroborate that diagnosis but we were able to see it much earlier u than the formal diagnosis was made in the patient that's already been hospitalized is now having new right lower quadrant abdominal pain fevers and vomiting. We were able to find ruptured appendicitis as their source and in this patient we talked about earlier they had SBP and bacteria and underwent diagnostic and therapeutic paracentesis.
Yes, there are other sources of infection but I hope you can appreciate how broadly we can apply pocus when looking for a source.
That concludes our tour of the rush protocol for your patient in shock.
Lastly, I want to mention some limitations in focus that can be amended by the understanding the clinical context for your patient regarding the IVC and pitfalls in estimating our right atrial pressure.
This is one of the must-read papers and it shows different conditions that may confound our interpretation of the IVC and right atrial pressure. foremost regarding positive pressure ventilation.
Positive pressure ventilation will increase the size and decrease the collapsibility of our IVC artificially raising the CVP. The only situation in which you can use the IVC as a marker of right atrial pressure in a patient with positive pressure ventilation is if you truly are seeing a small and very collapsible IVC that is a true marker of fluid responsiveness in your patients who are experiencing an exacerbation of obstructive lung disease. All that air trapping is going to lead to higher intrathoracic pressures which may mimic the findings of positive pressure ventilation like before with regards to certain cardiac disease specifically right heart dysfunction and severe tricuspid regurgitation and some things like pulmonary hypertension. These patients will always have an elevated uh CVP measurement and this will confound our bedside assessment.
Additionally, we did not discuss the role of intraabdominal hypertension or pregnancy or something like a very large intraabdominal mass that can compress the IVC to make the IVC appear small and collapsible and falsely make it appear fluid responsive.
With regards to belines, here are some commonly encountered conditions that may mimic the bilateral 3 plus beline morphology that we typically associate with cardiogenic pulmonary edema. The three conditions I'd like to touch on are ARDS, restrictive lung disease, multif focal pneumonia, but differential also does include things like adalcttothesis and even early pneumonia as well. When you start seeing belines, I want you to encourage you to pay attention to the distribution of the beline morphology. Is it only occurring in one zone of the lung? Is it multiple zones in just one lung? Is it one zone on both sides and the same zone on both sides? Are you seeing asymmetry in the different zones bilaterally?
Depending on the distribution of that beline morphology and the clinical context, you could help understand what pathology you're dealing with.
For example, a patient right here in the middle who was found to have restrictive lung disease, they'll likely have a beline morphology wherever their disease exists. In the patient with a multif focal pneumonia, they may have an asymmetric or asymmetric beline morphology depending on exactly where the pneumonia is versus a patient with ARDS, they may have belines just about everywhere in their lung zone. Uh, and if you don't and if you don't see a reduced LVF, this may be a sign that this is non-cardiogenic pulary edema.
This is really where an understanding of your focus findings in light of the clinical situation will help you decide what really needs to be done.
Similarly, there are some mimics of abs and lung sliding. Lung sliding really occurs when you have the parietal and the plural viscera that are sliding past one another with respiration. Keeping that in mind, you can see how something like a main stem intubation would cause the appearance of absent lung sliding in the unventilated side. Because in the unventilated side there's no air movement here. There's no sliding to occur at the plural surface and that may mimic a pumothorax.
In your patient who has very emphymmitous disease and has known ble and blebs everywhere in their thorax, you can imagine how if that bleb is abudding the plural surface and you're imaging right on top of it that there may be absent plural sliding just wherever those bubs are. That's something to keep in mind, especially if you have old advanced imaging to review before you go to the bedside.
Lastly, in a patient who is having exacerbation of their obstructive lung disease, because of all that air trapping there's that there is, there's very minimal air movement occurring in both of these uh thoracic and because of that, you may have absent lung sliding.
This example right here highlights one of the main limitations of ultrasound and the main reason why the stethoscope still has relevance today. In obstructive lung disease, oscultation is what will since a diagnosis and not ultrasound.
Lastly, I want to talk to you about LBOT VTI. Now, I understand that using Doppler feature is an advanced technique. I also hope that you'll realize the potential of being able to measure cardiac output non-invasively quickly at the bedside.
So, when we're first learning this, I encourage you all to use the color box over the LVOT in your apical 5chamber view to see exactly what the angle of blood flow is. Once you see that, you can then better align your gate.
Because the Doppler gate only reports movement within the actual gate here, I intentionally place the gate over the septum. And then when I hit the pulse wave Doppler button, notice how I'm getting very low velocity readings here.
That's because the machine doesn't know to measure blood. It just knows to measure wherever I set my gate. And if I set my gate onto the wall, the velocity of that septal wall is much lower. Then when I readjust that angle and I put it in the actual LVOT, I get something more appropriate right here. Like any other skill, the more supervised practice you get, the more fasile all this will become.
Lastly, I want to touch on RV wall thickness and using this measurement to gauge if the disease process you are seeing is an acute process like a PE or if this is something more chronic like pulmonary hypertension, specifically pulmonary hypertension because of that longstanding elevated pulmonary vascular resistance. You will have remodeling of that RV wall. Over time, this will look like a very thick RV wall, which will develop the same findings like we talked about, such as the larger RV to LV, the D-shaped septum, and a reduced tap C.
Here we'll use a cutoff of 5 mm in thickness measured in the subzyoid view and end diastily.
So if I see markers of RV strain with a very thick RV free wall, the culprit may be elsewhere and not the PE that I had in mind initially. If I see my standard markers of RV strain and I measure a RV free wall thickness of less than 5 mm, this is my tip off that I'm that this is more of an acute process, maybe something like the PE occurring.
Now I hope you all learned something from my talk today. Thank you for your time and your attention. Here are some of the resources I used in preparing this talk. Should you have any follow-up questions, you can direct them all to my email over here.
Take care everyone.
Up Next

35:32
RUSH Protocol: Rapid Ultrasound in Shock Evaluation
@lizturner5127
122.5K views•2013-05-18

48:47
Graphic Medicine: Comics for Collaborative Healthcare Communication
@nationalpatientadvocate
189 views•2023-12-04

10:28
Neuroanatomy: Central and Peripheral Nervous System Divisions Explained
@AKLECTURES
136.2K views•2014-09-20
3:05
Stages of Labor and Vaginal Birth | Childbirth Animation
@nucleusmedicalmedia
52.1M views•2017-08-18
Related Study Plans & Knowledge Roadmaps
Structured learning paths in Medicine
medicine
Abnormal LFTs: Diagnostic Workup & Pathology
01Liver Anatomy and Basic Physiology
02Introduction to Liver Function Tests (LFTs)
03Hepatocellular vs. Cholestatic Patterns
+ 3 more learning modules
12h6 modules
Explore Roadmap
medicine
Analyzing Blood Smears: RBC, WBC & Platelets
01Introduction to Blood Components & Smear Preparation
02Normal Morphology of Blood Cells
03Erythrocyte Pathologies & Morphological Variants
+ 2 more learning modules
12h5 modules
Explore Roadmap
medicine
Mechanical Ventilation: Waveforms & Alarms
01Anatomy and Physiology of Breathing
02Introduction to Mechanical Ventilation & Core Modes
03Ventilator Settings and Waveform Interpretation
+ 2 more learning modules
12h5 modules
Explore Roadmap
medicine
Neuro Exam: Localization & Stroke Syndromes
01Foundations of Neuroanatomy and Vascular Supply
02The Neurological Examination: Step-by-Step
03Principles of Neurological Localization
+ 3 more learning modules
18h6 modules
Explore Roadmap