





















To read an electropherogram and identify DNA fingerprints, analysts must examine the peaks within each gene's designated region, determine which alleles belong to the major contributor by comparing peak amplitudes (where major contributor peaks are significantly larger than minor contributor peaks), and record the allele sizes on the CODIS submission worksheet while excluding artifacts like stutter peaks that fall below established thresholds.
How to Read an Electropherogram for DNA Fingerprinting
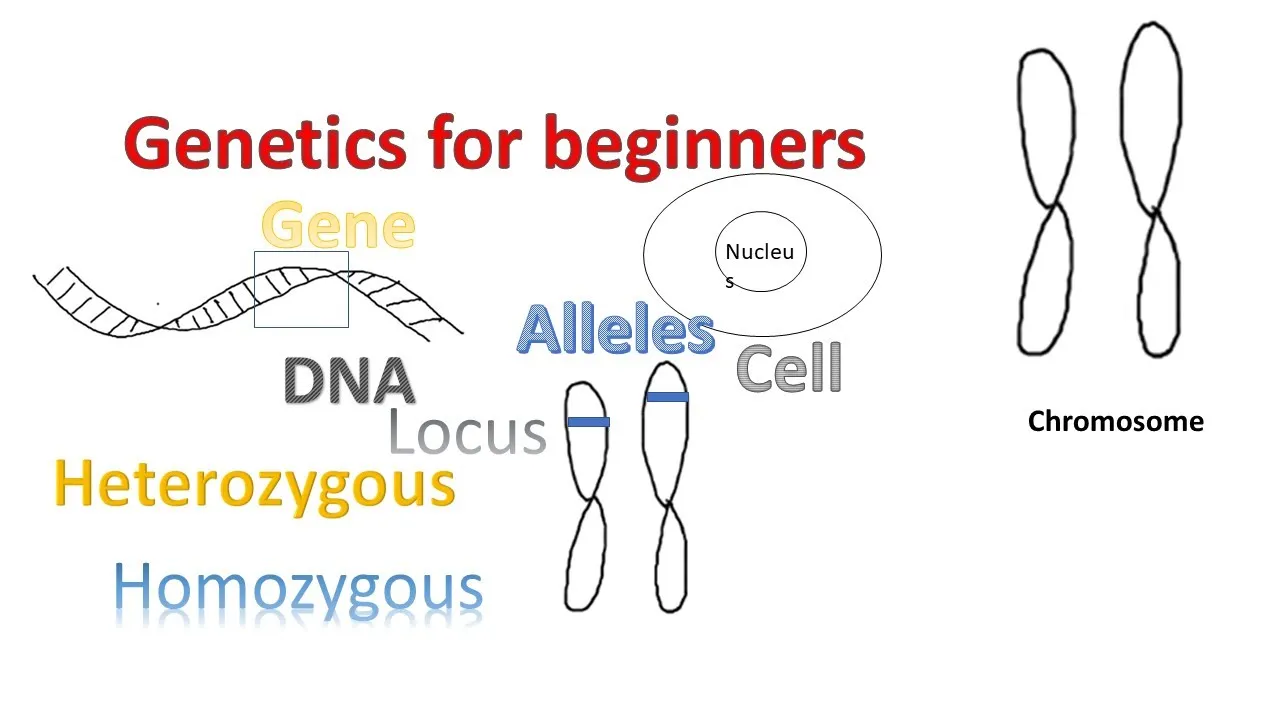
Added:Fundamental genetics concepts, specifically the definitions of alleles, loci, homozygosity, and heterozygosity.
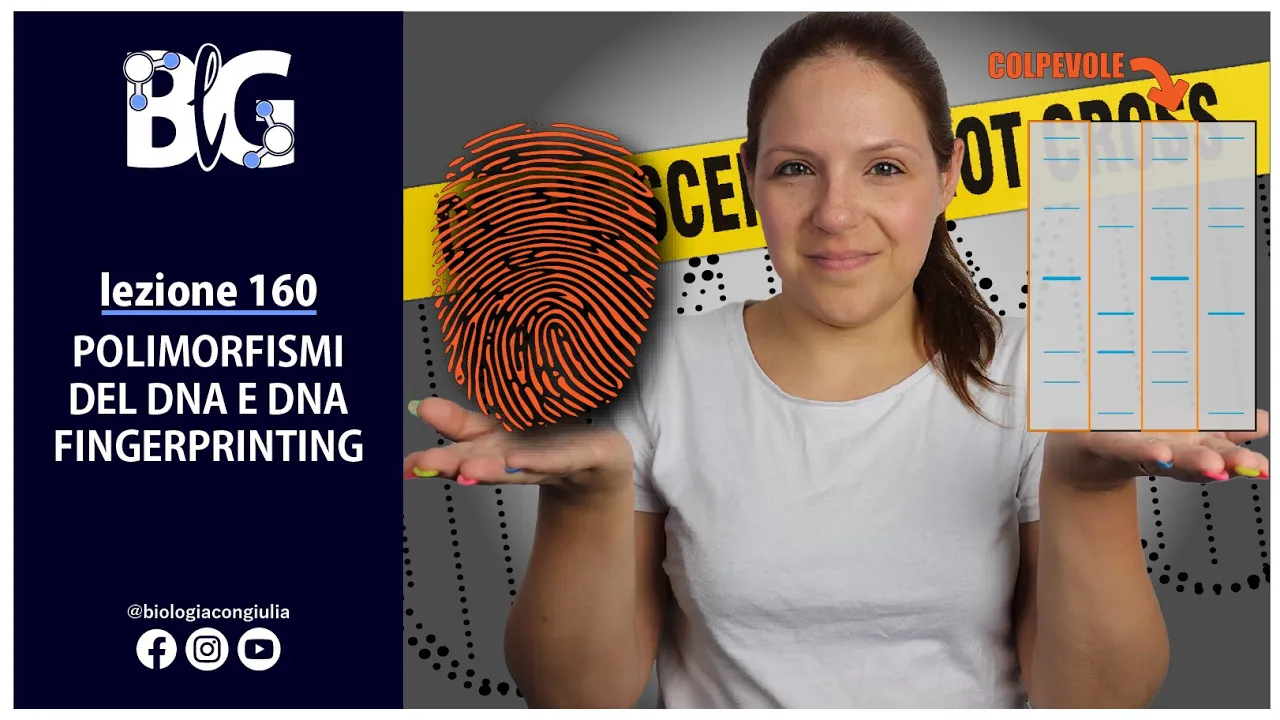
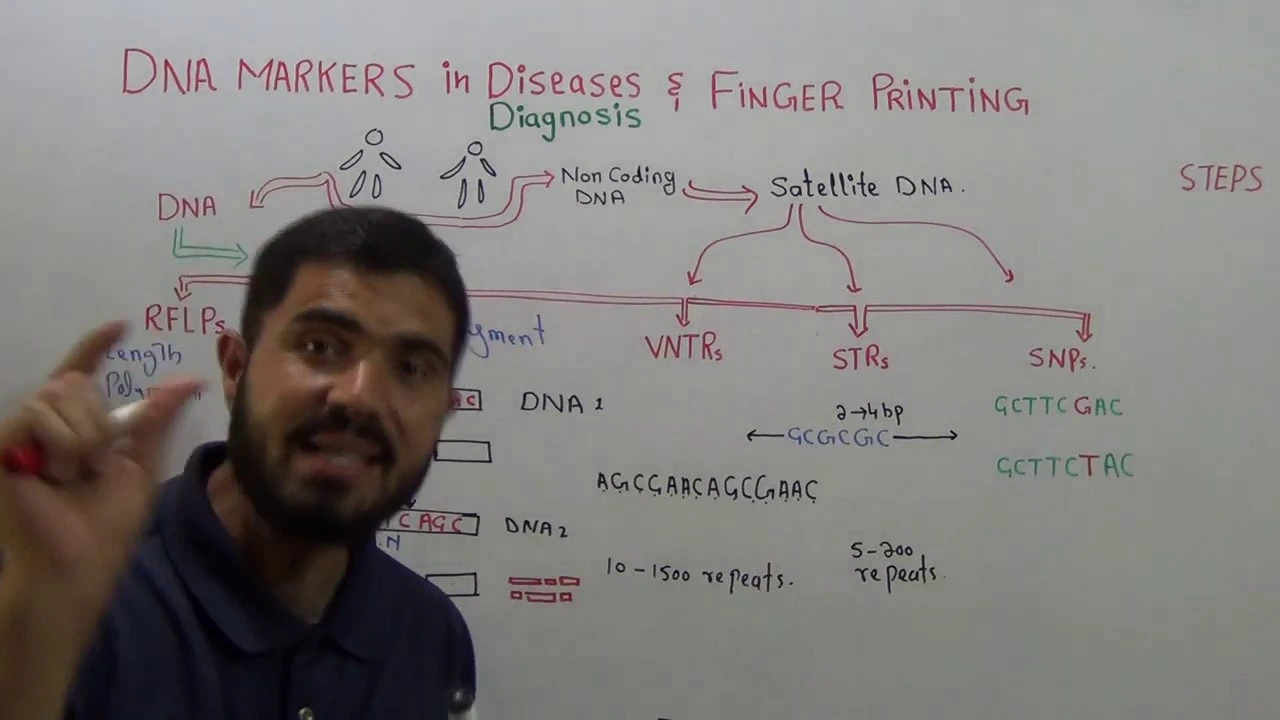
Understanding of Short Tandem Repeats (STRs) and how their length variations are used as genetic markers.
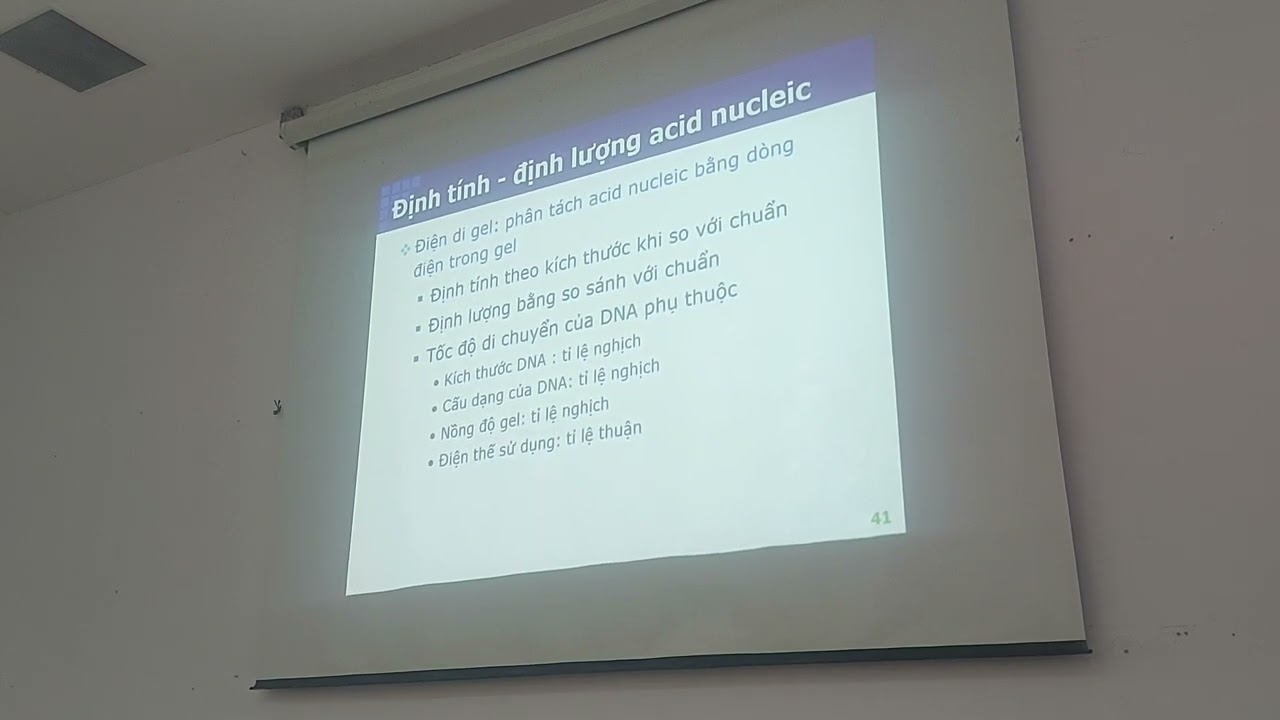
The basic principles of Gel and Capillary Electrophoresis, including how DNA fragments separate by size and electrical charge.
The role of the Polymerase Chain Reaction (PCR) in amplifying specific fluorescently-labeled DNA regions prior to analysis.
Interpretation of complex DNA profiles, such as multi-contributor mixtures, degraded DNA samples, and common artifacts like stutter peaks and pull-up.
Statistical evaluation of DNA matches, including calculating random match probabilities and using population database frequencies.
The real-world application of the Combined DNA Index System (CODIS) in criminal investigations, missing persons cases, and familial searching.
Emerging technologies in forensic genomics, such as Next-Generation Sequencing (NGS) and Single Nucleotide Polymorphism (SNP) profiling.
932 views16likes12:08Original Release: 2019-05-14
all right so I want to show you how to complete a CODIS submission worksheet which is something that you would fill out as you're reading through a DNA fingerprint next clasts you have some homework to actually work through a group of these so today we're going to talk about how to read through one decide if you have a single sample or a potential mixed sample and how you would copy this information of your alleles that you're seeing on your electropherogram onto your CODIS submission worksheet so the items up here are not horribly horribly important in fact we're not even going to worry about a case number so you can just put n/a for that for our item number each one of these sort of has an ID that goes along with it so this is h 0 1 so up here at the top underneath item number I'm just gonna type it right in H 0 1 and then give it a date completing this on the 13th please use whatever today's date is and then analysts this is where your name would go okay because you will be turning these in all right so over here at the side you'll notice that we have what was what's called the major and what this means is the major contributor so we talked a little bit last class about what it means if you have a mixed sample and that's where you you would actually focus over here to write all of your different alleles and then you're gonna look at the size of each of your Peaks to try to determine which major alleles might be present so what might be composed or composing the major contributor so who has delivered the most sample to that DNA that we've we've just run a fingerprint on so each one of these genes goes in order with your electropherogram so you can ignore this portion up here and we're actually going to start down here I'm going to zoom just a bit all right so our first gene that we're looking at is the d3s 1358 and you can see that here d3s 1358 so this bar up here encompasses the entire portion of the electropherogram that would contain data determined by this particular low sigh so we're only looking in this portion of our electropherogram for Peaks so you'll notice here that down here it seems to be that we're registering for different alleles and each one is attached through this little stick here to the peak that it belongs with so we have this peak I'm just gonna sort of highlight that that is the 15 repeat allele then we have the next peak in line which is fairly equal to that first peak and if we follow that one down that one belongs to the 16 allele then we have this little peak here which I'm not so sure we can consider an actual allele because it looks to be about the same as this stutter that we had over here so even though it's being picked up and it's registering as the 17 allele we have to ask ourselves can we include that in our DNA profile if all of the other Peaks are either in the you know 1000 to 1200 range and the other peak over here is in you know almost the 700 range this guy was barely 94 so I would say if this was me I would eliminate that I would include this peak though which belongs to 18 so over here on my form underneath mixture I'm going to write down this 15 16 and 18 again I don't think that little peak for 17 belongs there so I'm just gonna write 15 sixteen and eighteen okay we'll worry about our major a little bit later okay so let's look at our next th o1 again I'm going to zoom in here so we can see it a little bit better mmm so this bar shows us where we should be focusing on our th oh one so it begins where our d3 left off and it continues over here and again you can see that we have three peaks we have one at seven one at nine and a very large peak at nine point three so we'll come back over here and on our mixture alleles we've got seven nine and nine point three okay now when it comes to the major I'm just going to use these first two as an example when it comes to the major remember that the major contributors spikes should be much greater than any minor contributor so over here for our first gene our d3s 1358 I feel like we can probably say that 15 and 16 were very likely contributed from our major contributor alright so notice that that peak is about half that of this 9.3 peak well and that makes sense if we think about heterozygosity and homozygosity so here we have two alleles that are different from each other versus two alleles that are the same which makes sense why this peak is almost double what these Peaks over here are okay so when it comes to deciding on our majors we're gonna look at our peak values and I would say for this one for d3s 1358 15 and 16 belonged to our major contributor 18 belongs to our minor contributor okay so over here for our major contributor we would write 15 and 16 and for our th oh one again our major contributors see the size of this spike that tells me that the major contributor is homozygous for nine point three these two spikes seven and nine probably belonged to that minor contributor look at how similar those spikes are in terms of sample size okay so our major contributor for th O one is homozygous for Lille nine point three right so we can keep doing that by looking at each subsequent gene our next one on the block is d 21s 11 alright and again we're gonna be looking over here okay that was a fun little wheat so we can see a total of three spikes we've got one here which seems fairly equivalent to the spikes that we've been seeing for our minor contributor and we have another spike way up here he's actually going off the chart alright this spike is a little bit higher but notice it didn't register on the ladder so it would be off ladder so we know that we can just ignore that spike it was probably a stutter or some other sort of contaminants so our two alleles that are present for this gene is 28 and 30 so over here on our low sign marker for our mixture alleles will write 28 and 30 and again we're looking at those the the magnitude of these spikes so we don't have anything that was in the range of a heterozygous but our major contributor again appears to be homozygous for the 30 allele so for our major contributor for D 21 s 11 I'm going to identify that as 30 okay our next low sigh is dat Ness 51 right and here it looks like we have four alleles all of which are being registered I messed up a little bit we have the 14 allele 15 allele the eighteen allele which does register so it's on ladder and it's it's a decent I think this is beyond threshold if our threshold is down here I believe believe this is beyond threshold and then we have the twenty and looking at the the Peaks all right of these four which two would you say come from our major contributor just looking at the amplitude of these Peaks our major contributors should have the greatest amplitude hopefully you're in agreement with me that 15 and 20 appear to come from our major contributor so while this mixture contains four different alleles 14 15 18 and 20 in terms of our major contributor it would appear to me that peak 15 and peak 20 come from that major contributor because those two peaks have the greatest magnitude of the four that are present okay let's apply that same thought process to our Penta II right so here's Penta II there are four distinct spikes that are registered so we have four alleles present 5 7 11 and 12 and looking at the magnitude which two alleles belong to our major contributor hopefully you would agree with me that 7 and 11 get at 7-eleven Slurpee time 7 and 11 belonged to our major contributor so again as we're filling out our sheet for Penta II we have four alleles present 5 7 11 and 12 but in terms of our major contributor looking at the amplitude 7 and 11 would be the alleles contributed by our major contributor alright so I think at this point you should be prepared to look at the remainder of these genes and they go and order ok so taking a look here d5s 818 is here next in line on the back page d 13's 317 is the next and then you'll notice the the bars get pretty dark but it just goes in order so this would be d7 s 820 ok the next one would be d 16s 539 alright the next one would be CSF 1p oh alright and then we're right back where we were penta d ok so they just go in order so even if you can't read what it says in these dark bars it just goes in order with what is on your worksheet ok best of luck and I will see you next class
Up Next

12:08
Autoimmunity and Autoimmune Diseases: Causes and Mechanisms
@AKLECTURES
106.5K views•2014-11-20

50:12
Bacterial Communication: Quorum Sensing and Biofilm Formation Explained
@JHUAAP
12.6K views•2011-06-28

5:35
Enteric Nervous System Explained: The Gut's Brain | Neurobiology Lecture
@alumniu6029
438 views•2018-09-12

7:08
Bacteriophages: Earth's Deadliest Killers and Future Antibiotics
@kurzgesagt
34.6M views•2018-05-13
Related Study Plans & Knowledge Roadmaps
Structured learning paths in Biology
biology
RNAi: Biogenesis, RISC & Gene Silencing
01Molecular Biology Foundations: DNA to Protein
02Introduction to RNA Interference (RNAi)
03Molecular Biogenesis of miRNA and siRNA
+ 2 more learning modules
10h5 modules
Explore Roadmap
biology
Mycorrhizae: Signaling, Biophysics & Ecology
01Foundations of Mycorrhizal Symbiosis
02Molecular Signaling and Root Colonization
03Biophysics and Bioenergetics of Nutrient Exchange
+ 1 more learning modules
11h4 modules
Explore Roadmap
biology
Circadian Clocks: TTFL, SCN & Periphery
01Foundations of Molecular Biology & Gene Expression
02Introduction to Chronobiology and Actograms
03The Core TTFL: Molecular Architecture of the Clock
+ 3 more learning modules
14h6 modules
Explore Roadmap
biology
Population Genetics: Math, Drift & Selection
01Genetic & Probability Foundations
02The Hardy-Weinberg Principle and Baseline Models
03Mathematical Modeling of Natural Selection
+ 3 more learning modules
18h6 modules
Explore Roadmap