















Ground-level air pollution monitoring involves three main approaches: long-term monitoring stations using calibrated instruments for continuous measurements, field campaigns for intensive short-term studies to answer specific scientific questions, and exposure measurements to assess human health impacts; these methods complement satellite data by providing high-frequency time series data, verifying model accuracy, and identifying pollution sources at the local level.
Ground-Level Air Pollution Monitoring Methods Explained
Added:Understanding of major criteria air pollutants (such as PM2.5, ground-level ozone, nitrogen dioxide, and sulfur dioxide) and their basic chemical properties.
Fundamental concepts of atmospheric science, particularly the structure of the troposphere and how weather patterns influence pollutant dispersion.
Basic knowledge of scientific measurement principles, including calibration, detection limits, and the difference between active and passive sampling.
A general awareness of the distinction between satellite-based remote sensing and ground-level (in-situ) environmental monitoring.
Methods for validating and calibrating satellite-derived air quality data using ground-level reference monitoring networks.
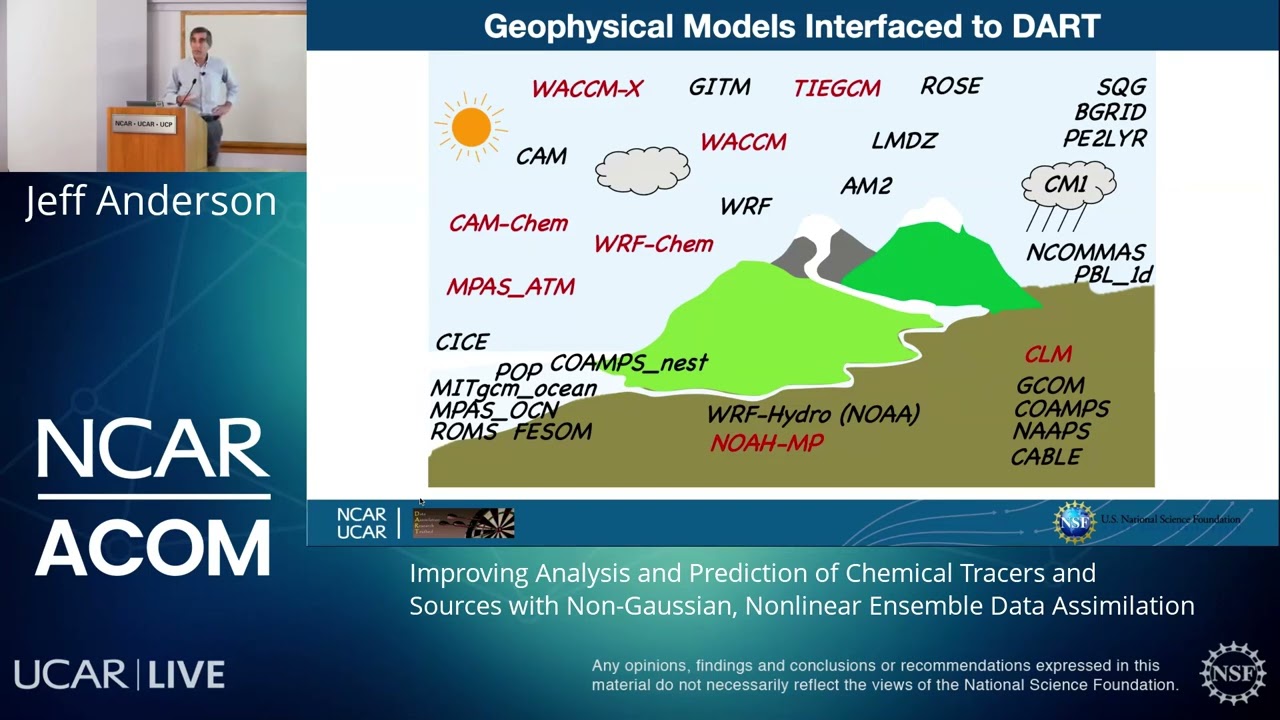
Advanced atmospheric chemistry transport models (e.g., CMAQ or WRF-Chem) and how they assimilate ground-level observational data for forecasting.
Principles of exposure assessment and environmental epidemiology, linking localized monitoring data to public health outcomes.
The deployment, calibration, and data-correction challenges of low-cost, hyper-local IoT air quality sensor networks.
Environmental policy formulation, such as how regulatory bodies use ground monitoring data to establish and enforce ambient air quality standards.
238 views2likes18:47Original Release: 2017-06-09
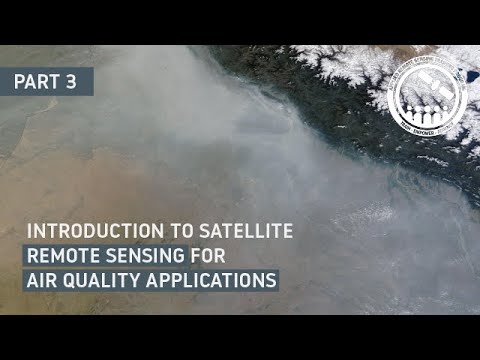
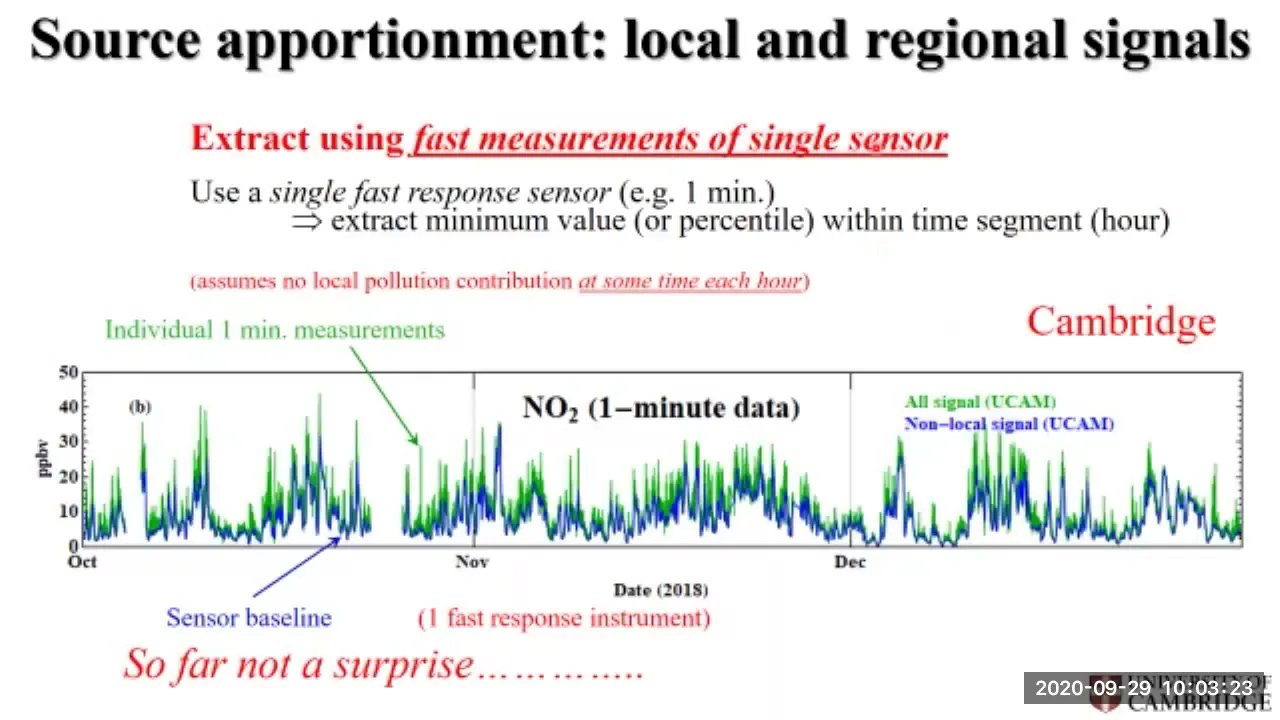
so as the cover image actually I put something that's different from what the topic is about we were talking another coach about where the haze and haze might have come from and what this is a satellite image that also has all the fire spots where big fires were taking place this was around 10:00 a.m. in the morning that we drove up to another code now record itself is here and so with a few hours very likely these fire the smoke from the fires would have come there this morning you already heard a bit about using computers to simulate air pollution and also using satellites to monitor air pollution over broad areas but data on the ground is still needed to give you a sense of what is happening at the ground level how to connect with our models working properly or not and also I mean what you're measuring from satellites does it make sense or not so there's a several purposes for ground level monitoring beyond that one is to assess what people are exposed to what you don't get directly from satellite measurements for example to collect high frequency time series at the same location if you have two satellite overpasses per day that that doesn't tell you what's happening at every hour every minute or so also ground level data helps better understanding of what the sources are of the pollution what the processes are in the station and the big truck passes and you see the signal from the truck and of course also verifying models and remote sensing I kind of divide up ground level measurements into three types kind of based on what what the purpose one is long-term monitoring at a single location the second is field campaigns and I'll tell you more about what those are and then the third is exposure measurements which I will not go into much detail here today so long-term measurement stations very often they're run by governments in some places by city governments often by national governments and they use durable certified instruments generally bigger heavier more expensive more power consuming instruments and what we carried another good but you'll get a surgeon will give you a tour of some of those instruments sitting in their container down the parking lot just after my after this session here one of the important things for good data is that the instruments are properly calibrated and I think so Jen will tell you a bit more about how the calibration happens making sure that if pollution is zero the instruments actually showing you zero and not showing you fifty or minus 100 and that when let's say actual pm10 concentrations are 200 microns per cubic meter that the instruments are showing you 200 and not showing you 150 or 300 or so that there's a lot of things that can knock off an instrument act accurate measurements and so calibration is active checking and readjusting the instruments frequently to make sure that what they're measuring at matches is what you're looking for also it's quite important for long-term monitoring stations to be a drought of lea representative locations so not next to a single local pollution source not next to right next to a very busy roads where the pollution levels go up and down very frequently because of passing traffic so next I want to show you a bit about what we're doing at EC mode in collaboration with partners at the moment in Bhutan and Nepal but with the expectation that over the coming years we'll expand our work into other AC mode member countries so one of our big tasks is to set up two background monitoring stations for monitoring both greenhouse gases as well as air pollutants at locations sort of over the Himalayan foothills mid hills at about 2000 meters altitude there's already a station at minora people near 90 town in India by having one DJ command Nepal engaged in Bhutan then we have a kind of south of the Himalaya inflow towards the mountain stations um we've been working on these for the last three years or so get planning to set these up both of the stations will be on mountain peaks the reason we want them on Peaks is that we want to be able to capture air coming from all kinds of different directions and we want them to be representative of a large area so it shouldn't just if you put a station right here you probably get the smoke from this house if you're up on the peak then the air that flows past from any direction it will be captured so stations and Peaks can capture air from quite representative Erik white broad distances and we can trace back where the air as the sec fluctuation the pollution levels and the in the data and you can trace back using modeling to see where the air might be coming from here's the view from Jeju looking down towards frontal in and kind of the site itself is on the peak near gaye do requires a little bit of a drive on a rough road and about a 45-minute walk to get to the top we choose Peaks that are not already full of infrastructure and full of access because we want no local pollution sources at the peak itself so the construction is going on right now for the gaiter station and the way it's designed will be a small building there with a tower the tower to take you above the trees and also to do wind measurements at 10 meters altitude and the bill there'll be a small public room and then to laboratory rooms office and storage space behind it with windows from the public room in so visitors could come and look into the labs through the windows and also this would be a training area or small Visitor Center this is a slightly old side we said expect completion by October it's now November and construction still going on but it's within the next couple of months it should be operational the access to Ichikawa moana is kind of similar from the paved road it's about an hour drive up to 16 kilometers up a rough road with very little traffic we want that deliberately and then from the point where you can stop from the vehicle it's still a 15 minute climb up 15 minute climb up from the nearest road you see this way to view over chitwan the operation on towards the indo-gangetic Plains the view to the north from ichika Moana you see the Manaslu Himalaya down below can anyone from Nepal guess what the what the place is here this is cool in there and then Monica mana is here so a teacher come on aware we're working right now with the forest in the environment ministry and acquiring a fairly large area of land as being restricted access land and then the at the peak itself a set up the station similar design to the one in Jeju slight adjustments for the local site this is what the peak looks like we were using some ropes to chart out the place where the station would go both sides are kind of designed to have space for additional instruments to come stay there long term or to come visit and apart from those two sites we're also working on several other monitoring stations one is down in lumbini and up in langtang at about 100 meters above sea level 5,000 meters above sea level where you have almost a straight line from limini to long-term passing through chicka Mona and then also urban monitoring stations in the Katmandu valley in bhutan also we're setting up a station down in básico the base below Jeju up in salalah and then an urban station in tempo in lumbini we already have temporary instruments on the water tank the final side is slightly away from there we have a 20-foot container delivered similar to what you see down in the parking lot and we're trying to and then at the high altitude sites in long tongue at 5,000 meters our colleagues who do glacier research already have a weather station in place and so we'll put in a an instrument to measure black carbon right next to it and over time add other instruments but of course there's no electricity line there so it has to be solar-powered or when powered said more challenging we've had some delays of course with long time after the earthquake but access is slowly getting restored in Chile Lavrov is waiting for a final permission this is probably the most accessible 4000 meters site anywhere in the Himalaya Pato Airport is just below so it's an hour-and-a-half drive from powder to here in about a 45-minute walk so you can have breakfast in Kathmandu and be at the side in 4000 meters insha'Allah and by lunchtime the air quality station in tempo my colleague sue John has here named Praveen who you met on Monday already helped set it up so we have a instrument measuring PM 2.5 PM 10 as well as a black carbon instrument already running being tested was working on data transmission issues from there and kind of waiting to hear when the formal inauguration will take place and I assume the colleagues from Bhutan in the room will all be there right now if you just walk up to a jewel is this relatively boring container there we're also working on designs for how to cover it with educational materials about air quality and of course we'll be happy to give you inputs about what you think will be useful for that as well okay now to move on about fill campaigns very often a scientific journal papers come out of not from long term monitoring sites those occasionally also but very often from field campaigns is a basically limited duration studies with multiple scientists often from multiple institutions sometimes from multiple countries would really a focus on answering specific questions specific question new questions new scientific questions that help explain something better so I mentioned briefly yesterday about the winter fog study that we're planning to do and so the winter fog study it's a field campaign but also more than just a field component itself will have coordinated measurements across the region as well as numerical modeling which Bhupesh explained using satellite data and then engaging social scientists to understand better the impact and connections to human activities what our hope is is both to come up with high-quality science publications but also policy recommendations like I mentioned yesterday after specific activities that are contributing to the table what are they and how do we reduce those and here is a map of a temporary map of the sites where we'll finalize those in the next two weeks about where the measurements are going to take place the motown site has now moved to faisal Abad for example in Pakistan that was just recently for I did this in spring 2013 we hosted a field campaign in the Kathmandu Valley of Sasuke a sustainable atmosphere for Kathmandu for the Katmandu Valley does co-branded with atmospheric brown cloud project he and I kind of led this thing and then but when the focus we're trying to understand the physical processes and dynamics of air pollution in and around the kabandha valley also understand better what the sources were so the intensive field measurements were over a half-year period we had quite an international team participating a data analysis workshop in August 2013 and just to give you a sense of the time scale of how things go in science finally now the papers are just starting to come out we have one or two that have been published some accepted for publication a lot going through peer review it takes a long time from when the measurements are carried out until we actually have detailed answers of the questions that we were asking that we're going to the sites or the measurements were taking place during subcat you're here at EC mode we were up in Naga Cote north of the road to never code there is a place called Bohr day where we had a super side which had all the instruments and then additional sides up on the ridge top on the mountain pass coming in to Katmandu getting the exchanges in the river valley down to the south and in the city center location across nigel as well this is from filter sampling like I showed this led before already I think I have to bore you with some graphs of data top one is black carbon measurements this one is ozone black carbon measurements ozone and coarse particles and small particles over 24 our parents so midnight noon midnight in different seasons you see in the monsoon is blue you see everything is quite a bit lower you see this morning and evening peak in pollution that I already talked about earlier except for ozone ozone forms in the atmosphere through chemical reactions so it needs and it actually needs sunlight to form so you see ozone growing in the morning and then decreasing again in the evening here are black carbon measurements over the whole over the six month period at several different sites and you see they follow a fairly similar pattern in the valley bottom locations in another quartz you don't get the morning peak the pollution sources are down in the valley if you look at just the board a side black carbon data again you see see this the seasonal differences and you see again the morning and evening high levels also we looking at a black carbon data collected here at EC mode we were comparing data from times when they were again over 24-hour periods times when there were power cuts and times when there are no power cuts what happens during power cuts your diesel generators get turned on and then in bore a which is close to the brick comes around bhaktapur the top data is just top one is just PM 10 the bottom one is different different minerals different chemical species that make up PM 10 so calcium chlorine sulfate sodium you see a sudden jump and increase in pollution around January 4th that's when the brick health started operating and this is how the brick home would look when they're actually operational when you were visiting they were not running it here isn't here the brick killed in the commando Valley on Google Earth I believe the one you visited was one of these over here see brick kilns are a big problem for air pollution against Gunda yesterday talked a bit about how there's also child labor issues and social issues associated with them but there's also an issue of loss of agricultural land because the RIC producers rent a lot of farmland to use the dry bricks so all these gray patches here what should be rice fields but they're being used for brick production see these are the actual rice fields here or the actual fields and so there's a loss of really fertile land for brick production okay now let me talk a bit about another seal campaign this one was focused on understanding emission sources and Prakash we met and Monday was the main person from EC mode leading it we want to understand the the chemistry of what comes out of different fires different emission sources so will it come as a collaboration between scientists here at EC mode and groups from six six scientists from universities in the u.s. who brought their equipment here and together they went around you know sometimes lighting garbage fires is here than they seem what parking lot as you recognize but also going to brick kilns going to a cook stove testing lab and then bringing in their instruments as well to test out various cook stoves in the lab setting or going out and measuring emissions from field and measuring diesel generators as they're measuring people generators pumps etc the plan was to have something like ninety ashore so different samples measured 54 samples were collected or tests were done before the earthquake and the whole team was on the road back to Kathmandu from southern Nepal and the earthquake hit and in April and so the project kind of got interrupted and we're trying to find a way the time for elder equipment to come back again to do further measurements but there's so they didn't get through all the intended sources yet wanted to do a lot more measurements of diesel truck emissions for example but at least got interesting data so far and what this data helps with is the improving the emission inventories that Prakash was talking about having better emission factors to go into the emission inventory they see field campaigns can be in very focused specific things okay let's get a bunch of scientists together and answer a few questions which is also ground-based measurements what is also quite common in some cities but we don't have any here to show you our mobile vans basically trucks that are equipped us with instruments that can be driven around parked in a certain location for a few weeks and measure what their pollutions like there before they moved on again I'll keep my presentation to this and I'll be happy to take questions and discussion
Up Next
117:57
Climate Change and the Maya: Ancient Lessons
@museumofscience
364.5K views•2016-05-05

15:54
Life in Biosphere 2: Sustainable Ecosystems & Human Survival
@TED
334.9K views•2009-06-16
14:30
Microplastics Everywhere: How Plastic Impacts Our Lives
@TEDx
100.9K views•2018-05-08
10:28
Ice Stupa Artificial Glaciers: Solving Ladakh's Water Crisis
@SonamWangchuk66
3.2M views•2015-05-03
Related Study Plans & Knowledge Roadmaps
Structured learning paths in Environmental Science
environmental-science
Ocean Noise: Cetacean Impacts & Mitigation
01Fundamentals of Underwater Acoustics
02Marine Mammal Bioacoustics
03Anthropogenic Noise: Shipping & Seismic Surveying
+ 2 more learning modules
16h5 modules
Explore Roadmap
environmental-science
Road Ecology: Corridors, Overpasses & Fencing
01Foundations of Habitat Fragmentation and Carnivore Ecology
02The Road Barrier: Ecological Impacts of Transport Infrastructure
03Principles of Ecological Corridors and Connectivity Mapping
+ 3 more learning modules
14h6 modules
Explore Roadmap
environmental-science
Ocean Acidification: Kelp Buffering & Shellfish
01Fundamentals of Ocean Chemistry & pH
02Chemical Pathways of Coastal Acidification
03Bivalve Physiology & Calcification Under Stress
+ 2 more learning modules
18h5 modules
Explore Roadmap
environmental-science
Ice Stupas: Glacial Retreat & Water Security
01Foundations of Glaciology & Mountain Hydrology
02Climate Change and Glacial Retreat Dynamics
03The Science of Ice Stupas & Artificial Glaciers
+ 2 more learning modules
14h5 modules
Explore Roadmap