Audio distortion becomes audible at different thresholds depending on three factors: pure tones are easier to detect distortion than complex music due to masking effects; higher frequencies (like 1 kHz) are more susceptible to distortion perception than lower frequencies (like 100 Hz); and playback device quality significantly affects distortion audibility, with devices having less inherent distortion allowing listeners to detect added distortion more easily.
Audio Distortion Threshold Test: Audibility Analysis
Added:Deep Dive
Basic acoustics and wave mechanics, including the physical differences between pure tones (sine waves) and complex signals like music.

Chapter 4 Sound | One Shot | Class 10 Physics Federal Board New Book 2026 NBF
271
Pure tones (like from a tuning fork) produce smooth regular sine waves on an oscilloscope. Complex sounds (like from a piano) produce more complex wave forms. Pure tones have simple timbre, while complex sounds have rich timbre because they include multiple frequencies and overtones.
Click to watch →
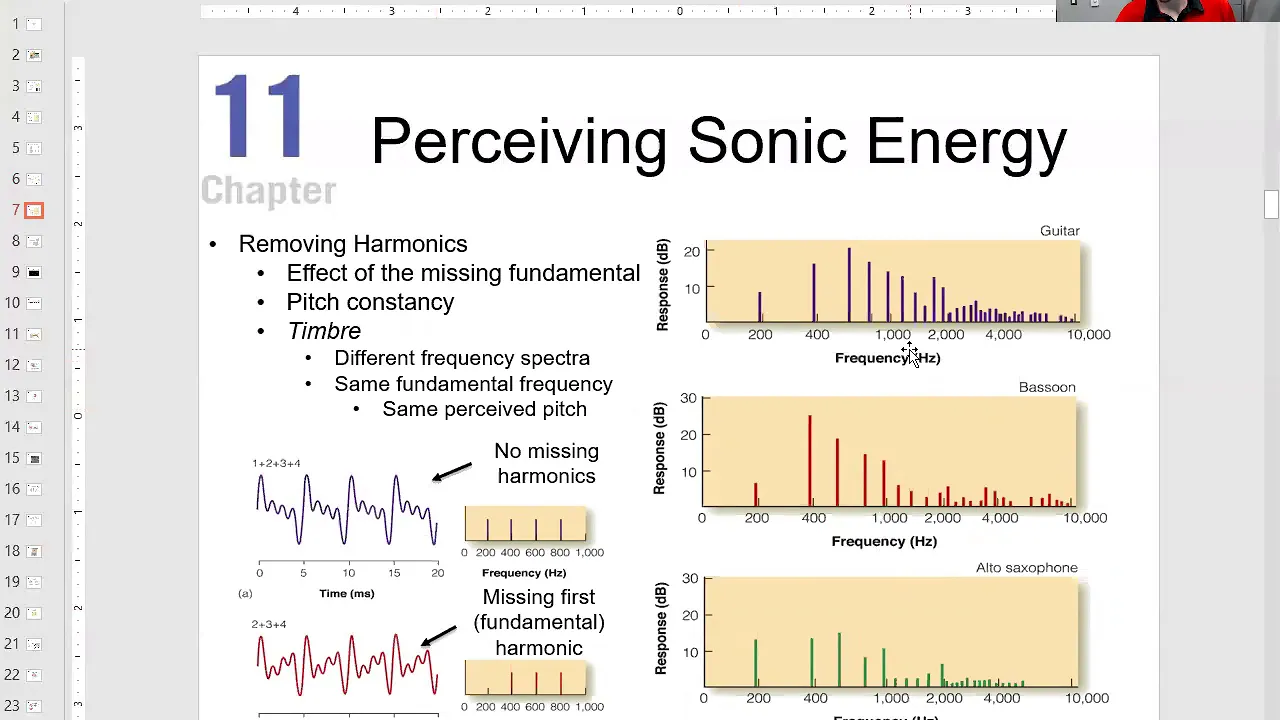
Pure & Complex Tones
2.3K
This section introduces the fundamental distinction between pure and complex tones. A pure tone consists of a single sonic pressure wave at one frequency, such as 100 Hz or 1000 Hz. Pure tones sound strange and are rarely encountered in everyday sounds. In contrast, complex tones consist of multiple pure tones combined together, creating the majority of sounds we hear daily. The video establishes that understanding these basic concepts is essential for grasping more advanced topics in acoustics and music perception.
Click to watch →
소리의 6 요소! - 주파수, 파장, 진폭, 위상, 배음, 속도 - 강의 종합본! 이 한 영상으로 끝납니다! (2시간 무료 강의)
20K
A pure tone (sine wave) contains only a single frequency and is the simplest form of sound. While pure tones don't naturally occur in the environment, they are fundamental to understanding sound physics and are used in audio testing and measurement. Complex waveforms contain multiple frequencies combined together. All natural sounds (voices, instruments, environmental sounds) are complex waveforms composed of multiple pure tones. Simple waveforms are created by combining pure tones at specific frequency ratios. The sawtooth wave is created by combining a fundamental frequency with all its harmonics (2nd, 3rd, 4th, etc.) at decreasing amplitudes (1, 1/2, 1/3, 1/4, etc.). Square waves are created by combining only the odd harmonics (1st, 3rd, 5th, etc.) at decreasing amplitudes. These simple waveforms are used in synthesizers and audio testing to characterize equipment performance.
Click to watch →

The Physics of Music Advanced Acoustics
779
This lesson examines the difference between pure sine waves and complex waves produced by real instruments. A sine wave is a perfect wave representing a single frequency, typically generated by computers. Real instruments produce complex waves composed of multiple sine waves at different frequencies. These additional frequencies are called harmonics, which are integer multiples of the fundamental frequency. The fundamental is the lowest frequency we hear, while harmonics add richness to the sound. Each instrument has a unique combination of harmonics with different amplitudes, creating its distinctive timbre. The cello, trombone, and clarinet all produce the same fundamental pitch but have distinctly different harmonic patterns, resulting in their unique sounds. Even human voices have individual harmonic signatures that create personal timbres.
Click to watch →

Hifi Test Redakteur Guido Randerath erklärt den Klirrfaktor
3.6K
Pure sine waves (like the 1 kHz test tone used in old TV test patterns) sound harsh and are not pleasant to hear. Music, however, consists of many overlapping waves rather than pure sine waves. This is why musical instruments produce rich, complex sounds instead of simple tones.
Click to watch →
Deep Dive
The fundamental concept of audio distortion, specifically the distinction between harmonic distortion (THD) and intermodulation distortion (IMD).

Can one frequency distort another?
8.2K
Audio distortion manifests in two primary forms: harmonic distortion and intermodulation distortion. Harmonic distortion occurs when a single pure tone passes through an audio system and generates additional harmonics—integer multiples of the fundamental frequency (e.g., 2nd harmonic doubles the frequency, 3rd harmonic triples it). These unwanted frequencies accumulate and are measured as Total Harmonic Distortion (THD). Intermodulation distortion differs because it involves two or more unrelated tones interacting simultaneously. When these tones pass through nonlinear components, they generate complex new frequencies that are not simple integer multiples of either input tone. Both types represent unwanted signal degradation that audio engineers strive to minimize below human hearing thresholds.
Click to watch →

Timbre, Harmônicos, Maciez, Profundidade...
26.8K
Harmonic distortion (THD) is a key metric for audio equipment quality. THD measures additional harmonics generated by equipment. Equipment with THD between 1-5% produces audible harmonics, while THD below 0.5% is inaudible at 60 dB below the fundamental. The speaker emphasizes that marketing claims about 'beautiful harmonics' can be misleading—equipment with THD below 0.5% is considered high-fidelity and does not add audible distortion. Understanding THD helps consumers make informed decisions about audio equipment.
Click to watch →
Chat with Dr. Earl Geddes of GedLee Audio
8.9K
Distortion audibility depends more on harmonic structure than THD percentage. A speaker with 5% THD and gradual harmonic structure may sound better than one with 3% THD and rapid harmonic structure (like clipping). IMD is more perceivable than THD because it involves interactions between multiple tones, creating additional distortion products. Single-number THD measurements are insufficient because they don't reveal harmonic structure—a speaker with 20% THD could be undetectable if distortion is at lower frequencies, while 3% THD could be highly audible if concentrated at higher frequencies.
Click to watch →

I Was Using This Mastering Compressor Wrong…
1.1K
Understanding the difference between harmonic and intermodulation distortion is crucial for mastering engineers. Harmonic distortion adds pleasant, musically useful even-order harmonics that enhance the sense of warmth and glue in recordings. In contrast, intermodulation distortion creates inharmonic noise from sum and difference frequencies of different signal components, resulting in an unpleasant, muddy sound. Using VU meter mode properly reduces IMD from 13% to approximately 2.85%, dramatically improving audio clarity. This distinction explains why certain saturation settings sound better on some material while sounding worse on others, depending on how the signal is gain-staged.
Click to watch →
HiFi vs Home Theater Speakers. What's the difference?
147.1K
Total Harmonic Distortion (THD) below 1% is generally undetectable in terms of harmonic distortion. Approximately 3% THD is considered the threshold where a speaker starts to run out of steam. Intermodulated Distortion (IMD) occurs when a speaker plays multiple tones simultaneously and creates additional distortion products. These measurements help determine speaker system capabilities.
Click to watch →
Deep Dive
Fundamentals of psychoacoustics, including human auditory frequency limits, loudness perception, and the concept of auditory masking.
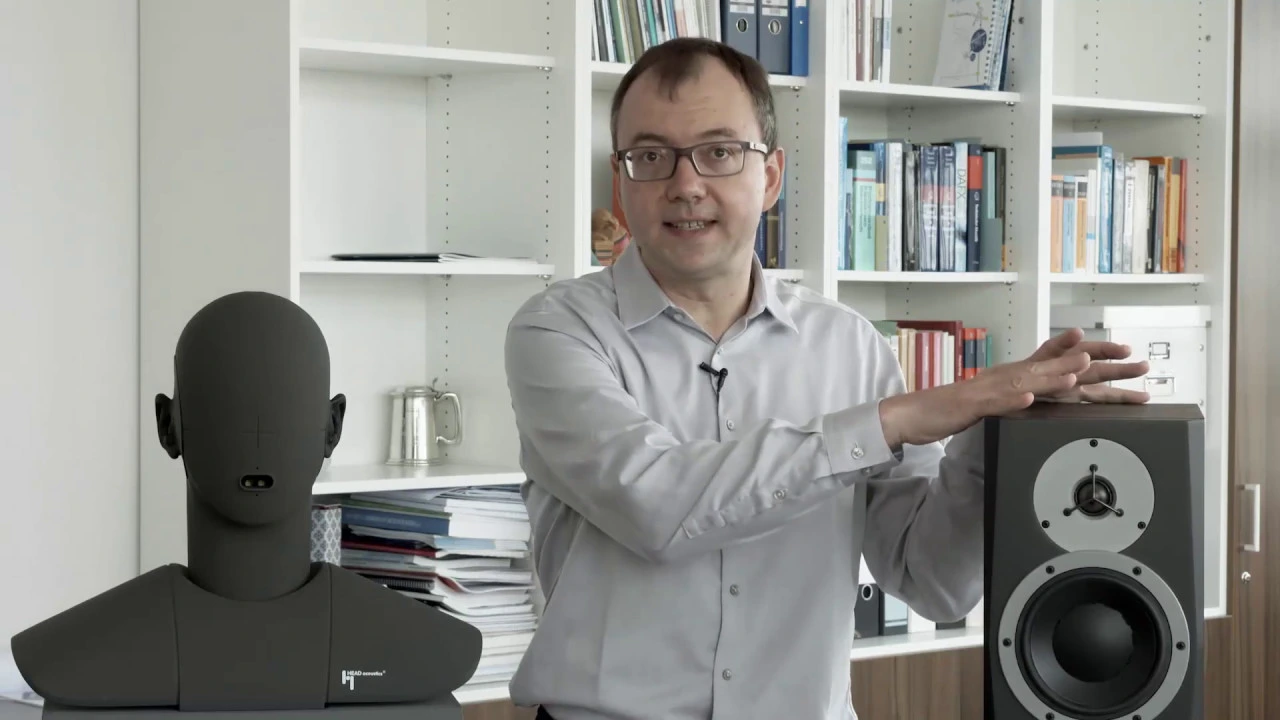
Psychoacoustics - Introduction
17.3K
Psychoacoustics is the interdisciplinary field that connects the physical properties of sound (acoustics) with human perception, studying how we perceive sounds through measurable relationships such as sound pressure level linked to loudness, frequency linked to pitch height, and fluctuation strength linked to roughness; key topics include the hearing threshold and audible range, auditory masking where sounds can mask each other, critical bands and frequency selectivity of the auditory system, loudness perception, pitch formation, timbre, sharpness, fluctuation strength, roughness, and binaural unmasking for speech understanding in noisy environments.
Click to watch →
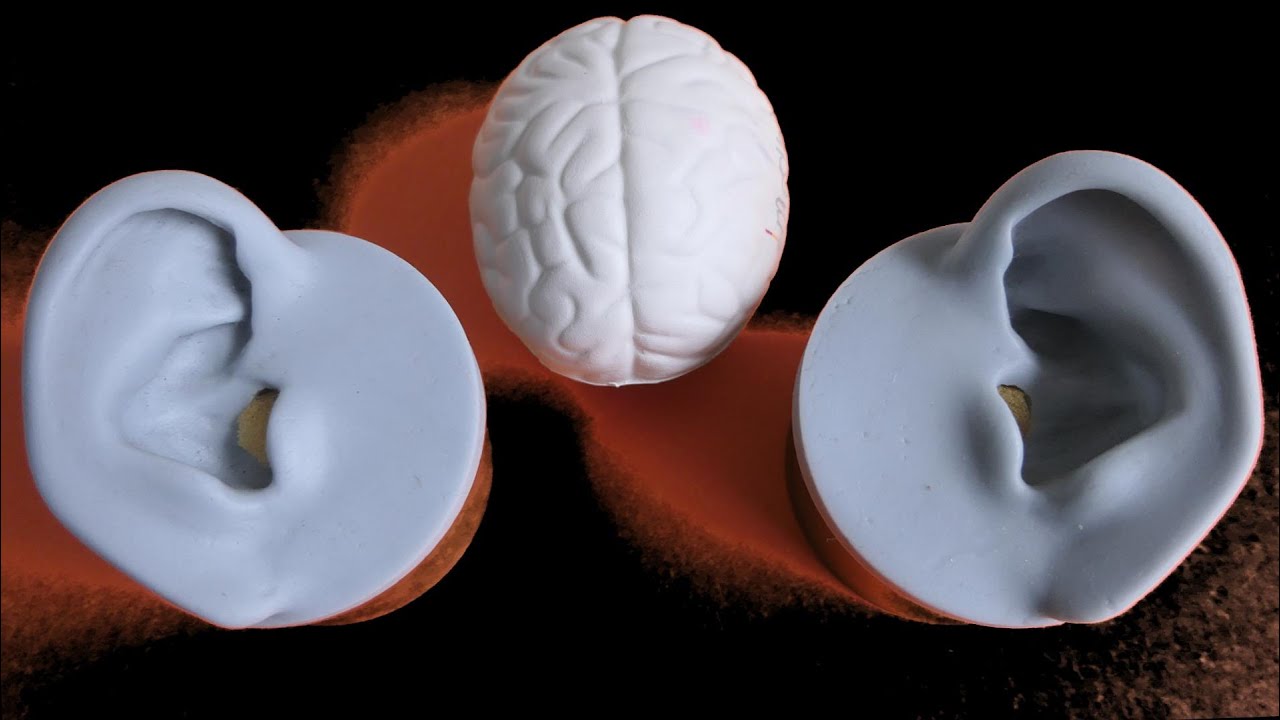
T30 Sustain-5: Psychoakustik-2 (neu)
486
Human hearing operates between 20 Hz and 20 kHz with a dynamic range of 7 orders of magnitude. Sound pressure is measured in Pascals, with SPL calculated as 20 times the log of pressure relative to 20 micropascals. Hearing sensitivity varies by frequency: 70 dB is needed at 20 Hz, while mid-frequencies are most sensitive. Auditory masking occurs when a louder sound prevents perception of quieter sounds at nearby frequencies. A 1000 Hz tone at 80 dB can completely mask higher-frequency tones. Masking threshold curves are steep at low frequencies and flatter at high frequencies, with the upper flank's steepness depending on masker level. The auditory system groups nearby frequencies into frequency groups: below 500 Hz with 100 Hz bandwidth, above 500 Hz with 20% bandwidth.
Click to watch →
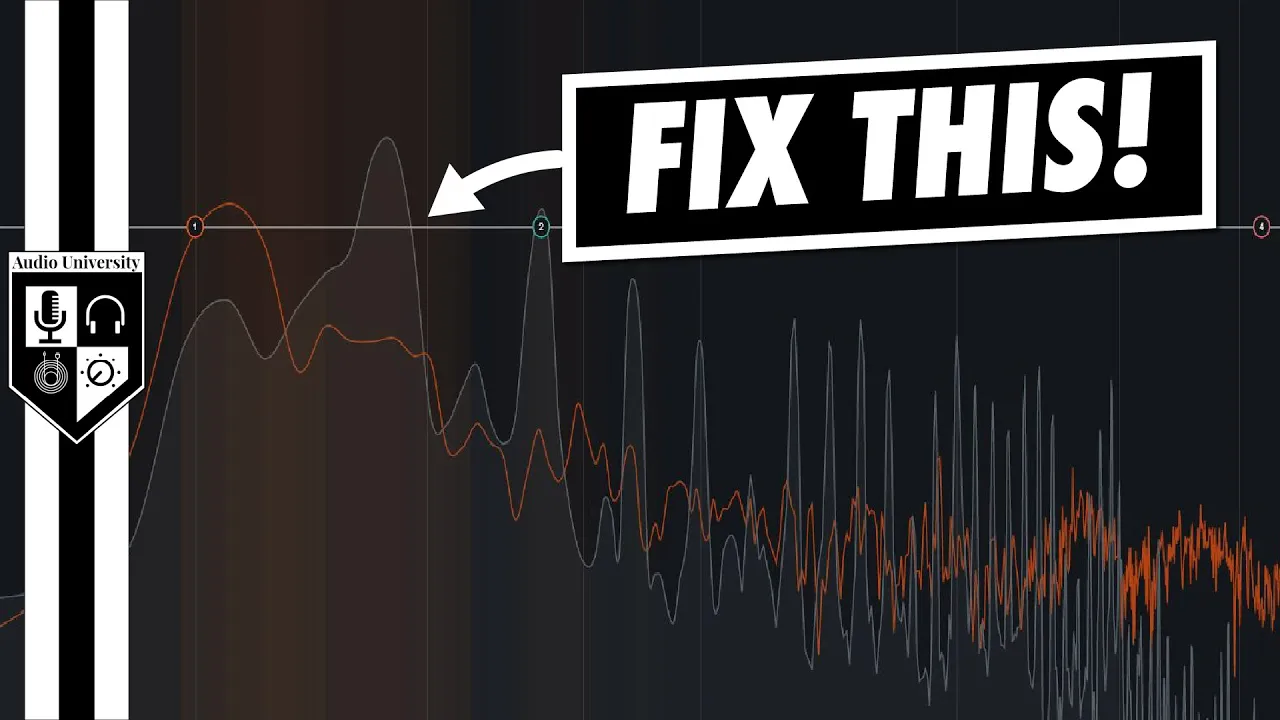
Psychoacoustic Secrets For Mixing Music: Learn How To Hear What's Really There!
160.7K
Masking occurs when one sound prevents perception of another. The threshold of hearing graph shows that humans detect mid-range frequencies more easily than very low or very high frequencies. White noise, with energy evenly distributed across all frequencies, masks a wide band of frequencies proportionally to its intensity. Modern recording equipment has minimal noise, making proper gain structure essential for preserving quiet details in mixes.
Click to watch →

Clashing Frequencies & How to fix them | Psychoacoustics for Music Producers Ep. 2/6
41.5K
Masking is the phenomenon where one loud sound makes another quiet sound difficult or impossible to hear. This occurs with both broadband sounds like white noise and single resonant peaks. Critical bands are frequency areas that listeners can focus on independently. Sounds within the same critical band risk masking each other. Critical bands are approximately one-third octave wide, widening in the bass range. The acoustic shadow of a masker extends beyond its immediate frequency range, and louder maskers disproportionately affect higher frequencies through upward spread of masking.
Click to watch →
PROЗвук Урок 2 - Психоакустика
11.4K
Psychoacoustics studies how humans perceive sound psychologically and physiologically. The human ear consists of three parts: outer ear (pinna and canal), middle ear (eardrum and three bones), and inner ear (cochlea with basilar membrane). Sound perception involves five properties: loudness (amplitude), timbre (waveform), pitch (frequency), duration, and spatial localization. The brain receives main sound information up to 4 kHz, which covers essential life sounds like voices and environmental noises. Low frequencies provide clarity, while high frequencies contribute to subjective sound quality.
Click to watch →
Deep Dive
An understanding of how audio playback systems and signal chains (DACs, amplifiers, and transducers) operate and naturally introduce noise or signal degradation.
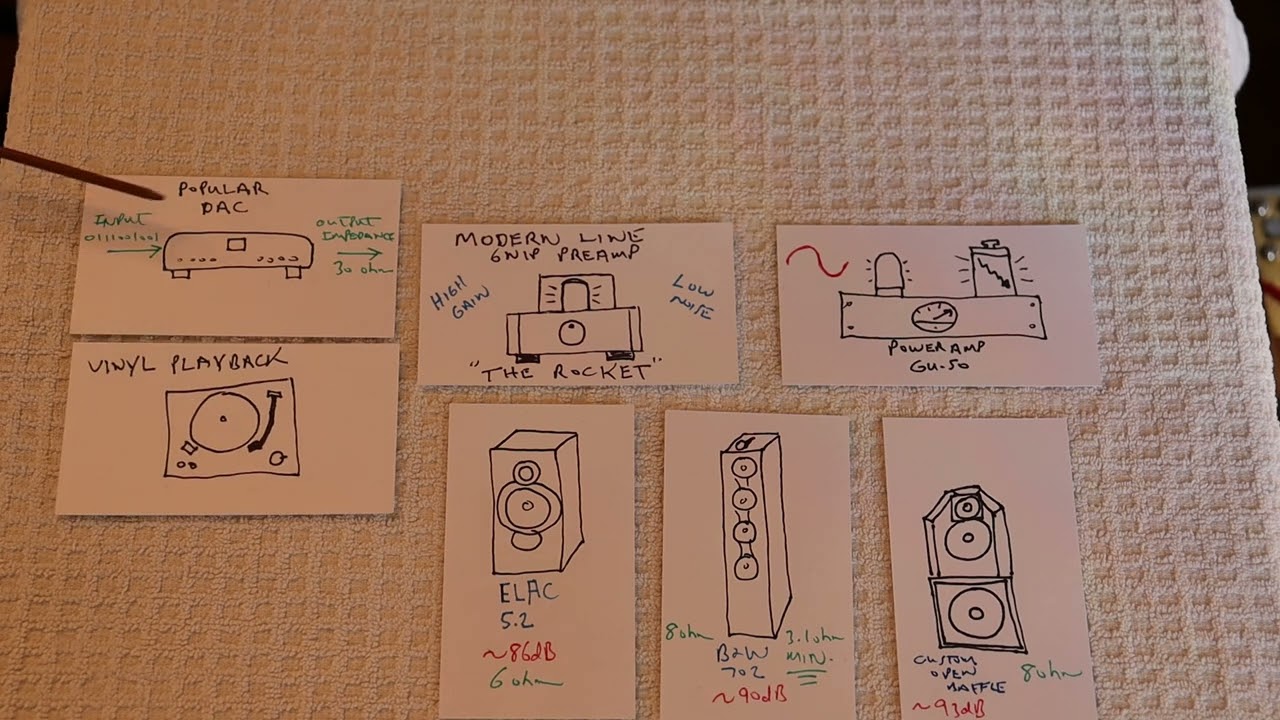
Tube Lab #224 - Noise Floor & How To Minimize It
1.3K
Audio systems consist of interconnected stages where noise accumulates progressively. From source (DAC, streaming device, or turntable) through preamps, power amps, to speakers, each stage adds its own noise contribution. Digital sources provide 1-2V RMS signals, while vinyl provides only ~0.5mV, creating a fundamental noise disadvantage for analog playback. Phono preamps require extreme gain (5000x+), amplifying any noise present at the cartridge level. The key principle is that once noise enters the signal chain, it gets amplified at every subsequent stage. Therefore, maintaining a high signal-to-noise ratio at the earliest possible stage is critical for overall system performance.
Click to watch →

EP14 What's the Most Important Part of Your Signal Chain? - And Other Related Topics
269
The audio signal chain includes everything connected: source (DAC, turntable, streamer), preamplifier, power amplifier, and transducer (speakers or headphones). In digital systems, computers or smartphones can be part of the main chain. Every box has a power supply, creating multiple potential noise introduction points. Quality power supplies generate less noise and isolate noise better from the audio signal path. Computers generate significant electrical noise due to complex internal circuitry. Electromagnetic fields cause electrons in audio paths to move in ways not dictated by the audio signal, introducing noise. USB connections are particularly problematic because they are not isolated. Galvanic isolation is a circuit technique that physically separates data transmission from noise, preventing noise from riding along with the signal. Modern solutions like the Texas Instruments ISO USB 211 chip enable effective isolation at reasonable cost ($50-80 for products like JDS Labs Synapse).
Click to watch →

Ini yang Terjadi Saat Kamu Mendengarkan Musik Lewat Speaker...
63.4K
Digital audio systems process sound through a precise chain: sources (CDs, streaming) use transport to read data, DACs convert binary to analog signals, amplifiers boost weak signals through gain, and speakers convert electrical energy to sound. CD players read pits and lands via laser, translating them to binary data. Streaming sources use IP, DLNA, or Bluetooth protocols. Volume control uses resistors before amplification to preserve signal quality. Preamps handle volume and signal processing, while power amps drive speakers. Understanding this chain reveals why audio systems require multiple components working together.
Click to watch →
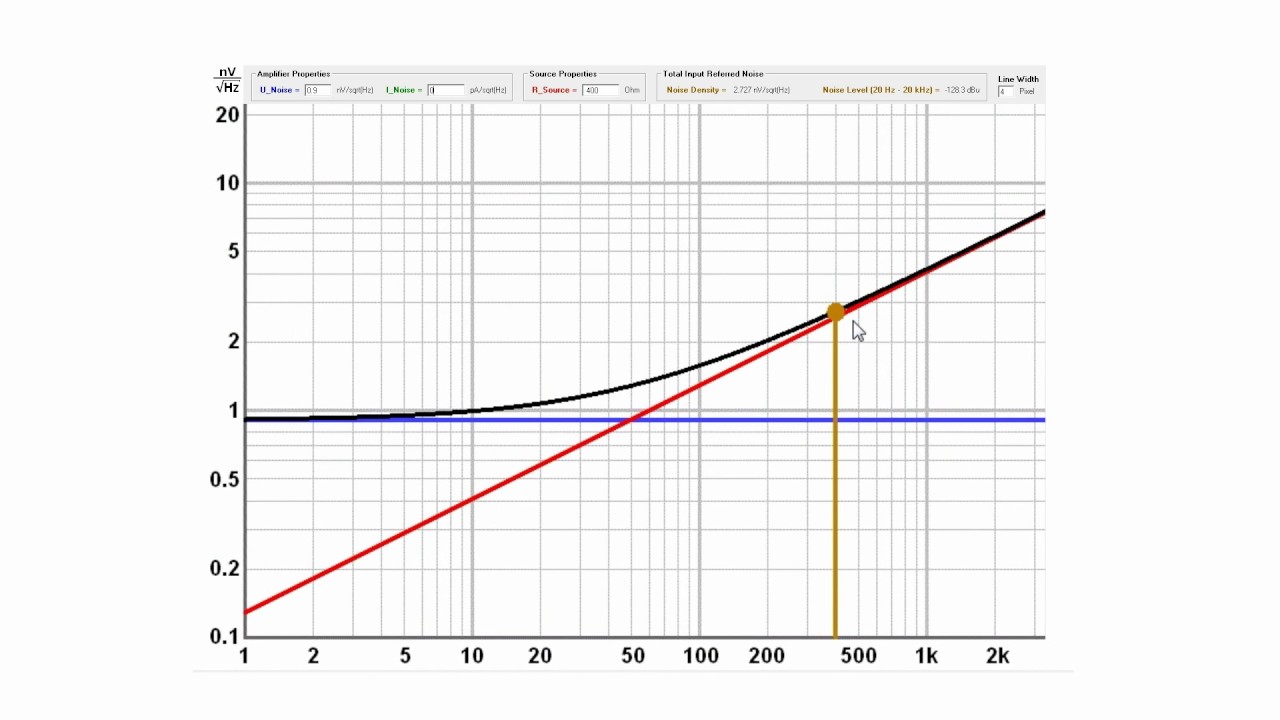
microphone preamplifier noise explained
3.4K
The audio recording chain consists of three main components: microphone (converting sound to electrical signal), preamplifier (boosting the signal), and A/D converter (digitizing the signal). Microphone noise originates from thermal noise, which increases with higher impedance. Bipolar transistor preamps introduce two noise types: voltage noise (constant across all impedances) and current noise (increases rapidly with higher source impedance). Understanding these fundamental relationships is essential for analyzing overall system noise performance.
Click to watch →

LET THE WAR ON LEVELS BEGINS / IS 320kbps GOOD FOR YOUR SOUND?
4.9K
This segment covers how audio signals travel through equipment. Sound waves are converted to electrical waves by microphones, then amplified by preamps and amplifiers throughout the system. Each piece of equipment contains preamp circuitry that increases or decreases signal voltage. The final speaker converts electrical waves back to sound waves. All audio equipment generates some level of noise, with higher quality equipment producing less noise. Understanding signal flow and noise characteristics is essential for proper gain staging throughout the audio system.
Click to watch →
Prerequisite Knowledge
- Concept 01Basic acoustics and wave mechanics, including the physical differences between pure tones (sine waves) and complex signals like music.
- Concept 02The fundamental concept of audio distortion, specifically the distinction between harmonic distortion (THD) and intermodulation distortion (IMD).
- Concept 03Fundamentals of psychoacoustics, including human auditory frequency limits, loudness perception, and the concept of auditory masking.
- Concept 04An understanding of how audio playback systems and signal chains (DACs, amplifiers, and transducers) operate and naturally introduce noise or signal degradation.
Subsequent Learning
- Step 01Advanced psychoacoustic evaluation models, such as the ITU-R BS.1387 (PEAQ) standard for objective measurement of perceived audio quality.
- Step 02The design principles of high-fidelity audio equipment, focusing on engineering techniques like negative feedback to minimize audible distortion in hardware.
- Step 03Methodologies for conducting scientific double-blind listening tests, such as ABX testing, to statistically evaluate audio codec and hardware transparency.
- Step 04The creative application of controlled saturation, clipping, and harmonic excitation in professional audio mixing, mastering, and sound design.
Audio Test Start
Distortion Analysis
Audio Test Start
0:00Playing Section
- 1
Introduces the purpose of the test: finding when distortion becomes audible.
- 2
Instructs to close eyes for unbiased listening and then reveals distortion percentage.
The Ecological Validity and Auditory Fatigue Critique of Double-Blind Threshold Testing
Traditional controlled tests, such as double-blind ABX testing, measure audio distortion thresholds using static stimuli, pure tones, or brief, repetitive musical clips. Critics argue this approach lacks ecological validity, failing to reflect how humans perceive sound during relaxed, long-term listening. Opponents contend that the cognitive stress and rapid-switching mechanics of ABX tests can mask a listener's ability to detect subtle, non-linear distortions. Additionally, short-term threshold tests overlook 'auditory fatigue'—a phenomenon where minute, technically inaudible distortions cause cognitive weariness over extended listening sessions. This counter-perspective also emphasizes that distortion is not universally detrimental; even-order harmonic distortions (common in tube amplifiers) are often subjectively preferred for their pleasing, warm musicality, challenging the assumption that absolute, distortion-free transparency is the ultimate measure of audio quality.
Deep Dive
Advanced psychoacoustic evaluation models, such as the ITU-R BS.1387 (PEAQ) standard for objective measurement of perceived audio quality.

Mean opinion score
4.2K
PEAQ (Perceptual Evaluation of Audio Quality) and PEVQ (Perceptual Evaluation of Video Quality) are measurement algorithms for automated assessment of audio and video quality respectively. These standards provide objective methods to evaluate media quality without requiring human listeners. PEAQ assesses audio quality by analyzing signal characteristics, while PEVQ evaluates video quality through similar perceptual analysis techniques, enabling consistent quality monitoring across multimedia communications systems.
Click to watch →

EBU R128 Introduction - Florian Camerer
54K
The ITU-R BS.1770 standard (Recommendation R1770) provides the first international algorithm for measuring loudness. Despite initial expectations that sophisticated psychoacoustic models would perform best, a surprisingly simple frequency-weighting curve called K-weighting outperformed or matched all complex algorithms. This simplicity makes implementation easy for manufacturers. The standard defines how to measure loudness objectively while approximating human perception, providing a common technical foundation for loudness normalization across the global broadcasting industry.
Click to watch →
Marina Bosi - Keynote: How perceptual audio coding has shaped our lives
2.5K
Signal-to-Noise Ratio is misleading for evaluating perceptual audio coders because different signals with identical SNR can produce vastly different listening experiences. Instead, subjective testing uses impairment scales like ITU-R BS.1116, where grade 5 indicates no perceptible difference from original, grade 4 means perceptible but not annoying, grade 3 is slightly annoying, grade 2 is annoying, and grade 1 is very annoying and unacceptable.
Click to watch →

Objective Quality Assessment of Perceptually Coded Audio Signals (2023)
323
This section establishes the motivation for perceptual audio quality assessment, explaining how perceptual coding achieved 10x efficiency gains in the 1990s but left current objective algorithms (PEAQ, PESQ, POLQA) with fundamental limitations in predicting subjective responses across diverse signal types and distortion scenarios. The first contribution addresses this gap by introducing a perceptually-motivated interaction model that incorporates cognitive effects beyond traditional peripheral auditory processing. The model dynamically weights distortion metrics (noisiness, roughness, dullness) using cognitive effects, applies thresholding via sigmoid functions, and translates distortion values into quality scales. Analysis reveals that signal type (speech vs. music) determines which metrics are most useful—dullness works for music but poorly for speech. This approach outperforms general-purpose machine learning algorithms and state-of-the-art systems across diverse coding technologies and signal types.
Click to watch →

How Many LUFS are Enough - And Why You Should Care
585
Advanced psychoacoustic models were developed to accurately measure perceived loudness based on how humans actually hear sound. Two well-known psychoacoustic models used in loudness measurement are Zwicker's loudness model and Moore's loudness model. These models attempt to simulate the human auditory system's response to sound, accounting for factors like frequency masking and the non-linear perception of loudness at different frequencies. During the development of the ITU-R BS.1770 standard, ten different loudness meters were submitted by seven proponents, including manufacturers and broadcast centers, some incorporating these advanced psychoacoustic models while others used simpler approaches.
Click to watch →
Deep Dive
The design principles of high-fidelity audio equipment, focusing on engineering techniques like negative feedback to minimize audible distortion in hardware.

Grimm Audio PA1: The Distortion Everyone Else Ignores | Guido Tent Interview
699
This comprehensive discussion covers the design philosophy and technical innovations behind high-fidelity audio amplifiers. GrimmAudio follows a bottom-up approach, questioning conventional designs and examining existing solutions. The key distortion mechanisms addressed are: (1) Phase modulation distortion, where unstable crossover points cause audible phase changes as the ear is extremely sensitive to phase variations; (2) Thermal distortion, where transistors heat and cool rapidly (milliseconds) within the audio frequency range, causing inconsistent behavior since all transistor parameters depend on temperature; (3) Harmonic distortion, minimized through second-order feedback systems with constant loop gain up to 20kHz achieving -130dB distortion. Solutions include cascoding circuits to maintain constant voltage across transistors, keeping power dissipation constant, and dividing power across approximately 60 pairs of output transistors in Class AB design. The feedback controversy is resolved by applying either no feedback or high feedback, as the middle ground (20-30 dB) is the worst choice due to the feedback mixer's inherent nonlinearity.
Click to watch →

Lampowy Wzmacniacz dla złotousznych. CZ 1. J. Marshall - Golden Ear. (nr 219)
6.3K
High-fidelity audio amplifiers require prioritizing distortion minimization over bandwidth expansion, as the inverse relationship between bandwidth and distortion means that to achieve wide frequency response covering the entire audible spectrum (20 Hz to 20 kHz), system distortion must be maintained at nearly zero levels; this requires careful design of the driver stage, proper neutralization of tubes to eliminate parasitic oscillations, and implementation of feedback loops that provide approximately 14 dB of feedback while maintaining signal integrity, with the driver stage being the most critical section where most problems and residual distortions originate.
Click to watch →

Схемотехника 2021 10 01
157
Negative feedback reduces harmonic distortion because both fundamental and harmonic signals are reduced by the same factor. Since harmonics are typically much smaller than the fundamental, their relative contribution decreases significantly. The Total Harmonic Distortion (THD) measures the ratio of harmonic content to fundamental signal. Lower THD indicates better linearity. This makes negative feedback essential for high-fidelity audio amplifiers.
Click to watch →
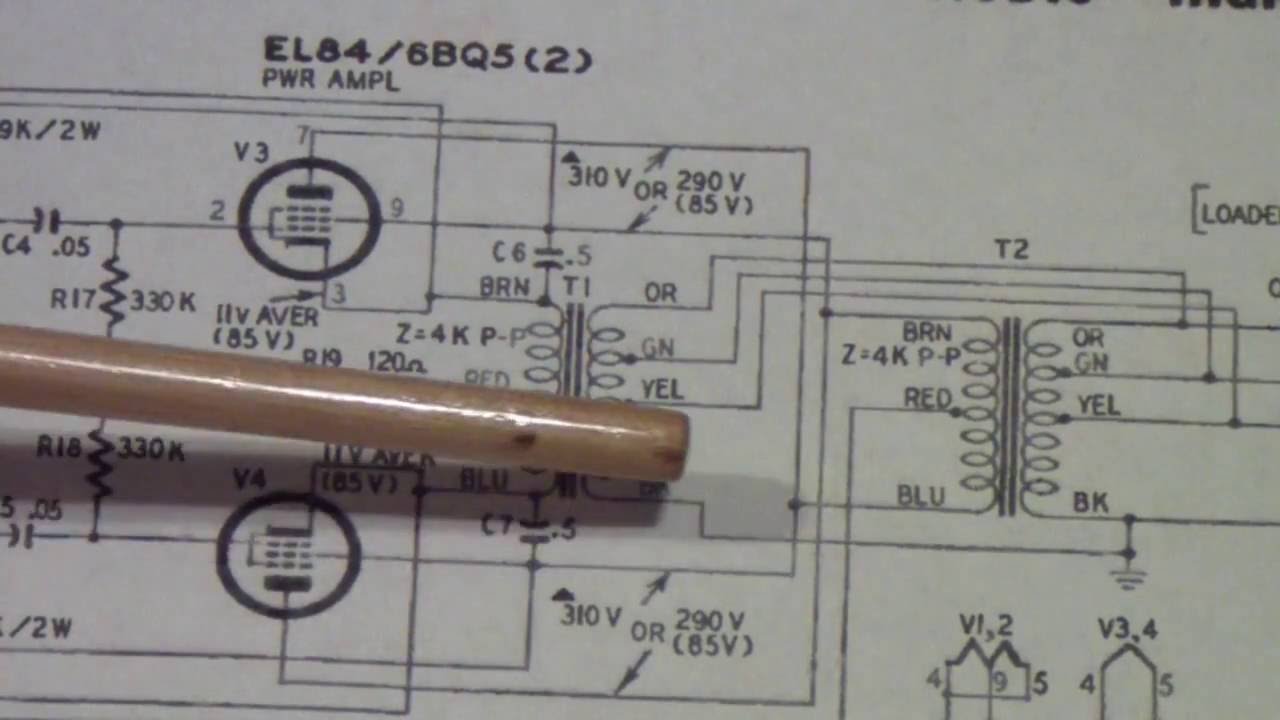
TTT097 HiFi Tube Amps Part 3
6.4K
This comprehensive section covers the core principles of negative feedback in audio amplifiers. The Williamson amplifier pioneered voltage feedback by sensing transformer output voltage, while current feedback senses voltage across a series resistor. Voltage feedback loses signal when output is shorted and varies with speaker impedance, while current feedback increases feedback when shorted, potentially damaging the amplifier. Phase response varies with frequency, with only 180° providing true negative feedback; other frequencies cause oscillation. Feedback only works for correlated signals, not random noise, which actually worsens performance. The twin coupled amplifier addresses these limitations through push-pull feedback from both output tube cathodes, reducing susceptibility to impedance variations and eliminating distortion from tube switching.
Click to watch →

HiFiction Launches Thales Magnifier MC Phono Preamp/Preamplifier at Turbenthal, Switzerland Event
8.1K
Phono stage equalization can be implemented as a feedback loop or as a filter toward ground. The feedback method can result in significant headroom loss (up to 40 dB) in high frequencies. Moving coil cartridges require amplification from 1 to 10,000, presenting technical challenges. Inductive coils control amplifier gain and current. Open-loop circuit design (no feedback) represents an alternative approach where circuits work independently and respond very quickly. Negative feedback was first attempted in tube amplifiers in the 1950s but became practical with semiconductor development. High-quality circuits may avoid electrolytic capacitors entirely. Fully balanced audio signals can be transmitted using RCA connectors by keeping the cold lead separate from ground.
Click to watch →
Deep Dive
Methodologies for conducting scientific double-blind listening tests, such as ABX testing, to statistically evaluate audio codec and hardware transparency.

Proof that DACs CAN make a difference! - Blind ABX Testing
107.8K
Creating a scientifically valid blind test requires addressing multiple challenges: (1) Sufficient runs (typically 20+) to achieve statistical significance; (2) Proper level matching using software controls rather than potentiometers; (3) Elimination of all physical tells including relay clicks and environmental sounds; (4) Remote verifiability so others can inspect files and procedures. The video demonstrates using specialized relay-switching equipment that fully disconnects signals during switching to prevent any mechanical cues. Testing oversampling filters digitally using identical source files ensures only the filter differences remain as variables.
Click to watch →

La trouvaille scandaleuse d’un chercheur sur un switch réseau
798.4K
The double-blind ABX test is a scientific method used to compare two audio situations objectively. In this test, the listener first hears condition A, then condition B, and finally hears condition X without knowing whether X is A or B. The operator randomly selects which condition X represents. If the listener cannot reliably identify the difference, it indicates that the difference between A and B is imperceptible to human hearing. This method eliminates bias from brand recognition and expectation.
Click to watch →
Le 24 Bits Est-il Inutile ? (vs 16 Bits, 32 Bits...)
63.5K
The ABX testing method is the scientific standard for comparing audio files. In this test, a listener hears three files: A, B, and X (where X is either A or B). The listener must identify whether X matches A or B. To be statistically valid, the test must be repeated multiple times. This methodology eliminates bias by preventing the listener from knowing which file is which. The test requires that files differ only in the parameter being tested (such as bit resolution) and that volume levels are identical between files.
Click to watch →

Audiofili indignati a causa del mio test in doppio cieco, chi non accetta la sconfitta !
56.4K
A double-blind audio test is a scientific methodology where neither the listener nor the test operator knows which audio component is active, eliminating external variables that could influence perception. In Mike Borghese's test at Fiera HiFi Milano, participants who heard two nearly identical crossover filters (differing by only 0.5 dB in frequency response) scored between 40-60% correct identifications, which falls within the expected range for random guessing. This demonstrates that while measurable technical differences exist between audio components, they may not always be perceptible to human ears, challenging the common assertion that 'only the ear can hear' audio differences.
Click to watch →

The Boss VB-2 VS Behringer Ultra Vibrato (With IDLES' Lee Kiernan)
190.2K
Blind audio testing is a scientific methodology used to determine whether listeners can genuinely perceive differences between audio equipment when visual information is removed. The test involves placing pedals in mystery boxes that cannot be seen by participants, who then play through both options without knowing which is which. This approach eliminates bias from brand perception, price expectations, and visual cues, allowing participants to judge purely on sound quality. The methodology is commonly used in audio engineering and music technology to evaluate whether perceived differences between equipment are real or influenced by psychological factors.
Click to watch →
Deep Dive
The creative application of controlled saturation, clipping, and harmonic excitation in professional audio mixing, mastering, and sound design.

Absurdly LOUD Mixes and How The Pros Actually Do It
63.8K
Audio clipping, traditionally considered a dangerous distortion artifact, can be strategically employed as a professional mixing technique to enhance mix loudness and punchiness; unlike limiters that compress transients and reduce dynamic range, clippers transparently cut off audio peaks at a controlled threshold, preserving the punchy character of transients while creating additional headroom that allows mixes to be pushed louder during mastering without audible distortion.
Click to watch →
MEZCLAR Y MASTERIZAR es MUY FÁCIL haciendo ESTO (👁 MÍRALO)
56.3K
The harmonic excitation technique, pioneered by Aphex in the 1970s with their Aural Exciter technology, uses specialized distortion modules (tape, uart, and voice) combined with linear phase filters to generate new harmonics from existing frequencies, allowing producers to dramatically enhance the power, depth, and professional quality of their music by selectively boosting specific frequency ranges like sub-bass, mid-bass, and brightness without introducing phase problems.
Click to watch →
Perfect Mastering Chain (How to Get Loud & Clean Masters Every Time)
164.3K
The Oxford Inflator is a saturation/harmonic exciter that adds high-end energy to tracks. Apply it before reference plugins and always A/B test with gain matching to ensure peak volume remains the same. This plugin makes tracks sound louder and fatter without changing the actual peak level. It's an optional but recommended step in the coloring phase of mastering.
Click to watch →

How I do Professional Quality Mastering
26.7K
Mid-side processing separates center (mono) from sides (stereo), providing more control than traditional stereo processing. Always audition in mono to ensure compatibility with mono playback—the mono image represents what listeners hear most clearly. Apply excitation/saturation only to the side component to add character and width without affecting the clean mono center. Use subtle master reverb as a blending factor to fill empty gaps and make the track perceive as bigger and warmer. Different distortion types serve different purposes: warm vintage-style, retro-style, tube triode, and dual triode each create distinct sonic characters. FabFilter Saturn allows band splitting for granular saturation control. Distortion plugins can adversely affect quiet parts by adding excessive noise to already quiet sections. Bass should always remain mono to avoid phase issues and muddiness. High frequencies can be pushed wider for added dimensionality. These advanced techniques require careful application—overdoing any effect creates audible artifacts. The key principle remains subtlety: these tools enhance the natural character of your mix rather than overwhelming it.
Click to watch →

Clipping, Soft Clipping, & Saturation Explained
36.5K
Clipping occurs when audio exceeds zero decibels in digital formats, flattening waveforms and adding harmonics; hard clipping creates harsh, square-wave-like distortion while soft clipping and saturation preserve waveform roundness and produce more pleasant, analog-like warmth. The impact of clipping varies by sound type—harmonic-rich sounds like saw waves may tolerate clipping with minimal audible change, while percussive sounds like pianos produce immediately undesirable results. While final master export should avoid clipping, strategic use of soft clipping during production can achieve louder mixes with lower peaks while preserving punch, offering an alternative to compression that maintains dynamic impact.
Click to watch →
Audio Test Start
Distortion Analysis
Audio Test Start
0:00- 1
Introduces the purpose of the test: finding when distortion becomes audible.
- 2
Instructs to close eyes for unbiased listening and then reveals distortion percentage.
The Ecological Validity and Auditory Fatigue Critique of Double-Blind Threshold Testing
Traditional controlled tests, such as double-blind ABX testing, measure audio distortion thresholds using static stimuli, pure tones, or brief, repetitive musical clips. Critics argue this approach lacks ecological validity, failing to reflect how humans perceive sound during relaxed, long-term listening. Opponents contend that the cognitive stress and rapid-switching mechanics of ABX tests can mask a listener's ability to detect subtle, non-linear distortions. Additionally, short-term threshold tests overlook 'auditory fatigue'—a phenomenon where minute, technically inaudible distortions cause cognitive weariness over extended listening sessions. This counter-perspective also emphasizes that distortion is not universally detrimental; even-order harmonic distortions (common in tube amplifiers) are often subjectively preferred for their pleasing, warm musicality, challenging the assumption that absolute, distortion-free transparency is the ultimate measure of audio quality.
Basic acoustics and wave mechanics, including the physical differences between pure tones (sine waves) and complex signals like music.
The fundamental concept of audio distortion, specifically the distinction between harmonic distortion (THD) and intermodulation distortion (IMD).
Fundamentals of psychoacoustics, including human auditory frequency limits, loudness perception, and the concept of auditory masking.
An understanding of how audio playback systems and signal chains (DACs, amplifiers, and transducers) operate and naturally introduce noise or signal degradation.
Advanced psychoacoustic evaluation models, such as the ITU-R BS.1387 (PEAQ) standard for objective measurement of perceived audio quality.
The design principles of high-fidelity audio equipment, focusing on engineering techniques like negative feedback to minimize audible distortion in hardware.
Methodologies for conducting scientific double-blind listening tests, such as ABX testing, to statistically evaluate audio codec and hardware transparency.
The creative application of controlled saturation, clipping, and harmonic excitation in professional audio mixing, mastering, and sound design.
140.5K views2.5Klikes4:17@JulianKrauseOriginal Release: 2019-09-15
hey Julian Crozier and this is an audio distortion test did you ever wonder at which point distortion becomes audible with your audio system then this video is for you I will play some music and test tones with an increasing amount of distortion so you can listen for yourself when you can start to hear the distortion if you want to be completely unbiased close your eyes at the beginning of each test and only look at the video once you hear the distortion you will then see the current amount of distortion in percent on your screen so without further ado let's start with the tests [Music] [Music] you [Music] with the pure tones you should have been able to pick out the distortion a bit earlier than with the music that's because a pure sine-wave only has a single frequency component and it is easier to detect the additional overtones introduced by the distortion music on the other hand has usually many things going on over the whole audible spectrum and this is masking the distortion and thus it needs a high amount of distortion before you start to notice it depending on which device you were listening to you should have also noticed that you can hear the distortion more easily with the one kilohertz tone compared to the 100 Hertz tone that's because the human hearing is more susceptible to distortion at higher frequencies than it is to lower ones if you do these tests with different playback devices like studio monitors headphones or even the built-in speakers into your smartphone you will notice that this can also make a big difference to the point at which the distortion becomes audible the less distortion the playback device has on its own the easier it is to hear the distortion in the audio signal now are you surprised by the amount at which you were able to pick up the distortion let me know in the comments if you liked this little test please give me a thumbs up and consider subscribing I will see you all in the next one [Music] [Music]
Up Next

45:20
Yorgos Lanthimos & Johnnie Burn: Crafting the Sound of Bugonia
@Dolby
450.6K views•2025-11-04

12:54
Triumph of Orthodoxy Icon: Byzantine Art & History Explained
@BenCallan
2.1K views•2024-08-06

9:49
FastAPI vs Flask vs Django: Choosing the Right Python Web Framework
@TechWithTim
302.5K views•2024-05-26

1:42
Game of Thrones Opening Credits: A Cinematic Analysis
@gameofthrones
46.3M views•2011-04-18
Related Study Plans & Knowledge Roadmaps
Structured learning paths in General & Interdisciplinary Studies
general-studies
Elevator Engineering: History, Physics & Cities
01From Hoists to Safety Brakes: The Dawn of Vertical Lift
02Hydraulic vs. Traction: The Engineering Physics of Elevators
03Modern Speed, Safety, and Algorithms
+ 2 more learning modules
12h5 modules
Explore Roadmap
general-studies
Rubber: Material Science, History & Geopolitics
01Origins of Natural Rubber & Mesoamerican History
02The Chemistry of Natural Rubber & Vulcanization
03The Geopolitics of the Rubber Boom & Colonization
+ 2 more learning modules
12h5 modules
Explore Roadmap
general-studies
Containerization: Evolution, Logistics & Trade
01Ancient Trade & Bulk Cargo: Amphorae to Barrels
02The Industrial Revolution & Cardboard Packaging
03The Containerization Revolution: Malcom McLean
+ 2 more learning modules
12h5 modules
Explore Roadmap
general-studies
Textile Tech: Evolution, Labor & Global Impact
01Pre-Industrial Textiles: Handloom & Cottage Industry
02Mechanization: The Spinning Jenny to the Power Loom
03The Factory System & Global Labor Transformation
+ 2 more learning modules
10h5 modules
Explore Roadmap