


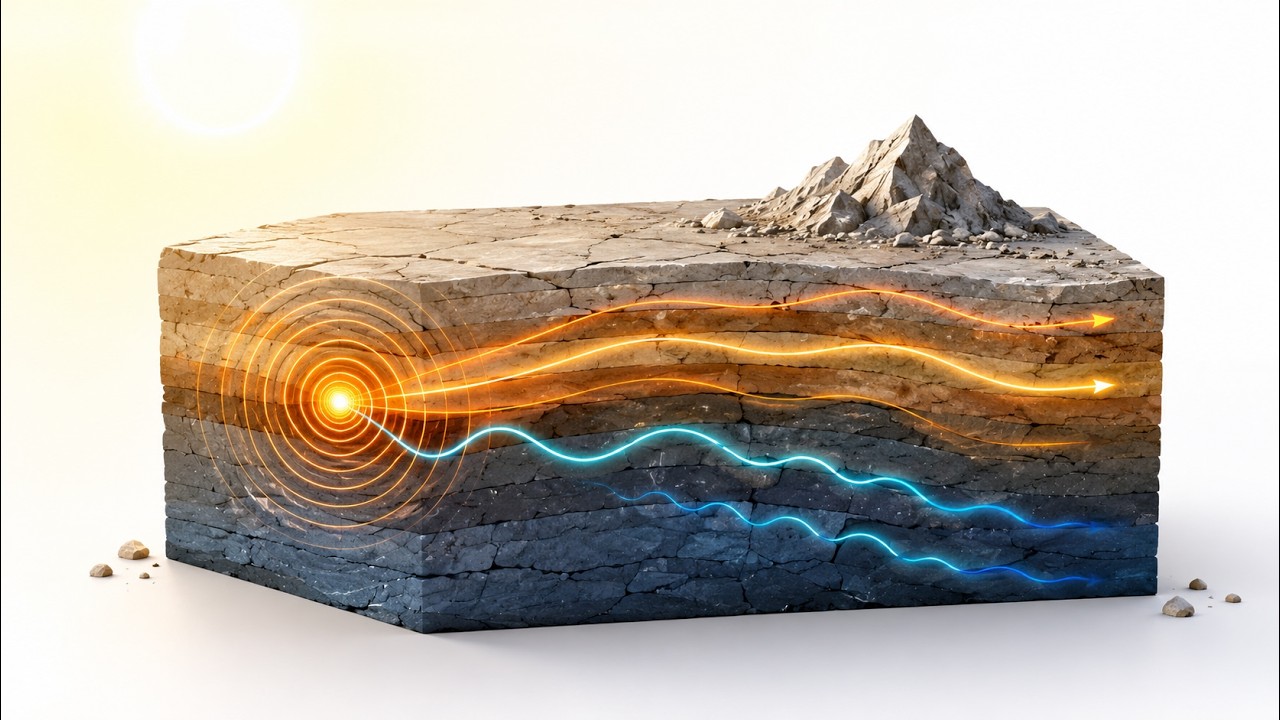





















Seismic reflection is a geophysical technique that images subsurface geological structures by sending acoustic pulses into the Earth and recording the reflected waves; the reflection occurs at interfaces where acoustic impedance (product of rock velocity and density) changes, with the reflection coefficient determining the amplitude of the returned signal, and seismic resolution typically resolves units of 20-30 meters thickness, enabling identification of depositional sequences and sequence boundaries while distinguishing between different rock types and fluid contents.
Seismic Reflection Principles in Geophysical Interpretation
Added:Basic wave physics, including the mechanics of P-waves and S-waves, wave propagation, and Snell's Law.
Fundamental rock properties, specifically density and seismic velocity, and how they vary across different lithologies.
The mathematical concept of Acoustic Impedance (the product of rock density and seismic velocity).
Introductory stratigraphy and structural geology, including sedimentary layering, faults, and unconformities.
Seismic data processing techniques, including migration, deconvolution, and noise filtering to improve image quality.
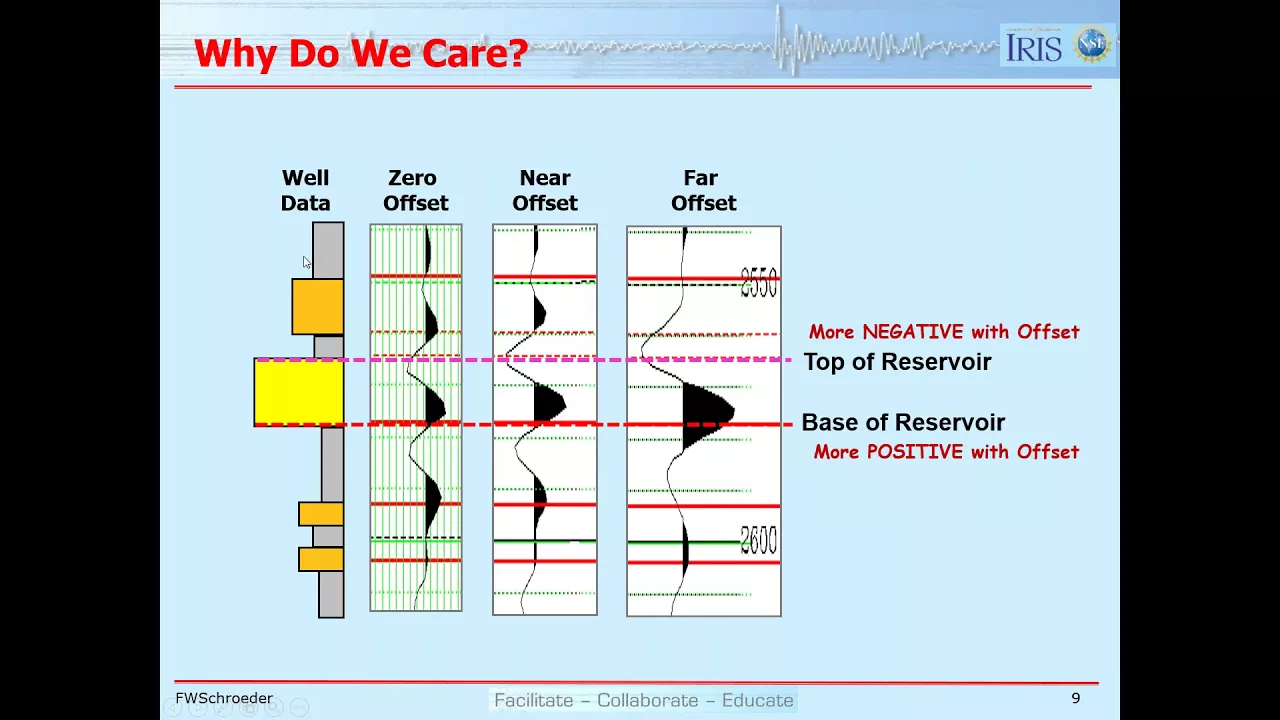
Amplitude Versus Offset (AVO) analysis and its application in direct hydrocarbon detection and lithology classification.
Advanced seismic interpretation methods, such as utilizing seismic attributes (spectral decomposition, coherence) for structural mapping.
Practical applications in energy and environmental sectors, including oil and gas exploration, carbon capture and storage (CCS) site characterization, and geothermal reservoir modeling.
39.8K views565likes34:26Original Release: 2017-07-11
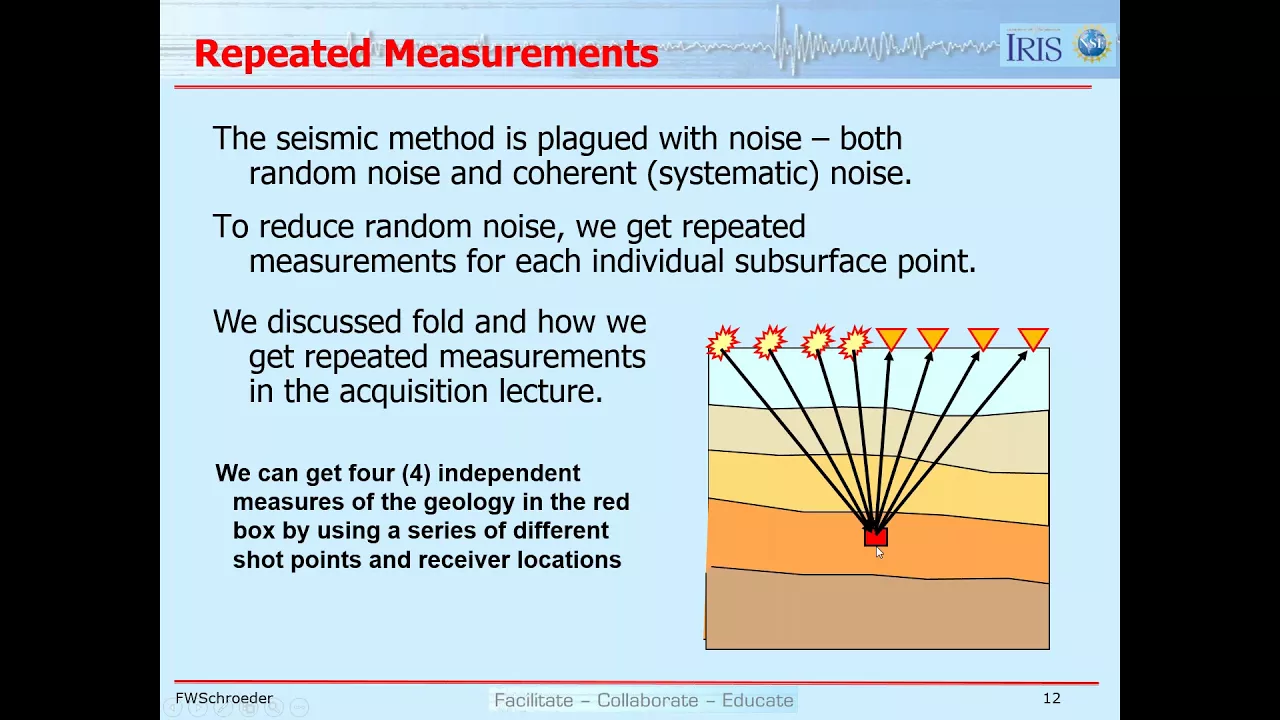
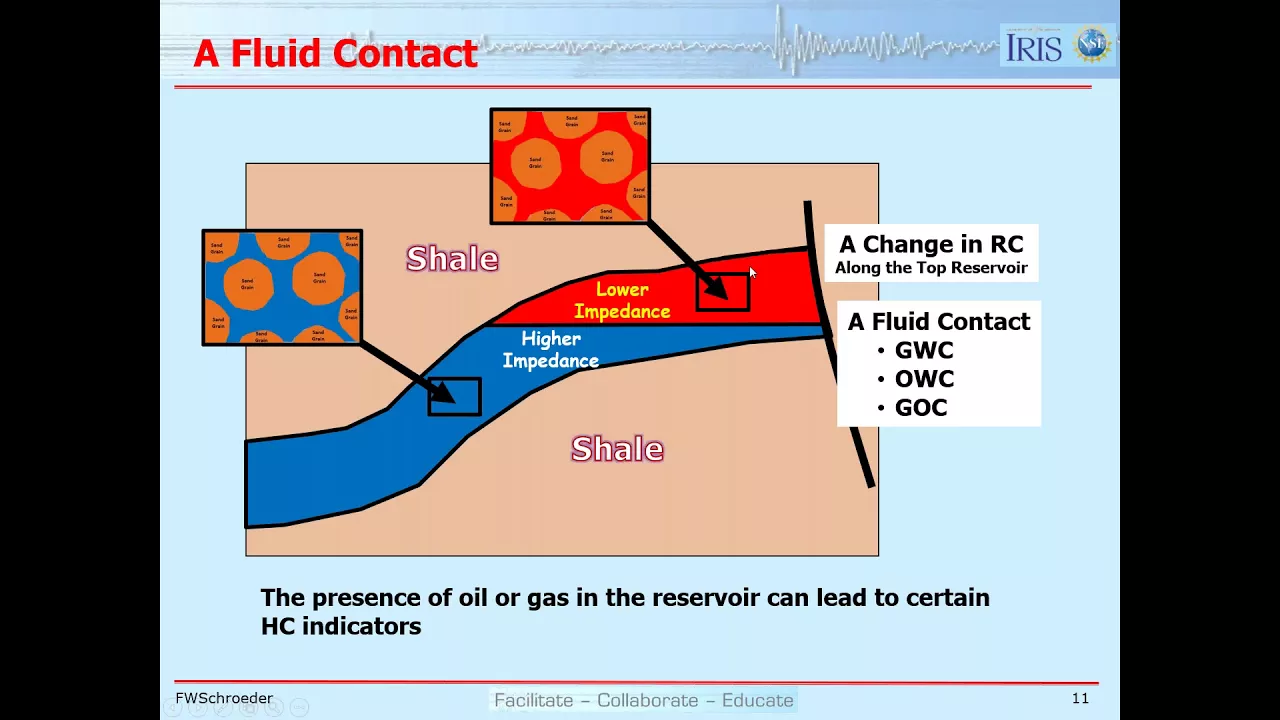
now uh good uh afternoon to everyone and uh glad to be able to uh continue the series sorry for the two week Hiatus but um my schedule was uh was booked up the last two uh two weeks so today we have a um topic on seismic Reflections and this is uh something that is fairly basic for those of you who are uh geophysics uh specialist but uh we probably have a number of people uh listening in or watching uh that maybe are more geological or geochemical and the geophysics is something they uh struggle with a little bit uh which is fine I've struggled with it for 40 years so the ideal seismic response is one that would allow us to resolve beds that are only a few meters thick uh there's an outcrop photo here from West Texas you can see two people for scale and you can see the layering in the rocks and if we had an ideal seismic we'd be able to see Reflections associated with the boundaries between the different Rock units and so um there's a one meter scale bar um on the upper left and so uh the individual blacks which are increases in pedance or the Reds the decreases in pedance are such that we're able to see the tops and bases of some of these beding uh units but unfortunately we don't have the ideal world uh in terms of strateg graphy uh there is a hierarchy that many people are uh adhering to uh they go from very small thin units with very limited extent lamina and lamina sets and it builds up into uh much larger widespread thicker units uh more geological time represented uh sequences and sequence sets and the hierarchy is such that lamina build up lamina sets several lamina sets build up beds several beds build up bed sets and so on and so on and so on and so on there's some terminology that uh people that work this type of strateg graphy have developed uh a depositional sequence is considered a third order unit and a sequence uh typically has a geological span or range of Ages of 3 to five million years as we go to larger scale units the number goes down so sequence sets a stack of several related depositional sequences is considered second order and then from the sequences if we go to smaller scale the Paras sequence set would be fourth order and the Paras sequence Fifth and so on and so on and so on if we're looking at core data typically what we would be looking at our lamina lamina sets beds and maybe up into the bed set stage uh if we're looking at logs we can't see the lamina lamina sets uh unless we have image logs uh with most of the wi line logs we're looking at beds and bed sets and Paras sequences uh Paras sequence sets with seismic we can't see the really small stradal units or uh stral um uh divisions but we can see Paras sequence sets sequences and sequence sets of course seismic resolution is going to vary the bandwidth of the seismic and how deep we are uh in uh the subsurface so for seism data uh uh the resolution is somewhat limited and we see units that are on the order of maybe 20 to 30 m thick but the advantage of the seismic is that we can get a large aerial extent in terms of coverage if uh I had a map up of the Gulf of Mexico the US um uh margin uh and threw a dart at it uh almost every place that the dart would fall we would have at least a 2d survey and probably uh 80% of the US Gulf Coast is covered by 3D seismic survey these days so the real uh pulse uh is much uh less um precise uh much uh lower resolution than on the second slide I think it was where I talked about the ideal response so here we have another outc there's a scale bar in the lower left of 5 MERS and uh the lighter units here are predominantly uh sand the dark units below it and above it are primarily Shale and so with modern day size make looking at things that are not uh extremely deep we might be able to pick out packages of Sands and packages of shells not individual beds or bed sets let me talk a little bit about some of the lingo uh that we use uh when we talk about seismic waves um we have uh uh a trace here uh zero would be no response and then we can get uh negative numbers on our seismic uh uh Trace uh or the tape of the values we can get positive numbers and different people have different ways of uh representing negatives and positives in most cases negatives would mean a rare ref fraction and a positive would be a compression so zero to the positive numbers would give us what we call a peak zero to negative numbers is what would give us a trough one of the main seismic attributes people worry about is seismic amplitude and that's what's the deviation from zero so how positive is the peak uh what's its maximum number or alternatively how negative is a trough uh what's the maximum negative number we also talk about the wavelength uh how long in feet or in meters does it take for a wave to uh uh uh develop and and and um uh pass we also talk about the period that would be the time that it takes for a waveform to pass a given reference point and we measure that in time or more commonly in million millions of seconds milliseconds and the other thing that we talk about is pulse duration uh it's very similar to the period long does it take for the uh pulse uh to uh uh show its its full sinusoidal type shape there's a couple of basic equations equation one the period is one divided by the frequency uh that's a commonly used equation equation two the wavelength that's the velocity times the period And I can substitute from equation one for the period and say the wavelength is the velocity divided by the frequency and D in this case is depth uh it's the velocity times T is 2-way travel time and we divide two-way travel time by two to get oneway travel time so those are probably the three basic equations in terms of uh understanding and describing the different waveforms of the seismic pulses a very basic question is what causes seismic reflections and a reflection is uh caused when there's an interface between bodies or layers that have different acoustic properties we uh Define a term called impedance and usually represented by capital I although I know some people use a capital z or Zed um impedance is defined to be the velocity of the rock times the density of The Rock and so the interfaces between layer one and Layer Two For example that that boundary separates Rock of one impedance from Rock of a different impedance if the impedance change is small that would Le lead to a small amplitude refle reflection if the impedance change is large that leads to a large impedance reflection so here we have an example of an interface we have shell sitting on top of sand the shell has a velocity of 2300 m/s in a density 1.8 the sand slightly higher velocity a slightly lower density there's an equation the reflection coefficient equation uh the reflection coefficient is the impedance below minus the impedance above the boundary divided by the sum of the impedance below plus the impedance above and so we can use this and the reflection coefficient tells me how much of the energy reaching that interface would be reflected back up towards the surface so I can figure out for the Shale the impedance is 2300 time 1.8 so it's 4140 units we won't worry about the all the uh uh meters and grams and CC's for the sand the impedance is 2450 time 1.7 or 4165 and then the reflection coefficient I can take the impedance of the sand minus the imped of the shell divided by the impedance of the sand plus the impedance of the of the shell and that gives me a a reflection coefficient of 0.3 so that would say that of the energy that reaches that interface only 3% of it is reflected and the rest of it would be transmitted to deeper and deeper layers uh it's fortunate for us that reflection coefficients typically are less than 1% because that allows us to have energy go down to a depths of 10,000 20,000 30,000 fet uh to uh regions in the subsurface where we might have oil and gas oh my Advan is not there okay so uh we have at the surface a a source of energy uh and I'll talk more about that a little later will'll have receivers and so we will have a shot go off or a vibrator truck vibrate some energy goes down hits the first boundary part of it is reflected back a small percentage most of it is transmitted I have the listening device it starts at zero with no disturbance and then at a certain time I get in this case a peak followed by a trough and depending on how I have set up my parameters um for me a peak followed by a trough indicates that it's an increase in impedance at the same time that the blue ray path is occurring we can have the red ray path where energy goes down transmitted through the first interface is reflected off of the second comes back up and it is received and instead of coming in at 0 65 seconds that comes in at 1.4 seconds and those would be in units of two-way travel time so we can think of the earth as an acoustic structure with different layers of impedance and that again impedance of the first layer is the density of the first layer times the velocity and the second the third the fourth I can show that impedance structure as a log with increases in impedance for the first two boundaries a slight decrease and then a major increase for the fourth boundary I can use the equation that was on the previous slide uh impedance below minus impedance above divided by impedance below plus impedance above and calculate reflection coefficients uh uh spikes to the right indicate an A positive reflection coefficient or an increase in impedance such as here and here giving positive responses the magnitude of the spike tells me how big the impedance change is so larger impedance change here moderate here larger and moderate uh if I have um layer three has higher impedance than layer four then the reflection coefficient is a negative number and the negative reflection coefficients tells me it's a drop of impedance the magnitude is moderate and then I have a large increase in impedance so I get a large positive Spike if I know the waveform or the pulse that I send down into the Earth I can use a mathematical operation called convolution to take this pulse and convolve it with this reflection coefficient to get this peak contr trough with this pulse to get this peak and trough since this is a negative reflection coefficient it's the mirror image so it's a trough followed by a peak and then the large positive gives me this large Peak followed by a large trough and so at a particular location the receiver is hearing that information uh simultaneously and it will display uh positive numbers negative numbers as a function of two-way travel time so the uh pulse can be pesky uh if the frequency content or the bandwidth is very large then the pulse re approaches that idealized Spike and we'd be able to resolve fine scale Strat graphy so with a very short duration very uh large amp to impulse uh pulse uh then the reflections would Mark the the interfaces quite clearly unfortunately with modern seismic we typically have a bandwidth of 10 to 50 hertz maybe sometimes 8 to 60 uh the bandwidth is the difference so 50 minus 10 is the 40 and that's going to limit our vertical resolution so instead of having a very short duration pulse we have a longer duration pulse and as we convolve that pulse with our reflection coefficients we get uh uh Peaks followed by trough or trough followed by Peaks that have a finite amount of uh two-way travel time associated with them there are two types of pulses that we deal with in Industry uh the first is called minimum phase uh these are causal these are things that actually happen in um Mother Nature if you think about earthquake waves those are minimum phasee uh here is an increase in impedance as we go from a shell into a sand positive reflection coefficient we see the onset of a peak followed by a trough and so that's the uh characteristic for minimum phase uh the peak will be a little larger in area than the trough so we call it front loaded the actual Peak the arrival time is dependent on the frequency and the deflection coefficient is where the uh energy onset Begins the zero Crossing and the peak is a quar of a waveline deeper than where the actual reflection coefficient is located so there's some aspects about this minimum phase pulse that myself as an interpreter uh wish we could change and because of uh data processing we can change that uh most interpreters prefer to have what we call a zero phase pulse so again here's a positive reflection coefficient and now we see that we have a symmetric uh pulse we have a little bit of a peak followed by a major U little I'm sorry a little bit of a trough followed by a major Peak followed by a little bit of a trough we call the first uh trough a precursor and the second one a post cursor the um wavelet is symmetric about the reflection coefficient and the maximum amplitude is coincident with the depth of the reflection coefficient so uh it is symmetric the uh maximum uh uh the peak arrival time is not dependent on the frequencies that we have the maximum Peak to side lobe ratio is obtained when we have zero phase and the reflection coefficient is at the maximum dep displacement uh whether that's a peak in this case for a positive uh reflection coefficient or if we had a decrease in impedance a negative reflection coefficient it would be centered on the most negative number within the trough so I mentioned polarity and polarity is how we uh will see an increase in impedance uh we have uh secg is a society of exploration geophysics they have a normal conven vention so if we have a minimum phase uh pulse or minimum phase data then negative numbers on the uh tape would be a compression and they would be displayed as a trough so for an increase in impedance we would see a trough followed by a peak if however we have a zero phase scg normal for that is that a compression an increase in impedance a positive reflection coefficient would be represented by positive numbers on the tape and it would be displayed as a central Peak with a little bit of side lobe energy before and after so if we have a single interface like I talked about before shell sitting on top of sand uh if in this case the shell is lower impedance and we have a step up to a higher impedance Shale it would generate a positive reflection coefficient and the zero phase resp resp scg normal convention would be to have a central Peak with a little bit of energy um as a precursor a little bit of energy as a postc cursor we can use a mathematical operation called convolution to convolve the pulse uh that we are sending down with the reflection coefficient to get what the modeled seismic response would be if we have more than one reflection coefficient uh here we have a shell a thicker sand unit and a shell the top of the sand is an increase in impedance so it's a positive reflection coefficient the base of the sand is a decrease in impedance so it's a negative and if we have a zero phase pulse we have a peak marking the top of the sand we have a trough marking the base of the sand we consider this a thick interval if the response from the top of the sand finishes or complete before the response at the base of the sand uh begins and so if the sand unit here is thick enough uh we won't have difficulty in uh picking both the top and the base but what happens if the uni gets thinner um the interference the uh the um uh uh response for the top of the interface does not finish before the response of the base begins and that way we start to have uh what is called interference so the two responses will Co coexist the two values get added together and so the receiver uh is not able to distinguish uh what the tail response to the top of the bed is versus the start of the response from the base of the bed and so if we have uh two reflection coefficients fairly close together we we have a peak associated with the increase and impedance at the top a trough associated with the decreas and impedance at the base we add those two together and we can get constructive interference this peak is larger than either the red Peak or the magenta Peak because those two positive numbers are going to add similarly on the composite the trough off negative numbers are greater than the negative numbers for the magenta or for the red the other thing that we could have is two uh reflectors close together that perhaps have the same polarity and so the response for the first reflection coefficient is that Peak for the second is that Peak we add the green curve and the blue curve together and we get a composite and we don't see uh clearly defined Peak associated with either of them because of destructive interference so with seismic data we see Reflections that tend to parallel the mid to lower order stral surfaces uh the Paris sequence sets the sequences and the sequence sets uh reflection terminations Mark where we have unconformities and we'll talk more about that when we get to seismic strateg graphy in a future lesson and changes in reflection character along a reflector is what tells me something about faes changes so uh this blue line here it starts uh up dip uh in coastal plane it goes through the green the foreshore it goes through the tan the lower Shore face and then into the uh slope Basin and so up here a reflector would have low amplitude because we have very similar rocks very similar velocities and densities very small changes and impedance when we start to interfinger one uh lithop fases with another one color with another uh we have a chance for higher impedance contrasts and then it would get to be very low when we're out in the Basin and we have shell sitting on top of shell again the velocity and density changes would be very small and so we get small amplitude responses so why do reflectors follow stal surfaces um as I mentioned impedance is equal to the velocity times the density if we consider where we have Shar changes in impedance uh we can think about how those changes might occur horizontally and how they might also occur vertically so here's a picture of an outcrop this is from West Texas the scale here the black bar is 365 M or 12200 ft so quite a thick unit here uh we have uh at the very base the pipeline Shale then we have above that the lower Brushy Canyon formation the middle Brushy Canyon and the upper Brushy Canyon formation so the pipeline Shale is a basinal shell and as we go from lower to Middle to Upper Brushy we go from uh lower continental slope to midcontinental slope to Upper continental slope we have more shell in the lower uh Brushy we start to get more Sands in the middle Brushy and even more Sands in the upper Brushy on the outcrop the whiter units this is a thick one right here are the Sands and the darker units are the shells so we can go to this location in West Texas and get actually on this uh layer with the uh thick white and walk that out for several miles and if we were to look at physical properties let me back that one off along one of these layer boundaries uh let's say we're looking at this unit here in this location maybe it's 60% sand uh we go a quarter of a mile maybe it's 58% we go a little more it's maybe 55% go a little more maybe it's 52% uh left is landward and right is basinward uh so the changes in the Rock properties and therefore in the petons are very gradational however if we got a um uh summer intern and ask the intern to go down the slope and Sample the Rocks uh let's say um every meter uh the first sample where the little green arrow is that might be 60% sand and then it's uh uh a silt and then it's a shell another shell a silt a shell a sand etc etc etc so we would see more uh changes uh vertically in physical properties and laterally and when we get to boundaries between Paras sequences or parasequence sets some of the higher order uh depositional packages that's where we would see the more significant changes in impedance um either increasing or decreasing and so the reflectors tend to follow the uh uh High higher order uh uh stradal boundaries the parac qu set boundaries the Paras sequence boundaries and the beds set boundaries uh and they do not change uh significant or they do not follow the uh changes in lithop pases um uh as we as those are very gradational and not really physical surfaces not every reflection we see on seismic is related to the strata we can also see evidence of uh different fluid contexts so we have a a gas sitting on top of an oil oil sitting on top of water in certain instances we can see Reflections associated with the change from gas to oil and we can also see changes as we go from an oil filled sand to a water filled sand we can also on occasion see Reflections associated with Vault planes and then there are things that are non- geologic such as uh seismic multiples and various other things that uh could cause us to have Reflections Peaks and troughs on our seismic data so that concludes my prepared statements for the seismic Reflections lecture uh looking ahead on Thursday we'll start to talk about some of the um uh risk elements uh the key elements uh to have success uh Thursday we'll talk about Source rocks and then next week on Tuesday we'll talk about reservoirs next Thursday we'll talk about structure and traps and then uh two weeks from today I believe it is uh we'll talk about seal and migration then we'll get back into some more of the geophysics and seismic interpretation so with that I'll uh stop here and we have plenty of time to have questions thank you Fred um we have a question that just came in um from Patrick Taylor he asks how do you generate a zero phase poll um in the in the field uh most of the data is is created minimum phase but the seismic data processors can do a uh transformation um and uh turn it into a zero phase pulse so they uh they use a 4A transform in order to accomplish that and on many of the interpretation platforms whether workstation or PC based uh there are tools that an interpreter can do that type of thing um uh and on a limited basis to see how uh the seismic line that they're looking at uh might change in appearance uh if they go from um zero phase to minimum phase or or vice versa and it's usually instrument dependent right that how would changing that um one of the questions is how do you identify the tuning effect on seismic uh the tuning effect is when the interference is such that you get a maximum of uh constructive interference and so one of the things you could do is you could um you could uh interpret a horizon and then extract the amplitude and see if the amplitude is uh fairly constant where the bed is uh Rel or the unit is relatively thick and then if it increases uh 50% or more uh in a certain region before it uh goes to uh to zero and there are tools again on workstation and PC interpretation platforms that if you suspect you have a tuning thickness that it can detune the amplitude map for you great um somebody asks um are you going to talk about convolution in future sessions are going to go into that more deeply um I don't think I will I think I talked a little bit of convolution today and I think I talked about it uh perhaps in session five sounds good um Alex Owen asks um can you derive paracity from acoustic impedance there there are certain uh data sets in which we can use seismic attributes to derive uh uh uh paracity uh we cannot uh easily derive uh permeability which is the other main um component of reservoir quality so um there is there are ways kind of more advanced processing that can be done to try to um um do seismic inversion I think I talk about that a little bit in unit 29 and um we would need some well datas with uh paracity information in order to calibrate the seismic response but there are a number of case studies I'm aware of where they have been success ful in using different seismic attributes to get to paracity if you then want to use a relationship between paracity and permeability you can use that uh but it's not a it's it's kind of a a second derivative from the seismic seismic itself is we don't have a method to get to permeability directly it's true um what wavelet is best to use for Wells to seismic ties um zero phase or minimum phase uh good question uh we'll talk about well seismic ties in unit 15 uh most people prefer to use zero phase uh it has a lot of nice properties and the uh one of which is that the vertical resolution is maximized when you have zero phase data great thank you um there's a question question on can you go over how you identify an unconformity on a seismic Trace yes to identify an unconformity on seismic what we look for is a series of uh seismic Reflections Peaks Andor troughs that terminate against a a common uh uh reflector um we'll talk more about that when we get into um seismic sequences unit 21 uh people talk about onlapping reflectors downlapping reflectors erosional truncation and topl lapping reflectors and uh that's the the main uh criteria that we use the discordance of reflectors and the uh systematic termination of uh three or four uh Reflections uh to give us confidence that it's showing us a break in deposition sounds good all right all right Fred that's the end of the questions so um thank you so much for today's webinar and we look forward to having you back on Thursday to talk about Source rocks okay well thank you all for tuning in and um appreciate this opportunity to to share with you great thank you Fred bye everyone have a good afternoon
Up Next

12:39
Seismic Reflection Interpretation | Inner Moray Firth Basin Analysis
@robbutler2095
12.2K views•2021-05-07

12:53
21cm Hyperfine Transition in Neutral Hydrogen: Radio Astronomy Basics
@AaronRobertParsons
12.4K views•2011-10-13

5:17
Seismic Slinky: Modeling P and S Waves in Earth Science
@IRISEarthquakeScience
258.7K views•2013-07-13

27:14
Entropy and the Second Law of Thermodynamics Explained
@veritasium
27.5M views•2023-07-01
Related Study Plans & Knowledge Roadmaps
Structured learning paths in Physics
physics
Nuclear Physics (Decay, Fission & Reactors)
01Atomic Structure and the Binding Force
02Radioactive Decay and Half-Life
03Nuclear Fission Mechanics and Chain Reactions
+ 2 more learning modules
12h5 modules
Explore Roadmap
physics
Soft Matter (Polymers, Colloids & Rheology)
01Foundations of Soft Matter & Thermal Forces
02Polymer Physics and Macromolecules
03Colloids, Surfactants, and Self-Assembly
+ 2 more learning modules
38h5 modules
Explore Roadmap
physics
Analytical Mechanics: Lagrangian & Hamiltonian
01Mathematical Foundations: Calculus of Variations
02From Newtonian Mechanics to Constraint Dynamics
03The Principle of Least Action & Lagrangian Mechanics
+ 3 more learning modules
28h6 modules
Explore Roadmap
physics
General Relativity (Spacetime & Cosmology)
01Foundations of Relativity: Special Relativity
02The Geometry of Spacetime: Equivalence Principle & Curvature
03Einstein's Field Equations: The Mathematics of Gravity
+ 2 more learning modules
55h5 modules
Explore Roadmap