

![Anatomy of the Heart: Structures and Blood Flow [Cardiology Made Easy]](https://i.ytimg.com/vi/1b4V09HzhBw/maxresdefault.jpg)







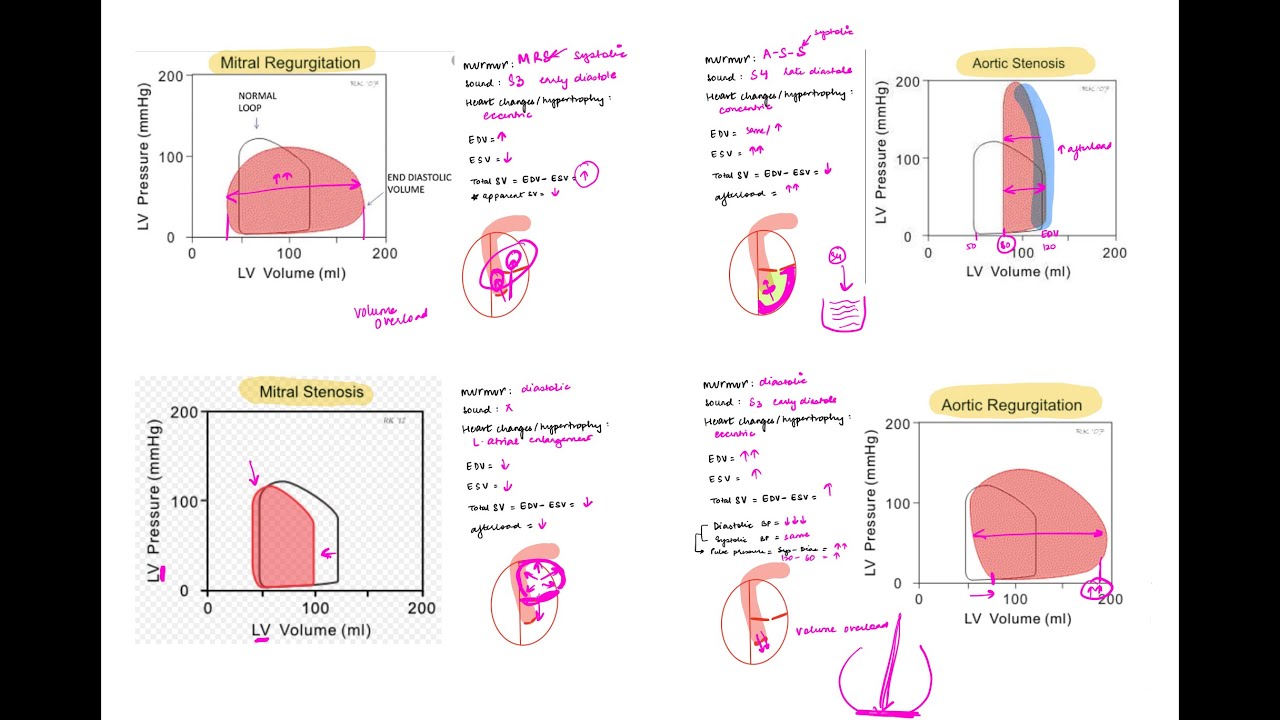


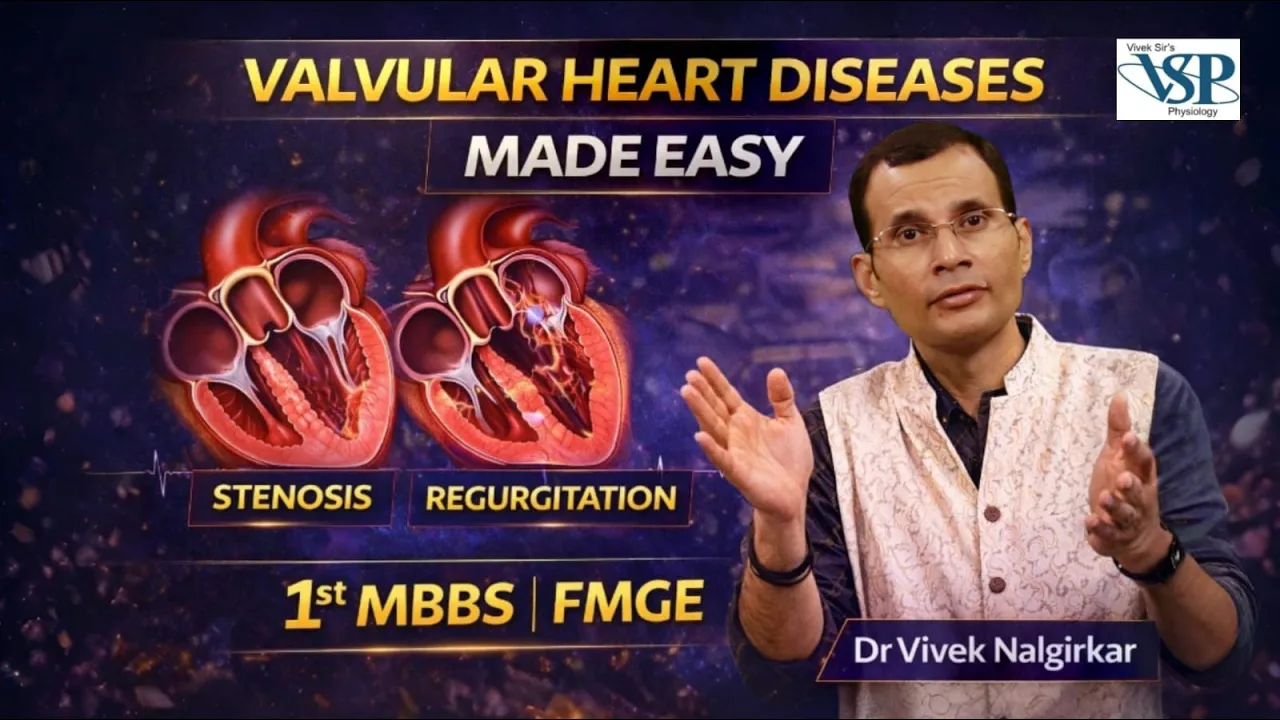



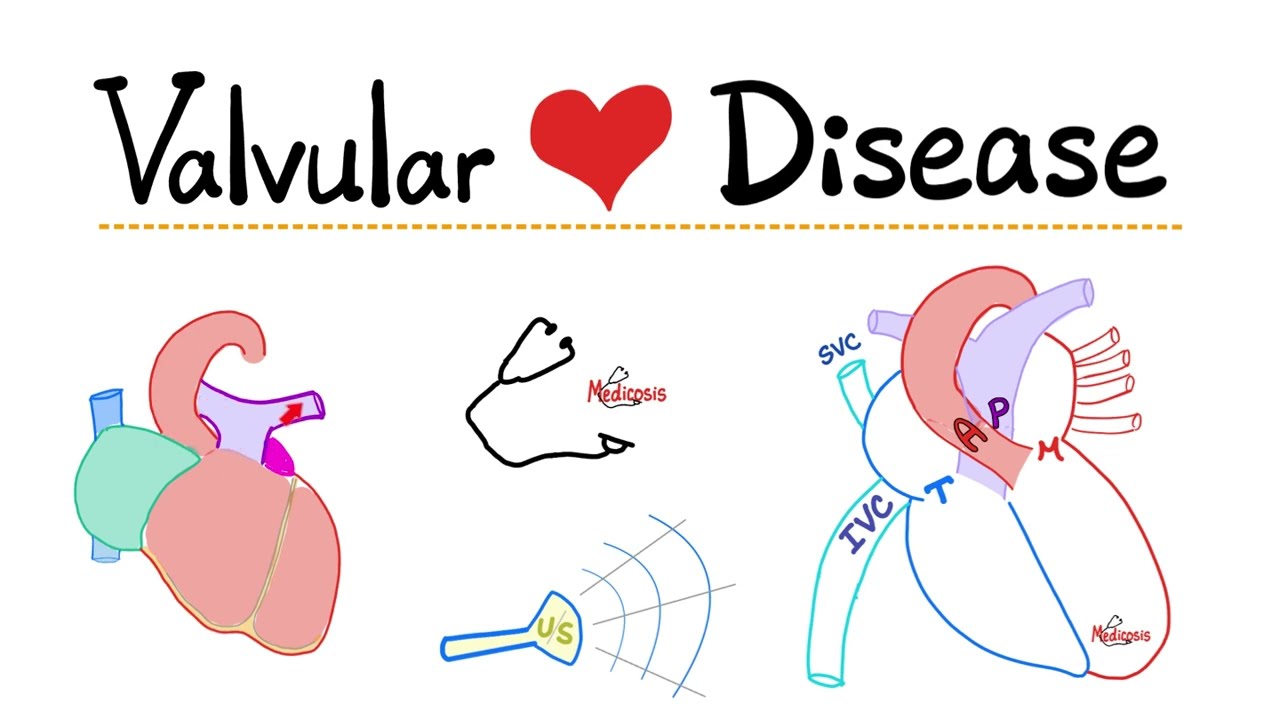









In pressure-volume loop analysis for valvular heart disease, stenotic lesions (aortic stenosis and mitral stenosis) produce thin loops with reduced stroke volume, while regurgitant lesions (aortic regurgitation and mitral regurgitation) produce wide loops with increased stroke volume; additionally, aortic lesions cause a rightward shift of the end-systolic volume point, whereas mitral lesions cause a leftward shift, enabling differentiation between these conditions based on loop width, shape, and positional changes.
Cardiology: Valvular Heart Disease on Pressure-Volume Loops
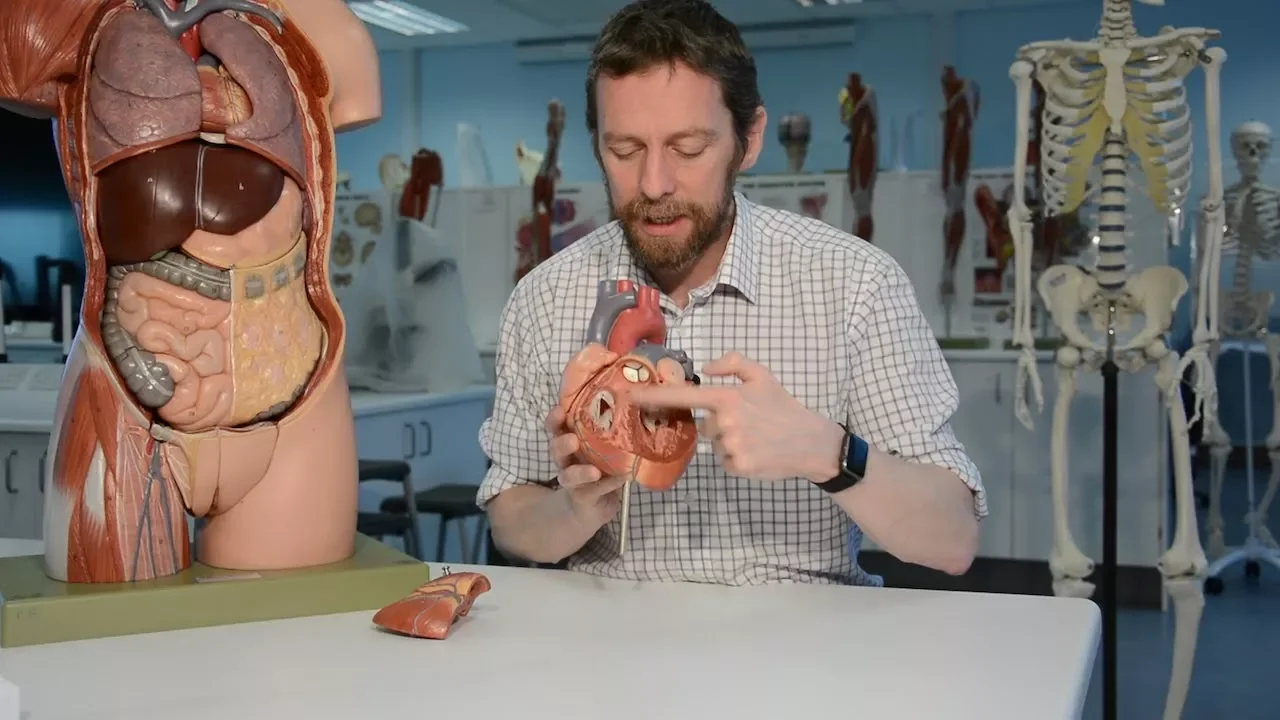
Added:Understanding the anatomy of the heart chambers and the functional roles of the four major cardiac valves (mitral, aortic, tricuspid, pulmonary).
Familiarity with the phases of the cardiac cycle, specifically ventricular systole, diastole, isovolumetric contraction, and isovolumetric relaxation.
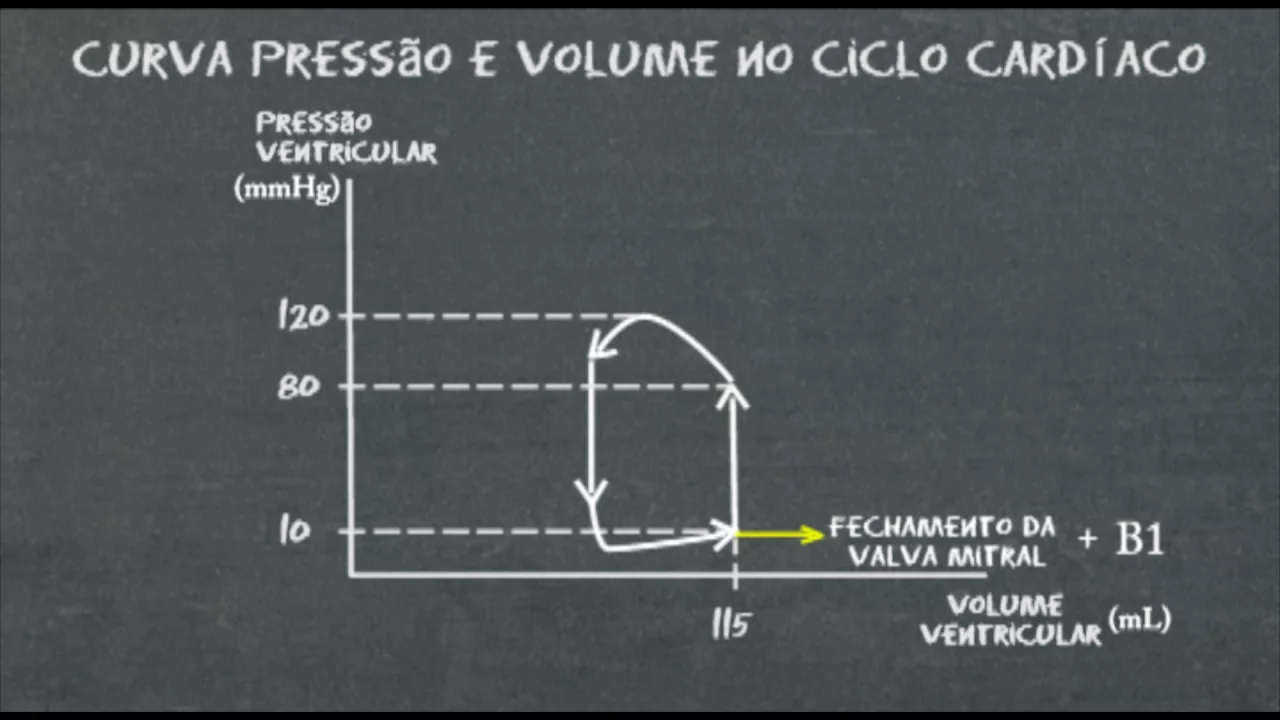
The structure and components of a normal left ventricular Pressure-Volume (PV) loop, including End-Diastolic Volume (EDV), End-Systolic Volume (ESV), and Stroke Volume (SV).
Basic definitions of valvular dysfunction, specifically the difference between stenosis (narrowed opening obstructing flow) and regurgitation (incomplete closure causing backflow).
Analyzing the long-term compensatory mechanisms of valvular disease, such as concentric hypertrophy (from pressure overload) and eccentric hypertrophy (from volume overload).
Correlating PV loop abnormalities with clinical physical exam findings, such as the timing, pitch, and location of systolic and diastolic cardiac murmurs.
Evaluating the acute and chronic effects of pharmacological interventions (e.g., afterload reducers, diuretics, inotropes) on pathological PV loops.
Exploring advanced diagnostic modalities and treatment thresholds, such as echocardiography parameters, catheterization data, and surgical indications for valve repair or replacement.
32.2K views1.1Klikes28:25Original Release: 2022-07-13
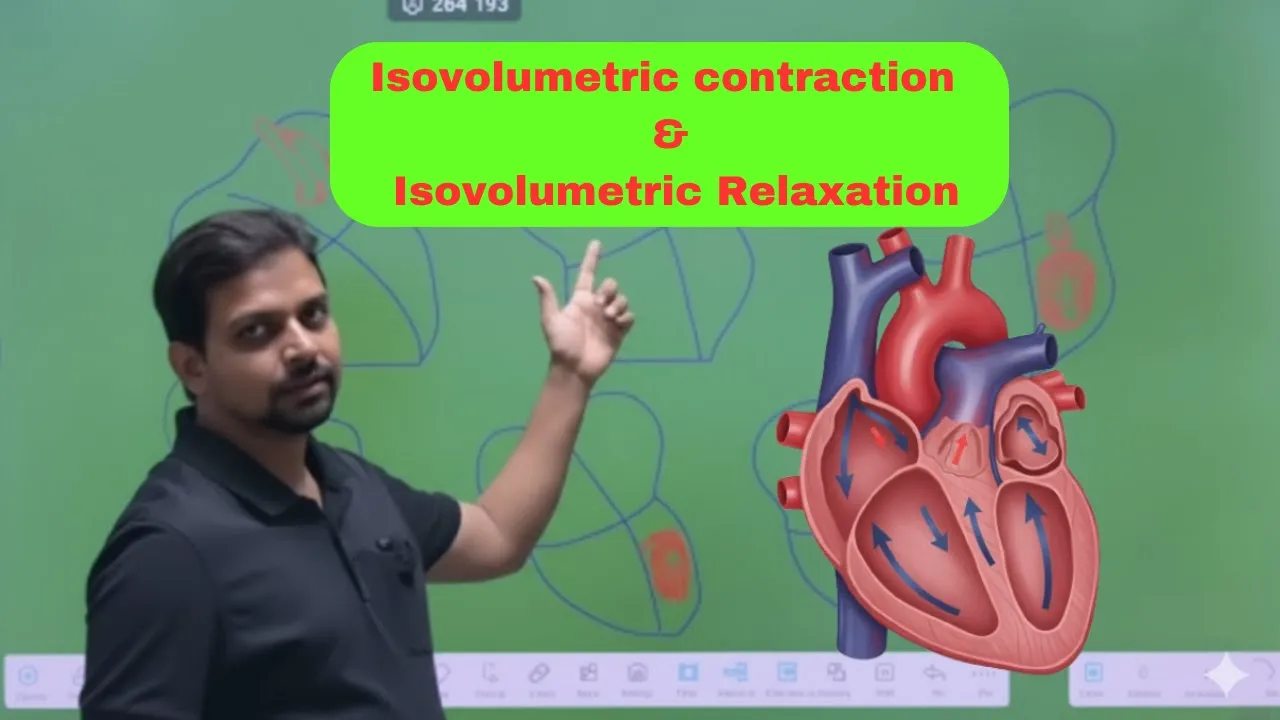
hello everyone happy evening a very good evening i hope and i believe all of you are doing well uh a quick note whether the audio visual is all good foreign okay that's great so first of all uh wishing you all a very very happy guru purnima uh heartfelt thanks to each one of you for the lovely wishes and for keeping me motivated day in and day out to learn something new and in a different way so that i can deliver you in the best possible way so happy guru purnima everyone and uh so on that positive note let's start the today's session so basically if you go back and check the first aid using the book uh page 297 is basically where you'll be seeing the graphs that we are discussing in the section of cardiology right in the section of cardiology so these are basically the graphs today that i'm focusing on uh i believe uh because of the time constraint today uh so i'll be doing uh this in two parts part one today and then part two again tomorrow at five pm right because if if time allows i'll do it completely if not then we'll do it in two parts so tell me uh right so anybody who can identify here this graph i put this as a question mark in the thumbnail itself tell me what walville disease is this if the dashed line is showing the normal pressure volume loop what is this graph showing is it aortic stenosis is it aortic regurgitation is it microstenosis or is it mitral regurgitation what is that all right welcome back to this question later on you can keep thinking till then yes and uh we can stay connected on insta youtube telegram or the unacademy profile on telegram group is basically where we are following the new timetable and the daily targets and you have a daily pre-test and the posters based on the daily targets today we have cns and neuromuscular physiology okay we'll come to the correct answer later on after we discuss this topic some of you have got this right some of you have got this wrong i hope after the session each one of you will get that right okay so starting with the first question related to the pressure volume loop a quick review of this pressure volume loop and then we'll go into the wall below diseases so tell me mitral valve opens at which point at which of the following point does the mitral valve open is it a b c d uh the regulation of respiration the neural regulation basically i have taken recently you can check it on i've taken on youtube itself you can check the link in the telegram channel if there's anything else that you want to know and you want me to discuss please let me know okay so the question is at which point the mitral valve opens thank you so much dave i'm so happy to know you got all questions correct after attending the yesterday's class see mitral valve opens now how you should be cracking these questions basically is subset when you have a question if this valve is closing or this valve is opening think about what phase of the cardiac cycle is starting when the mitral valve right you remember the schematic diagram yesterday that we discussed the cardiac cycle for anyone who did not watch the yesterday's class please do it to understand the basics okay so when the mitral valve is opening so basically the blood will go from the atrium to the ventricle right so what is happening there what is happening there the ventricular filling is happening that means the diastole phase the ventricle will receive the blood right so basically the volume of the ventricle the volume in the ventricle is increasing where is the volume the volume is on the x-axis the left ventricle pressure is on the y-axis at which point the volume is increasing in this area basically right so from point d to point c is where the volume of the ventricle is increasing that means it's a filling that means this is the point d where the micro valve is basically opening okay this is the point where the mitral valve is opening here with everyone right so this is the opening of the mitral valve now tell me what valvular event is happening at this point b so if i have to quickly tell you about the lv pressure volume loop see the the y axis basically shows the pressure in the ventricle and this is the direction okay this is the direction of the pressure volume loop so at this point point c is where the pressure okay where the pressure okay so that is what we are talking about it's not point a to b the curve is going in this direction okay so if i have to put the directions here so the curve is going from this direction to this direction and this direction and this direction the volume is increasing here it is not point a to b it is point b to a where the volume is decreasing when the volume will decrease in the left ventricle when it is giving the blood to the aorta that means the system the the systole the ejection phase so basically at this point to be what is happening this door is opening right the aortic valve right it is the aortic valve which is opening and that is when the ejection starts when the ejection is over the point a what will happen the aortic valve closes and that is when the diastole again starts what is this phase of the diastole basically this phase in this phase you can see that the pressure of the ventricle is going down it is downward direction but the volume is the same right the volume is the same it's a straight line the volume is not changing so basically this is iso volumetric relaxation okay this is iso-volumetric relaxation similarly c2b is the point where the pressure is increasing but the volume is the same same volume means iso volumetric pressure increasing so it is contraction right so it is contraction so now tell me that uh which is the point where the systole starts systole starts at which point in this graph if i ask you systole starts at which point what will be the answer systole methyl contraction okay remember systole basically means contraction so contraction means the pressure increasing isovolumetric polyaga kahansa pressure increases from the point c right so the system is starting at point c diastole is starting at which point diastole relaxation pressure going down it is starting from the point a where the pressure is going down okay the pressure is going down so that is the point a here with everyone so basically if i ask you from which point to which point is sisterly and which point to which point is diastole i hope you remember from the yesterday's class that the initial part is iso volumetric in both so basically this is the systole starting pressure increasing and this is the ejection so point c 2 b and then point a so basically c 2 a is systole and a 2 d to c this part is basically the diastole initial iso volumetric then that is the filling phase okay i have already shared the pdf of this on the telegram group right if you want to make the notes you can see that so absolutely right so if i draw a line here so this is the systole and this is the diastole here okay so this is the systole and this is the dice rule now yesterday's mnemonic if you remember coco mam right coco map the valvular events closer of mitral opening of aortic closure of aortic then you have opening of mitral so at which point is the micro valve closing so just remember that schematic diagram right that means the filling is over so next we'll start with the stone the closure of mitral valve is basically the start of systole so what is the point where the mitral valve is closing what is that one right so that is the point c so if this is the point c which is closure of mitral so next one is opening of aotic right next is closure of aotic and the next is opening of mitral valve right so this is where you have c-o-c-o-m-a-a-m that is coco-mam the coco-mam basically starts here in the lv pressure volume loop if you remember the yesterday's graph the vigors diagram here the coco-mam starts here the closure of mitral right c-o-c-o then you have m-a-a-m then you'll have opening of aortic closure of iotic opening of mitral that was in the vigorous diagram here at this point is where the cocoa mam starts okay at this point is where the cocoa mam starts all right here with everyone so this is about the pressure volume loop now look at these points what does this indicate what does the width of the pressure volume loop indicate so this volume okay if i ask you what is this volume indicating okay you have two volumes of the ventricle here aka volume so this volume that you see here is this end systolic volume or end diastolic what is ending at this point it is the diastole which is ending at this point right because from this point to this point this is sisterly so this is the end diastolic volume and this is the end systolic volume the systole is ending here so this is the end systolic so what is the formula for stroke volume it is end diastolic minus the end systolic so basically the subtraction 120 minus 50 approximately equal to 70. so this is a numerical question that you get on this graph calculate the stroke volume from this graph so basically you have to look at the width of the graph okay you have to look at the width of the graph that is the stroke volume edv minus the esv right stroke volume means what is going out with one ejection that's the stroke volume so how much it is received minus how much goes uh uh you know how much is remaining so that is what is going out take a clear with everyone so that is edv minus esv all right now uh going to the next one okay going to the next one here these are the volvo events given let me show you this graph here this is what we have already discussed this is the stroke volume this is isovolumetric contraction ejection then this is isovolumetric relaxation and the filling phase this is the end diastolic volume and this is the end systolic volume okay and these points basically represent the aortic pressure systolic and the diastolic look at the points where the aortic valve closes that is the systolic where the aortic valve opens that is the diastolic pressure okay that's your first pressure basically okay now uh look at this this graph is basically that i'll be discussing uh tomorrow in the so basically this is from your first aid okay now let us discuss the effect now this is what you would love i believe this is what you would love here basically and that is identifying the changes in the wall wheeler diseases okay so if i show you these four images rather than four i mean this let me start one by one tell me what do you think is this volvular lesion is it aortic stenosis aortic regurgitation mitral stenosis or mitral regurgitation write this down because this is something which is very very important tell me what volvo lesion is this the live chat and the let me see what happened all right uh tell me what do you think is this one okay so quick tips here the mnemonics to be remembered very very important mnemonics here is basically remember that whenever it is stenosis okay this is very important trick whenever it is stenosis remember the graph becomes thin still is thin okay so basically stenosis made the graph becomes thin that means what is happening from the normal width now the width becomes this much so when the width of the graph is decreasing basically what is decreasing the stroke volume is decreasing okay the stroke volume is basically decreasing so be it aortic stenosis or be it mitral microstenosis the graph will become narrow it will become right so this black line here represents a normal graph look at the normal stroke volume this pink one is the volume lesion car graph you can see the stroke volume is reduced so it is stenosis it is not regurgitation that is what you need to remember now whether this is aortic stenosis or it is mitral stenosis how will you know that another trick to remember here chaotic lesions versus mitral lesions okay so aortic ma remember the shift is to the right the graft shifts to the right and might till you have l there right do not confuse with the r aortic does not have l so aortic is right mitral is the shift to the left so from this point you can see that where the graft graph has shifted has the graph shifted to the right or the graph shifted to the left where has the graph shifted from the normal the graph is shifted to the right right so that is why the answer here is aortics aortic stenosis now what point tells you that this is aortic stenosis what point tells you that this is aortic stenosis oh see aortic stenosis basically is this door is very narrow so the left ventricle has to pump out with a narrow through the narrow door it has to increase the pressure to push against that narrow door right we'll have to push more so more pressure needs to be created so look at the maximum pressure here and look at the maximum pressure here the height of the graph is increasing okay so that is why this is aortic stenosis basically the after load is increasing okay so remember that the height is increasing it is becoming stenosis is thick and aortic is right okay aortic is right so that is your uh aortic stenosis now apply the tricks stenosis then aortic right micro left only this is what you need to remember this is the crux of how to identify synonyms shift to the right and micro is shift to the left now tell me what do you think is this one what will a lesion do you think is this is it aortic stenosis is it aortic regurgitation mitral stenosis micro regurgitation absolutely right so first of all you can see the width of the graph is increased it is wide so it's not stenosis so no stenosis no stenosis it's a regurgitant lesion the graph has shifted to the right it is the rightward shift so right word shift is aortic it is not mitral so the answer is aortic regurgitation in medicine we read about the various clinical signs in aortic regurgitation they are basically due to wide pulse pressure that is a very important feature of aortic regurgitation the wide pulse pressure so this is the systolic maximum vola you have the diastolic here you can see that the pulse pressure will be significantly high basically in aortic regurgitation okay so i'll do as i said the details of pre-load and after loads to evaluate say i'll be discussing this uh tomorrow preload after load and contractility what is the effect of that and how do you identify in the pressure volume loop okay i'm just telling you the quick tricks of the volvo lesions pv loop okay now identify this one as what do you think is this apply the trig stenosis is thin aortic is right mitral is left what do you think is this wall willow lesion here very good so this is thin as compared to the normal in a stenosis right this is stenosis so regurgitant is out it is not a regurgitant lesion regurgitant will have increased stroke volume the width will be more where has the graph shifted as compared to the normal the graph is shifted to the left so this is mitral stenosis the aortic will be to the right right also in aortic stenosis the height will increase the pressure will increase significantly so this is microstenosis okay this one is microstenosis everyone give me a quick thumbs up if you have understood this easy tricks to identify which volvo lesion it is right just remember stenosis aortic right micro lift left now what lesion is this aortic stenosis aortic regurgitation microstenosis mitral regurgitation remember i can give you a repeat image also see first of all uh the graph has gone okay uh first of all what do you see here the graph has become white it's not thin so that is why it is not stenosis it is regurgitant the graph has shifted to the left if you compare this basically it has shifted to the left so this is mitral regurgitation aortic will be to the right so this is micro regurgitation aortic valve regurgitation malagra remember when you write aortic it will go towards right let me show you aortic regurgitation look at this in aortic regurgitation this is going towards the right okay it's going towards the right okay clear with everyone all right so let us quickly see this okay let us quickly see this combined okay so you have graph a you have graph b graph c and graph d okay applying the tricks this one is thin okay so this one is and you see that it has shifted to the right so thin with shift to the right so that makes it a stenosis right is aortic so this is aortic stenosis okay this is aortic stenosis this one the width has not decreased it has increased so it is not stenosis so it is regurgitation the line has gone towards the right word shift it is right so this is aortic regurgitation okay this one is aortic regurgitation okay where you see that again it is so this is stenosis thin is stenosis and you see the line has gone to the left so this is microstenosis okay this is mitral stenosis here you see that the width has increased so it's not a stenosis okay so uh bharti that's what what you have to compare for the right shift and the left shift is this volume okay what volume is this basically here this is the end systolic volume okay we are talking about the end systolic volume is what you have to see whether it's going to the right or to the left we are not talking about the end diastolic volume okay the end systolic the line is shifting towards the left so this is micro it is not thin it is white so this is micro regurgitation please do not look at the end the diastolic volume look at the shift of the end systolic volume okay look at the shift of the end systolic volume take it now applying this basically if i ask you that what happens okay what happens to end systolic volume okay what is happening to the end systolic volume in aortic regurgitation in aortic regurgitation the end systolic volume is decreasing or increasing yes so shifting to the right the graph the line that we are talking about is the end systolic volume going towards the right that means the end systolic volume is increasing so basically in micro it is left towards shift that means the end systolic volume is decreasing uh let me see if i have that image here okay so look at this one okay so look at this one basically aortic stenosis the end systolic volume is increasing okay the end systolic volume is increasing microstenosis micro regurgitation leftward shift the end systolic volume is decreasing okay the end systolic volume is decreasing here with everyone right is this clear with everyone okay the next point if i ask you mitral stenosis versus mitral regurgitation in which of these the end the diastolic volume okay in which of these the end the diastolic volume increases in which of these the end diastolic volume decreases and in which of these the end diastolic volume decreases so think about the end the diastolic volume is this one when i say increasing that means it is more wide when i say decreasing that means it is becoming thin right so n diastolic volume decreasing method of the graph is becoming narrow it is thin so this is going to be stenosis and diastolic volume increasing that is stroke volume so this is basically your mitral regurgitation so look at this one mitral regurgitation you can see the end diastolic volume edv is increasing in your microstenosis the end diastolic volume is decreasing right it is decreasing here with everyone again okay so basically what is happening in stenotic lesion stenosis is thin so that means the stroke volume is decreasing rigor detent is wide that means the stroke volume is increasing so these points edv esv and stroke volume are clear with everything this is from your first aid itself going to your aortic stenosis when i say stenosis is thin that means the stroke volume is decreased when i say regurgitant is wide that means the stroke volume is increasing right the stroke volume is increasing and you have the increase in the end the diastolic volume also okay you have increase in the end diastolic volume here with everyone okay is this clear with everyone okay so this was the quick review of the pressure volume loop uh the effect of the wall wheel or lesion so this is what the graph is so spin with shift to the right aortic stenosis and with shift to the left mitral stenosis why do it shift to the right it is aortic regurgitation why do it shift to the left that is mitral regurgitation okay that is mitral regurgitation so in both of these basically the end systolic volume is decreasing here the end systolic volume is increasing okay the end systolic volume is increasing okay all right so as i said for today we'll be doing this part one tomorrow i'll be discussing this complicated graph what is the effect of preload after load contractility how will you identify the graphs and also this from your first state basically how do you identify the wall wheeler lesions on the vigors diagram very very important for ini ct exam vigorous diagram case identified that is what we'll be seeing tomorrow okay so that will be the plan for tomorrow evening okay we are meeting again today at 8 00 pm basically for the respiratory physiology graphs right the important graphs and respiratory physiologies what we'll be doing at 8 pm with mcq discussion as well so hoping to see you all on the an academy app it's a free live plus it's a special class which is free live class at eight pm if you are asked for the code to join you can use the for dr nikita so some easy tricks to decode the respiratory physiology graphs all right so i hope this confusing topic has become easy what happens in which wall wheeler lesion the esv and the edv has become easy for you okay thank you so much everyone for joining and see you at 8 p.m till then goodbye take care and keep studying keep revising and keep winning and happy google
Up Next

20:24
SA Nodal Action Potential & ANS Effects: Cardiac Physiology
@medschoolsimplified007
2.5K views•2025-06-21

48:47
Graphic Medicine: Comics for Collaborative Healthcare Communication
@nationalpatientadvocate
189 views•2023-12-04

10:28
Neuroanatomy: Central and Peripheral Nervous System Divisions Explained
@AKLECTURES
136.2K views•2014-09-20
3:05
Stages of Labor and Vaginal Birth | Childbirth Animation
@nucleusmedicalmedia
52.1M views•2017-08-18
Related Study Plans & Knowledge Roadmaps
Structured learning paths in Medicine
medicine
Abnormal LFTs: Diagnostic Workup & Pathology
01Liver Anatomy and Basic Physiology
02Introduction to Liver Function Tests (LFTs)
03Hepatocellular vs. Cholestatic Patterns
+ 3 more learning modules
12h6 modules
Explore Roadmap
medicine
Analyzing Blood Smears: RBC, WBC & Platelets
01Introduction to Blood Components & Smear Preparation
02Normal Morphology of Blood Cells
03Erythrocyte Pathologies & Morphological Variants
+ 2 more learning modules
12h5 modules
Explore Roadmap
medicine
Mechanical Ventilation: Waveforms & Alarms
01Anatomy and Physiology of Breathing
02Introduction to Mechanical Ventilation & Core Modes
03Ventilator Settings and Waveform Interpretation
+ 2 more learning modules
12h5 modules
Explore Roadmap
medicine
Neuro Exam: Localization & Stroke Syndromes
01Foundations of Neuroanatomy and Vascular Supply
02The Neurological Examination: Step-by-Step
03Principles of Neurological Localization
+ 3 more learning modules
18h6 modules
Explore Roadmap