



























Grid cells in the medial entorhinal cortex form a neural map of space through a modular architecture where different modules have distinct grid scales and orientations organized along the ventral-dorsal axis, with the scale ratio between modules following a geometric progression of approximately 1.42, and these cells maintain their characteristic hexagonal firing patterns through inhibitory network interactions that self-organize into grid structures when provided with continuous external excitation.
Grid Cells and Neural Maps of Space – Edvard Moser (Nobel Lecture)
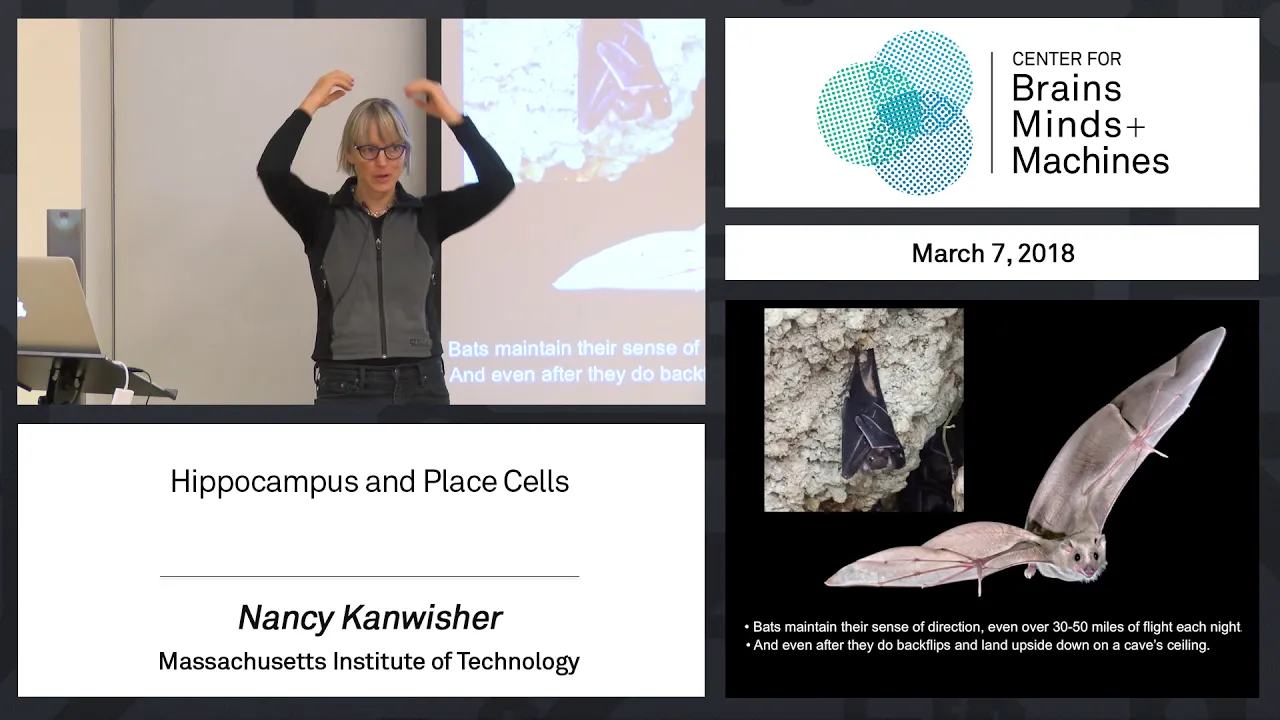
Added:The concept of 'place cells' in the hippocampus, which fire when an organism is at a specific location in its environment.
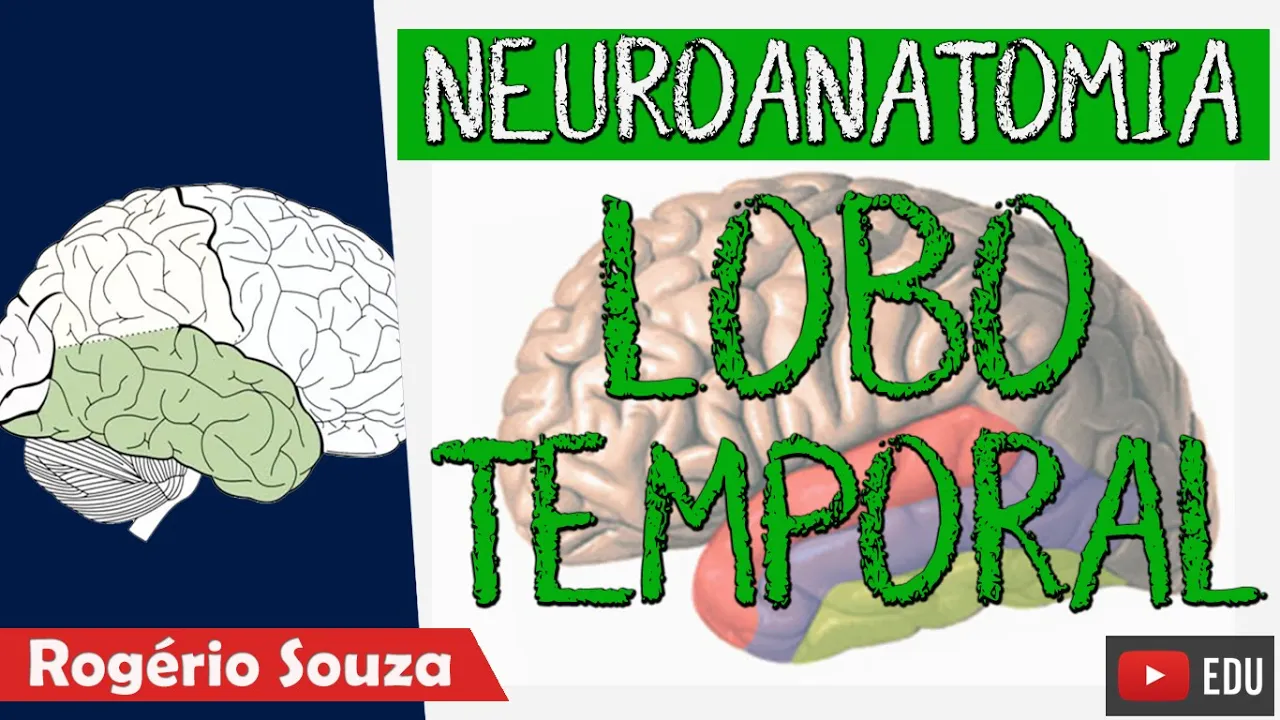
Basic neuroanatomy of the mammalian temporal lobe, with a focus on the structural relationship between the hippocampus and the entorhinal cortex.
Fundamental neurophysiology, specifically how extracellular recording techniques are used to measure the firing rates of individual neurons in moving animals.
The psychological concept of 'cognitive maps' first proposed by Edward Tolman, describing how animals construct mental representations of space.
The neural mechanisms of 'path integration,' which is how the brain calculates current position based on movement speed, direction, and time without external landmarks.
The interaction between place cells, grid cells, head-direction cells, and boundary vector cells to form a complete internal GPS.
The clinical relevance of grid cell degradation in neurodegenerative diseases, particularly as an early indicator of Alzheimer's pathology in the entorhinal cortex.
The application of grid cell network principles to artificial intelligence, specifically in designing biologically-inspired navigation algorithms for robotics.
4.9K views43likes1:35:16Original Release: 2014-11-03
thank you may young C and Chuck other three organizers isn't that right and Peter yes sorry about foret it's okay um it's a great pleasure to be here I look forward to all the discussions uh so what I'll do uh I have two talks one today one tomorrow so today I will uh Begin by uh quickly introducing uh grid cells and try to put them in a context although I'm sure that plenty of people have talked about it already so I'll not spend too much time but still uh introduce them uh and say a little bit about uh how we found them after that I'll uh switch to uh the mechanisms of grid cells which is maybe the most interesting or at least one of the most interesting questions today that is not resolved uh I'll say a little bit about the architecture modular architecture or grid cells this is published off so I will not spend too much time on it and then I'll switch to the unpublished part the last third of the talk which uh I definitely want to spend most time on so I'll switch at least after 50 minutes uh and I'll int introduce two sets of unpublished data at least one of which is uh quite provocative in my own opinion so it will be exciting to see what you think so uh uh let me Begin by uh trying to put this in a somewhat broader context because uh although we do think that space is uh interesting it's not interesting just because it's space uh it's also interesting at least to me because it is uh provides an Avenue to understanding uh cortex cortical computation in a more General sense so if we begin uh very broadly uh with a name that uh I think is common to many neuroscientists and at least applies to myself namely I wish to understand uh cortex uh we can uh just get an impression of how much has happened during quite recent evolution by looking at the size of uh the cortex how it has expanded uh during Maman Evolution just to compare for example the size of the brain uh in a mouse and a human but more interestingly look at how the cortex has expanded and I have some numbers that have been able to dig up here I don't have for all of them but at least in the rat it's about 20 million cortical neurons out of about 200 million in the brain and this proportion increases as we approach humans where it is about 20 billion out of 86 uh approximately uh billion Nuance in the brain so certainly the cortex has really expanded and particularly uh it is the U um the uh uh Association parts of the cortex cortices between the sensory and motor areas that really have grown so we want to try to understand those and how can we do that well there actually has been quite a lot of progress uh in some Fields uh uh in understanding cortex so this diagram which I believe John O Keef already has shown but I still put it up uh illustrates the connectivity between brain areas that uh are involved in in the visual uh in visual processing so this is a diagram from David vanessen uh from 1991 and illustrates the complexity of the visual system you can make similar diagrams for for other qual systems but the point is that at the bottom of the this uh cortical hierarchy you have areas like V1 but actually has been some progress we have the work of Yubel and Vel particularly uh that really started uh an entire New Field and as a consequence of that there has been um much progress in in uh in trying to understand computation in cortex in the visual system it's really where maybe most of the progress has happened with regard to Cortex but when when we go further up from V1 uh we really get into the dark because these are areas that uh where um there are fragments of uh uh knowledge but uh it's really a lot we don't understand so I mean the advantage of V1 is that it's really close to the sensory receptors so we can see look at the relationship so but if you go further up uh then it gets difficult and this is the association quis that we really want to understand if you really uh uh want to get into cognition so uh how about the high ends and the high ends here may be hard to see but it is the hippocampus uh and the aninal cortex here which um is as far away we can get uh from the sensory uh receptors so is there any hope uh to uh understand uh these areas and yes there is because as was mentioned by John o'keef uh in uh in uh one of the earlier talks uh there actually has been some um some progress uh because um in the hippocampus and later in the aninal cortex uh there are actually cells that uh have uh an activity relationship to the outside world that is quite distinct and you heard about play cells I will not repeat what that is but you see an example here firing rate is colorcoded red is high firing blue is low firing and uh this just illustrates the plays that we discovered by oef in in the early 1970s so the hip campus is an area of Cortex which is really high up in the hierarchy where you actually have so clear uh activity correlates to the ex external world that we actually uh offer some hope uh towards um understanding uh cortical computation independently of uh sensory systems and in that regard uh uh it's quite interesting to work on play cells so that's at least one major reason why we uh like to work on it so uh when uh our lab my and I started out in the at the very end of the 1990s there was one question that uh clearly wasn't resolved and that was uh where does this uh uh Place activity come from so there were several ideas around and some of them uh involed um the hippocampus itself so because most of the play cells were recorded in the C1 which is a late stage of the hipocampal loop then uh one of the ideas was that the earlier stages of hippocampus were quite important for producing this play cell signals so an obvious thing to do was to inactivate or leion the earlier Parts meaning C3 uh and then see what happened in ca1 so this is sort of what what got us into this uh business and what we did was to uh remove C3 here as you see here this is a coronal sections of rat brain the C3 is gone on both sides uh the entire dorsal dorsal 3 ca3 is gone and recording electrodes were placed in uh in the ca1 of the hippocampus this is work that vear Brun in our lab uh did most of and um uh the result was somewhat surprising to us because we expected that we would abolish entirely the play signal but that didn't happen so this are examples of cells that uh were recorded after these lesions so these are seven different cells and you can see that all of them have play cell activity in some cells it's uh a bit more um blood firing fields are a bit more blood than usual but overall there's clearly spatial activity that is consistent across time so uh it obviously raised the question where does this come from is it just produced by ca1 in isolation or um is there a role for the aninal cortex and the reason for believing so is that the ental cortex has direct connections into the C1 area which hadn't received much attention but that time but which clearly were important and we recognized particularly this because uh we were collaborating with meno who has now moved to tonim and uh he's a new anatomist and and his work already in the end of the 80s showed quite prominent role for the ental inputs to C1 direct inputs yes sir so this the the stability of the of the field was it the same for um familiar and Noble environments yeah no so that's a good question uh in this study it was uh almost entirely in familiar environments the r were really overtrained might have been different so in in noval environments uh that is certainly possible because there's a lot of additional work on this that I will not present today but um the bottom line of that work is that um both C3 and C both the direct and the indirect inputs are important so uh it's this is just what historically led us to focus on the on the uh direct input but it doesn't really uh negate a role for the indirect inputs so um show you an example recording of uh a recording from uh the ENT medal ental CeX this was with a mar uh in this is now in 2004 and the recordings they uh were from the really dorsal part of the medor Lal cortex this is a rat brain seen from behind and the medial andal cortex is here we're looking at uh at one cell the rat is walking around chasing chocolate pieces and each dot is one Spike and at first it looks like there is no clear spatial activity so somewhat discouraging but as you continue to watch this you will see that actually there are firing Fields just like in hippocampus but um there's something special with these firing Fields first there are many of them but uh as you look further you'll see that there is something about the relationship between the fields they have a quite regular patterns and as you have probably heard many times in earlier talks uh this uh pattern forms a triangular or hexagonal grid that repeats itself across the entire environment so this is now a 2 m large box so we increase the size of the environments to see the pattern better the black is the trace of the animal and each Red Dot is one Spike this this is a colorcoded version for the each of the three cells here and this is the spatial autocorrelation showing the spatial relationship between any point and any other point so you can see uh how uh regular the structure is consists of equilateral triangles that repeat itself forming a hexagonal periodic structure throughout the environment it's also shown here in one of my favorite cells so this is a recording that was made many years later by Christian Fon uh and um you can this is a 220 by 220 cm uh large box and you can first of all see the very regular structure if you look close you'll see a lots of other things too but I'll keep that for the last part of the talk because there are some funny things here but for now let us uh just focus on the regular structure which you can see then how how clearly this pattern repeats itself so um last question then that I'll raise in the introduction is um are all grid cells similar no they aren't so they vary across several uh dimensions and I focus just on three namely the face the scale and the orientation so the face of the grid is just the XY location of the different grid cells so we show one here in blue and one in green and you can see how two examples of grid SES that have a different pH or shifted relative to each other they make difference in scale so two examples here a blue one and the green one and the blue one has a larger scale or in orientation examples here that means they are tilted relative to each other so um these variations exist and uh one of the early questions was of course how is this organized in uh in endal anatomy and uh two principles first non topography that applies to uh the face of the grid which at least apparently is non non topographical it hasn't really been resolved and maybe cannot be resolved with t rods but you see an example here three simultaneously recorded cells from uh the same area one blue one green and one red and you can see how uh each of these three cells uh have different faces and if you it's just shown here for the peaks of each of the fields and if you record anywhere in the aninal cortex you will always get cells that have different uh faces so apparently at a large scale at least there is no strong Topography of the uh face of the grid and this is in contrast to the scale of the grid which uh is much more organized so um this is now a sagital section of the entral cortex medal aninal here beginning up here and then going down and as you see this is an example of recording that is at the very very top of the medial interal cortex uh and you see four cells here that have all a very uh small grid scale they have all the same orientation and then you go further down and you see that the scale uh increases for all of them so meaning that as you go further down you get more and more cells that have a larger scale and this is just plotted uh here so for the um scale of the grid meaning the distance between the grid Fields increases from dorsal to vental and uh the size of each individual field also increases and I should emphasize that these plots are are a they show data across many animals which I will come back to and finally uh for the introduction uh let me just uh emphasize that grid cells have been uh found uh in a variety of Maman species so first in rats and mice uh later they came in bats from na ulanowski lab and they've been reported in monkeys and recently in humans so the the primate ones may have slightly different properties I will hear more about that from Elisabeth Buffalo and uh but uh for now it's enough to say that that these uh uh species orders are from quite the recordings are from quite different uh species and orders on the field of genetic tree meaning that this grid cells probably arose quite early in maleon evolution question yes so what about orientation how is that organized in the yeah I'll um I I'll say quite a lot about that actually it's even the unpublished data so that's the most exciting part of the talk I think myself so I'll come back to that okay um then uh a few words about the the mechanisms of the grid pattern and here I can't really provide you with any clear answers but I still think it's such an important question that I should include it uh there may be a few things we can say uh at least uh and one of them is uh that I think we will all agree that there is no gridlike pattern in the outside world so this is not something that is derived from uh by extraction of sensory inputs so it's something that's intrinsic in the brain maybe in the aninal cortex uh that actually makes this pattern that's of course very exciting I think because it offers a way to understand one form of of pattern formation in in the cortex the other thing that I think we can also most of us all I think would agree that there is something about the coherence of uh of activity in different grid cells they tend to behave very similarly so I haven't shown you data on that I will say more about that tomorrow but uh it's still um quite striking it was striking the in the first recordings both from our lab that been showed that if you record grid cells several grid cells from the same environment maybe a square or a box or or a circle or a different room those cells that fire together have similar grid fields in one room will also do it in the other they may be shifted they may be reoriented but they always stick to together so that's something that cells really like STI to stick together and uh similar results come from data from U from Neil burges and Kate Jeffrey uh in um London as UCL which also in under other conditions show that uh uh in novel situations when there is an expansion of grid again it happens coherently uh across cells which all of this is consistent with a network mechanism and uh often interpreted as consistent with an attractor mechanism so attractors have been around for a long time and uh I'm not the right one to give you a detailed account of that but uh I still want to summarize it in very general sense to give you uh background for where the field is uh today so this is I would only focus on network mechanisms today and not say anything about possible uh single cell mechanisms although they don't exclude each other so um it's been idea for quite a while that you can actually generate localized activity by uh continuous attractor networks so these networks uh were suggested for uh spatial systems uh some it's almost 20 years ago now actually uh so early data which set this uh stage where continues attractor mod from from mishic and tski uh and from stolinski who worked on this for orientation selective cells in the in the um visual cortex kin song who introduced this to head head Direction cells samonov and mcnorton who made models for U play cells um and the play cells are the ones I will focus on because this is uh for spatial activity and the idea at that time which still is uh around was that you can get localized activity in a network which has uh satisfies uh some requirements and one major requirement is that uh networks are coupled such that you have strong connectivity between cells that uh have a firing correlate at the same place in the outside world so this is a network where cells are arranged cells are the dots arranged according to their preferred firing location in the environment so cells that are dots that are close to each other fire in approximately the same location and then there are strong connections between those and the strength of the connections decreases as you go further away from a given cell and you must have an inhibitor is around uh in order for this uh self-supportive activity not to get out of control and the idea was then that with inputs to this network that carry information about both speed and Direction you can actually move this bump of activity that arises out of those excitatory connections around in accordance with the rat's movement in the outside world so this is a very very brief summary of those models but meant as an introduction to the grid cells where um when the grid cells then came in 2005 already uh the year after there were several models around different models but one of them uh and that particular the one from from fusan tety suggested that these uh activities bumps of activity could arise many places in the network in which case they would start to compete with each other and maybe push each other way as long as they have these inhibitor surrounds and then they show that you can actually over time the network will self organize into hexagonal pattern of uh activity and again you can translate it across this uh uh Network by having directional and speed inputs but then um Coming closer to today one problem for endoral cells was that uh that uh there aren't such um at least for the stellate cells in the ental cortex which contains maybe the most regular grid cells and the most of them there aren't any um excitatory connections at all they're virtually absent so it don't quite fit this uh model and uh this is based on data from menu's lab uh at our Institute so what they did is two things first they recorded from in patch Clum recordings in slices from uh Stell cells in the medal andal cortex and then stimulated at all possible places around to see what kind of responses they got in these cells and consistently everywhere where they stimulated they would only get an inhibitory response in the recorded cells and this is just shown quantitatively here with a zero here and negative amplitudes to the left and right you have positive amplitudes and the stellate cells are the red ones and you see that they are all negative whereas for pyramidal cells is quite few but there are some positive ones and for interneurons there are positive ones and the same is confirmed in the SE second approach in their study so uh where they recorded from uh four new Ur at at the same time quite often sometimes three neurons and sometimes two and with J C was the first author and again the recording was that if you stimulate a certain number at least three cells and record from the fourth one uh you will always find in adult animals that uh there's only an inhibitory uh response you don't always actually usually you don't get a response if you stimulate only one but if you stimulate several you always get an inhibitory response no excitatory responses in Stell cells at all and this is just shown here the red bars are responses that are excite are in inhibitory and the black ones are excitatory ploted as a function of age and you see the the excitatory ones are absent for the state cells whereas for Pabon cells they they they're very few recordings but they do have some uh um some uh excitatory ones uh another thing I should emphasize is also that it's not just that it's inhibitory but also that uh the inhibitory responses had a surprisingly similar amplitude of response each time and then um I should I could have said based on this uh yasa Rudy who's here uh developed the model but actually the interesting thing is that uh yaser and his group developed Ved a model of this independently not knowing about uh at Men's results on the inhibitory connectivity and that uh just so independently yers group developed a model based on just inhibitory interactions between U between stet cells so they each sort of push each other away and uh what they showed was that this was sufficient to generate exactly the same hexagonal patterns so if there is an inhibitory in such a network each dot each pixel here is one cell and each has an inhibitory surround uh to cells of similar faces uh certain rages certain strength and you just let this uh uh work by itself it's very soon organizes itself into a hexagonal pattern um yeah I should also emphasize that although uh this is consistent with an earlier paper by Burak and Thea they didn't emphasize the inhibition but uh uh it's apparently present in the equations isn't that right y so um still on the model uh what the model showed was that uh um it's quite it's quite important that this would only work on one condition and that condition is that there is a external tonic external excitation to the network you don't get this self organization unless you have a steady excitatory input which could come from in principle anywhere but in this case uh it was hippocampus supposed to be hpoc campus but doesn't exclude can be anywhere but the point is you need that input to keep the cells close enough to filing threshold and uh then you get that activity so in the model when they REM removed uh that steady excitation uh what then happens is that uh that the uh um the the the grid score so the grid structure of the cells disappears as you get weaker and weaker excitation and so that's um one observation in the model but what the model also suggested is that as you go from 100% ex excitatory inputs and now go to the left uh and uh if you look at the at the strength of the directional signal of directional preference of of these cells as you get weaker and weaker hpoc comple or excitatory inputs you actually get a stronger and stronger and stronger um directional component in the grid cell so in other words the grid pattern disappears as you lose the excit input and at the same time you get a directional response and why is that it's because there is this background input of directional uh uh firing that then is kind of unmasked so um this um I could have said we tested this but as again not the correct um temporal order because these are experiments that we actually had started uh uh already around 20056 prob uh where what we did was to inactivate the hippocampus and then see what happened to the grid cells and uh um you'll soon understand why we never published those data because we simply didn't understand them so first of all this shows just the experiment musim at that time there was no genetics or pharmacogenetics so we put musol into the hippocampus and then recorded grid cells the firing rate of the hipocampal neurons is shown here so it just verifies that the mol is effective simply shutting off the hip campus and then under those conditions uh we and that means ton in particular recorded grid cells from ental cortex you see before condition here and then as mimal is infused hampus the grid pattern disintegrates and then comes back when the mimal is out of the brain shown the same here for the number of grid cells so that was perhaps not so surprising but what was more surprising and which uh uh made us keep this data for 8 years before we published them was the following uh namely that at the same time as the grid cells lost their grid pattern they became directional and we had no clue why this should happen uh because it was quite consistent finding you can see it here too this is the number of cells that satisfy criteria for head action cells time on the x-axis and you see the percentage increases out of original grid cells uh none of them were virtually none of them were directional and then approximate top of them are directional after a while uh and why should that happen and I think if you now go back to uh to uh yaser's model this is exactly what happened in the model too as you remove the as you remove the excitatory input that is necessary for the uh Network to self organize into this grid patterns uh you get this directional input on mous so it's consistent with the model that doesn't mean of course that uh it's not no proof um so it's still just a working hypothesis uh and exactly how this is implemented in the quite complicated network of theal Cortex is also not known uh but uh I mean there are for still it's I would like to mention three things about attractor models that will be things that uh we and others definitely uh work on during the next few years so one of them is the connectivity that is assumed so in those models that connects cells with similar grid faces with each other and cells with different grid faces less with each other that's an assumption there's no evidence that this happens at all um but now there are um ways to test it and actually similar uh connectivities have been demonstrated in the visual Forex again where uh work from both from Tom mik Fel and from Young dong and others have shown that cells with uh similar orientation preferences are actually preferentially coupled so it's somewhat similar and I believe that's actually suggest it's not impossible it could be that way um there is also other work that's coming up which uh I will not mention because it's not published but I'm sure y can mention it uh in a few weeks that is consistent with this another challenge perhaps yes sure so the the emergence of directional tuning when you get rid of hipocampal activity could arise in at least three ways right one is that the network in the internal cordex itself is tuned to generating directionality and in two Dimension when the rates are running in ca1 there is less directional tuning so it's the intrinsic to ental or two it's coming from neocortex or three from some other areas y do you have any ideas about no I can't say that in uh again Yer should should should comment on this afterwards but in the model there is directional input coming in from outside but that's the way it's made in the model certainly doesn't exclude that could be made in other mechanism either intrinsically or from somewhere else I don't know if you we don't so uh um um another thing that will be important to work on is uh is the problem of noise which is general for all kinds of models of G cells so but in this this case particular the noise in the functional connectivity between the cells because the models are idealized and uh in in real life uh the con connections aren't equal in all kinds of directions and and uh distances that's definitely not the case and the problem is that if if the connections are stronger one way than the other for example that uh will uh have um the problem that it may tra the tractor activity yeah so on that on that point Have you ever analyzed in these grid cells that are you know directional without their have you checked whether the degree to which that directionality is modulated by movement speed so for example are these speed filtered uh anal you if at Stillness does the directionality still appear uh no I don't think we have analysis that speak directly to that so would you expect that U the directionality would then depend on the speed well it's an interesting question in part because if this if if the grid cell network is doing translational path integration and you're talking about the drift of the bumper right so one function that that directional in could serve is to help sort of channel the drift of the bump in the direction you're most likely to be moving you're facing that but if you're not moving what you want for stability is for the bump to be pushed from all sides and squish down to the smallest Point possible so if if if the rat is not moving you might actually expect to see this direction or Advantage if you're doing speed filter analysis see that yeah it's a good point yeah I would expect that but uh it's actually we have the data so it shouldn't be too difficult to check yeah more precisely as kin originally showed this directionality has to be linearly proportional to speed otherwise the attractive model can't track movement corly that' be nice to see somebody analyze that it's not the directionality that it's the the way the directionality will affect the great patter this doesn't have to be in the input that it receives no but in the in the theat model which I thought was the one that your model grew out of actually that that asymmetry is via the directional firing uh in which case the two are the same but but the uh there could be a baseline uh directionality response and on top of that the velocity depend on component so it doesn't have to vanish well well Tad's point is that when the rat's sitting still but heading in a direction if the directionality is still there the bump will drift no it won't because you have you have grid cells with different directionality so all of them will pull in different direction so if they have directionality then they won't be firing if it's not facing that way so if it's it's sitting still facing a particular direction then you'll have a net directionality unless the directionality goes to zero at zero speed if all of them have a baseline head Direction response which is not tun to Velocity then this would not generate motion but if well we're talking about the the velocity tuned bid right the velocity tuned bid should be but no but suppose they all just have a directionality which has nothing to do with velocity then they're facing in a particular direction so the bump will shift in that direction because the ones facing the other direction won't be in as much we can discuss this later I don't think that that's it comes down to the three at least three choices of where the directionality comes from right and as as far as I hear you guys are agnostic about where it comes from we are agnostic and I don't think really that directionality is going to help with the drift I think probably there are other smarter mechanisms like the one that Misha sodic has talked about like gain modulation I don't think the the the directionality is going to but you could have the directionality in the connection weights rather than in the firing rates but the only actual model that does path integration accurately is the one that Elias Smith came up with the play cells which either F then modified for grid cells that accurately path integrates and that's because it has directional grid cells or play cells which are linear in in speed that's why it's accurate all right um let me just mention then at the end of this uh section that um that uh the possible presence of attractors doesn't exclude alternative mechanisms that uh that may partly depend on single cell mechanisms and uh uh particularly um I know that yasa is collaborating with Alexandro based on the crant Tris uh model and there is the possibility that they may actually operate together because the question that arises is what happens during early developmental stages where data both from our and from from London suggested that at early stages the grid cells look really crappy uh and that at that time but they are there is at least uh above chance uh and at that time there is also very limited inhibitor connectivity in the network so that connectivity can't really make it yet so uh that will be interesting to see during the next uh few years so uh I should uh move on because I really want to get to the new stuff but I want to say a little bit more about um about uh the or the architecture of the network and again um one reason that motivates such an analysis of the architecture is uh is based on these attractive networks because implicitly they assume that uh in order for the activity bump to move around in a network in a way that reflects the animals mov movement in the environment there must be uh the the network must actually consist of cells that have a similar uh spacing similar orientation which which then gives this translational invariance and if that is not the case it's much more difficult actually to to to model the activity so um this is challenged then by the fact that uh grid cells come at different sizes as I mentioned um these sizes are organized along the doors of vental axis as I mentioned beginning with small ones ending with big ones um but um the question is then is this a continuous organization does a small scale go grow gradually from dorsal to vental towards large scales or could it actually be a steplike process and that's quite important because the continuous organization would be much harder to explain with an attractor n Network model whereas a modular organization would be easier because each module uh could then consist could then uh correspond to uh one attractor Network so this uh uh has been difficult to address uh was early on because the number of cells you really need from the same animal to tell whether it's step like versus continuous needs to be quite large and uh although there were data early on from uh Castleberry Neil Burgess and Kate Jeffrey that suggested that uh there might be some jumps uh it wasn't really uh until uh we got uh uh tour and H andula into the lab we were able to record up to 186 grid cells from the same animal that it really convinced at least me that it was modular so I'll show a few of the data do not want to spend too much time on it because it's published but uh their approach was either to record tangentially in the ental cortex or with multiple electrodes uh at several places uh in the ental cortex and this is the basic finding showing uh do of ventral axis here on the x axis so do vental positions cells rank ordered from 1 to 50 in this case and then the scale or the size of the Grid on the y- axis and you can see first of all there's an increase in the scale of the grid from dorsal to vental as we knew but uh more importantly uh you can actually see that there is a steplike process there are some scatter which always is the case in biological systems but uh it really falls into in this case four bumps uh in other cases uh you'll see the same like this this are individual tet roads from one animal that have many cells and you can see these discrete jumps all the time the the the scatter in this direction doesn't matter which one you mean here or like that because oh no that that that is noninformative it's just the rank order on the doors of vtil I think that it can be that you record at the same location but you get a GD size of 50 and right next to it you get a 40 the thing is that you either get or 50 exactly yeah so it's not it's not it's different from uh from maps in many other coures where you actually have a close correspondence between the parameter you you map and anatomic location in this case they overlap substantially I'll show you one since you asked about that here um this shows the same plot that we looked at and what you can see also here is as you go from dorsal to ventral you first just have um one one uh scale of the grid then you add the second but you keep the first then you add the third keep the second and the third you also see here as you go more ventral you don't really get rid of the smallest you just add on and add on so that you get you get very ventral you have all scales intermixed with each other okay um so um then um how independent are are these grid modules so we know that in they have different scales but are they different on other properties too this shows the orientation of the grid U so um you have three examples of grid cells recorded simultaneously from the same animal and you can see that there are G different grid orientations uh at the same time um so you I don't have to say more about that now we'll come back to it uh but if you now plot grid orientation versus Grid spacing this is one animal each circle is one cell you can first see there are different steps of grid spacing 1 2 3 four maybe five uh and then what's important here is that the different grid spacings also have different orientation so there is co- modularity between grid scale and grid orientation the boundaries between them are always at the same place okay um and uh I should also mention that if you you can analyze other parameters too so like you now you have grid space and grid orientation you can look at the asymmetry of the grid because the grid is never perfectly symmetrical so the degree of symmetry also varies between modules equally sharp boundaries and even the Theta frequency there are slight variations in Theta frequency that also vary with with the modules so um uh and even if you test these animals in behavioral experiments where you change the shape of the environment they uh go together I'll say more about that tomorrow so strong uh at least there can be strong dissociations between these modules uh but uh within modules it's uh quite rigid so this just shows this is a cartoon not data uh Show an example so this is well to the left you actually have real data from one room but this is what you would see if you tested it in a different room or in a in a different box and the point is that cells keep their intrinsic relationship so three cells that the blue green and red that have a certain relationship or grid phases will keep that as you change the environment so this is quite different then from what you see in the hippocampus where you have clear remappings that look very AAL so the rigidity scale orientation and uh and face are preserved across environments so how is this map uh organized on the cortex I'll just mention that very briefly um this shows uh data from uh an extensive recording across a quite large maybe onethird of the part of the uh the aninal cortex is a flat map of aninal Cortex and uh the recording locations uh the DAT positions where data were recorded are shown in red here so you have dorsal on the on the horizontal axis here and you have lateral uh ventral from top to bottom uh here so um recording over all of these places we thought perhaps would recruit additional modules so you know the the data I showed you uh just a few slides ago were mostly from uh single trajectory Tories so we thought that if you have multiple trajectories at many places perhaps you get more modules and that actually turned out not to be the case because if you lump together such recordings with uh uh from many many places across uh wide space you still only get these four plus modules actually there is probably a fifth one but since it only had one single field we couldn't really call it the grid cell but in any case the number is low um so it doesn't seem like there is much modulation in the horizontal Direction and this is confirmed by this recording across uh more than a millimeter of ental Cortex 2 seconds uh and and within which there is is no modulation so no modulation in the medor lateral axis but a lot of modulation in the doors of vental axis and then you got these four five modules yeah how do you know that there is possibly just just one additional uh grid cell with a single field maybe there are several with high yeah no of course I don't know because uh the recordings for technical reasons within the size of the environments we have uh it stops at grid cells that have uh a spacing of maybe something like 1 M and we know that are grid cells that have spacings at least until 3 m so there must be more modules pretty sure but based on if the dens of modules is about the same as you go from dorsal to vental I would be surprised if it goes much further than 10 that's what we guessed if you have if you have rats that are raised in a different environment say a larger environment would the distribution of these modules change yeah it's a good question we're working on that I can't give you the answer but we are raising rats in differently shaped and sized environments to see if you can perturb any of this and uh I don't have any strong predictions so we'll just wait and see my answer did you have I say 50 minutes oh oh okay but an adult R if you put them that in another environment size I don't think that would change it no it has to be during development yeah all right 50 minutes have passed so I should just mention two quick things this I mentioned already uh and this I can skip but uh what I do want to mention is the scale relationship between between the modules and with scale relationship I mean if you take the smallest module with a uh with the smallest grid uh distance then you compare that with the second module which has a slightly larger grid scale so what you do is to take the scale of number two divide by number one then you compare with what you get when you uh divide the scale of number three by two and 4 by 3 what you end up with then is this distribution so each circle here is one module and from different animals and the crosses here are the averages and what you see is that the scale Rao here is surprisingly constant there is a lot of noise but uh it ends up with at the ratio of 1.42 1.4 maybe uh in each case which means that actually as you go from the smallest module and then up to the fourth one at least you have something that looks like a geometric uh uh progression so you just multiply by 1.42 for each step so uh this is actually square root of two but what that means is another story but the interesting thing that I want to focus on now is that it is organized like a geometric uh progression and there have been people um who um uh like matis and colleagues in Andreas hats lab who have calculated on this and uh found that uh this might be the optimal way to actually represent environments at a maximum resolution with a minimal number of uh neurons so um this is um I think the function of this is still yet to be understood but um these are the data yes sir but that's a question for talks because you had this talk on you had this talk on Friday which the ratios would be what uh they would be always different it's not geometric depending on your theory would be that it would be 2 to one and 3 to two and then four to three right yes but I I think I think there's a lot of scattered here and what I did is I and and there are different this this there are different parameters uh for different animals depending on how big they think the environment is oh The Rao changes and and so you can't you can't compare you can't look at the ratio between animals but I thought the the ratio would always be 2: 1 3 to2 that's that's for one animal so if if the scale of the things change then they would so so this this Theory says that uh one the one I talked about says that the that the length of of the grid scale is proportional is equal to a number divided by the grid level 1 2 3 four five this says that it is a 1.43 to to the power exactly 1 2 3 4 and uh and those are quite different theories and so would it would it not be good if just we get data from this and for individual animals and then system and I and yeah and what that that curve that I showed that was a straight line it would be a curved line for this that's something to yeah I definitely look forward to seeing it yes absolutely in this plot chck predition would be two for the First Column one half for the second one and 13 1.33 for the last one which doesn't but he's saying that there's multiple animals here so it should be a curve for each animal on on the plot that I showed where I said the things look like they're thr in a straight line it would not be a straight line it would be a curve I understand what you're say and and and and it doesn't look like it's a curved line if you do it Animal by animal yeah okay we keep all the data for one animal the same this that that theory if you make a theory out of that that's a two parameter Theory because you have a proportionality constant and the number one point2 or something the theory that I gave has only one parameter in it that's that that's right that's the largest value of L yeah all right I'll move on because now I get to the unpublished data so I'll first present a small chunk of new data and then I go to the big big one afterwards the first is about uh what determines the firing locations and you have already discussed part integration quite a lot so I I will not really repeat what that is but uh just say that uh intuitively um if part part integration might be a quite attractive way to to determine firing locations because it provides continuous uh sensory input quite in contrast to visual inputs so if we compare here this is this is uh from the first grid cell story grid cell paper with tur hoffing uh and uh it shows just the record from darkness and you can see that as you switch off the lights you maintain grid firing which then suggested already then that at least visual inputs aren't very important and consistent with the idea that um that U self motion inputs might be important so and more direct you didn't control for auditory I get asked this in classes quite a bit you didn't control for auditory or you can't control for everything we did wipe out odors and things like that but of course you can always say there's something left and especially in square environments the the rats can go and whisker around the walls and that that is quite useful so I I think that that is the reason for doing more um sophisticated experiments I'm going to show that one here which is a much more direct uh um test so this is uh based on this is actually a study from two 2009 by Dory Derman who was in our lab uh where we train animals in what we call a hair pin maze so the rat just walks through this maze like this from right to left or from left to right um and what he observed was that whenever the rat passed um uh turn here then the grid pattern was for some reason reset and began over again and then there were two Fields like this for example each time the rat went down the road like here it got two Fields like this so we exploited this phenomenon to ask what could be uh could there be could this be used to tell if uh the cells fire in relation to how far the animal has moved from the wall which would be consistent with the PA integration mechanism or would it depend on the external cues so uh what we did was to just make a shortcut in one of these uh alleys like this so block this part and then if the visual fuse outside was what matters you would expect to get similar firing uh on each of these alleys but if it was the distance from the wall that matters you would expect something like this because it should was a distance from here that matter and uh basically the results showed a pattern that was much more consistent with this possibility than that possibility and this is just one example cell but if you quantify it plot the distance from the start of the short arm so from here and then down like this versus the distance from the start of the long arm you see that there's a strong correlation meaning that it actually reflects at least for quite a long stretch from the turn the distance that the animal has moved which is then consistent with such a part integration interpretation so the reason for bringing this up is not that I want to talk about part integration but it is because um because if part integration matters then the system meaning the grid cells and the other cells in the ENT cortex must have access to speed information somehow where does this speed information come from uh there's not really clear evidence for it I mean we know that grid cells uh are speed modulated but that is so weak that you really need lots or lots of data to actually see the relationship so that hasn't really been satisfactory and that led an a crop who was in our lab is now in venos Iris to construct different type of apparatus so this is a linear Tru standard linear Tru but uh on top of it is uh what we call a Flintstone car and for those who are old enough will remember this so the way Flintstone car works is that you walk inside the car and then there is a barrier in front there's one behind that then determines the speed of the Rat so that the computer can control the speed of this cart and then we can get the rat to move at any speed we would like and uh this shows the basic result so um this is from speeds from left to right or from uh running from right to left and the gray is the uh speed of the cart uh and then the red and the blue is the fire of the cell so this is one cell this is another cell and you can see how these cells really match the speed of the animal so these cells are not grid cells they are not head Direction cells there are other cells in the aninal circuit that have a very strict firing relationship to speed so there are several groups here 74 21 28 cm/ second and this is the firing rate and you can see how how um many cells actually have firing rates that reflect the speed of of the U uh animal so but that's across the population then each cell is tuned to one speed because some of the data you know from the O papers and you know so on have seen actual linear relationships within cells but this looks like it's different cells responding to one speed is that right yeah so the these are um cells that uh as you see on this plot they U they are not grid cells they're not head Direction cells and each of them respond linearly to to to speed so if you plot the spatial information which is highly correlated with the grid structures we can also plot it for for gridness on one axis on the other axis you have directional information in bits you could use minor length if you want and then uh of course you have a pop so each dot here is one cell and you of course have a large population of cells that are have respond strongly to Direction and many of them also to to spatial uh information you have another population that has high spatial information but uh lower head direction information these are classified as grid cells you can also but then uh the point is that you have a third population here that um are neither grid cells nor head Direction cells and uh uh are very strongly tuned to to speed and this is quite strong I mean it's quite strict criteria do you have a picture of the tuning though is it a linear response to speed like the for a single cell you mean the firing rate to single cell yeah unfortunately I don't I have I mean this is average data uh for for but uh but for the individual cells it would look somewhat like this so I I wish I had the plot here but fortunately it's quite linear so these cells have been seen before but we didn't know where they're coming from they were probably axons for of course uh I think they are from ental cortex I mean this certainly such cells have also even been seen in the campus but uh and we also have recordings from uh the hippocampus but very was perfectly linear and you could put a weight on the animal and it was still perfectly linear with speed and not effort but we didn't know where they were coming from yeah no where they're coming from it's a good question we still don't know that no but but now we know that it's present in the system that's the point I want to make are they tuned to yeah yes M it's okay are they tuned to a specific speed or they have sigmoid tuning curves uh as far as I I mean the data not the analysis are not finished but my impression is that it's looks pretty linear is that what you mean the the firing rate yeah firing rate increases is high for some speed and it's lower for both higher and lower speed is that the case or is the tuning curve such that it is no the tuning curve uh as far as I uh know is uh linear related to the speed uh of the animal I see yeah okay uh I don't know who was first Peter probably so in the next in the next Slide the way you go one slide forward yeah so how do you do how do you decide how do you do the classification here it looks like one giant Continuum Le in this space was there a different way to classification yeah so the way it's the the cells are classified into head Direction cells grid cells speed cells is that that we use the standard criteria for head Direction cells that they have Direction tuning mean Vector length above the 99th percentile or Shuffle distribution similar for grid cells that they have a grid score above that shuffle distribution and the similar shuffling was also used for the speed so but but they so they overlap that's true but the number of sales that actually satisfy two criteria is is quite small I mean they are the ones that have different colors here yeah um so this this new class of speed cells does that account for all the nonspatial cells and yeah I don't think so I think but but a significant part of it so it's sort of filling up there's still lots of cells that have properties we don't understand okay I should Mo move to the last part now and now I have 25 minutes 24 minutes left is that right much yeah okay so the question then is how do grid cells anchor to the environment that is the final topic uh I want to talk about because uh grid cells would not be really useful if they only were based on part integration inputs because there is of course the the risk that the fields will drift around with um over time they will start to drift so that the fighting will not be consistent at at certain locations so we knew already from the beginning that that was not the case because if you record on successive trials uh in the same place this is what you get so look at the first cell up here the firing Fields appear exactly in the same position on two different trials and in between here the animal can have been back to the animal room and still the firing uh resumes at exactly the same spot always so there must be some anchoring of the grid relative to the surrounding environment and the same is suggested by the fact that uh if you rotate uh Salient uh cues outside the environment like the Q card in the circular environment if the curtains around here uh rotated 90° what happens is that the grid also rotates 90° with the Q card which then means that it does care about the external uh suround suroundings so there must be some anchoring process of the grid to the environment but how how does that uh happen well uh then um we now back to to data from T and hul in our lab and uh what they noticed was that there is surprisingly few Solutions actually that are chosen with regard to the orientation of the grids so here are four different rats and uh when you plot the uh the grid Maps or the autocorrelations relative to the Box what you actually see is that the orientations T tend to be quite similar across animals it's not a random distribution so let's look at quantitative data then so this shows data from 587 grid cells from different animals seven different animals or six different animals one had two hemisphere um and the plot is made in such a way that uh they took the auto correlation Auto correlogram here uh defined the center and the six surrounding points and took those seven points plotted them into this galaxy plot here so for each cell there are seven different plots including the Cent um then for we plot all five 587 uh cells and uh the references here are the is the box frame so this is the the Y wall here in green and the uh X wall in um in uh um uh Brown so what does it show well clearly there is not a random or uniform distribution uh here the data tend to Cluster around certain axes and those axes are in this room this is 150 by 150 CM box they cluster around the axis that is defined by the uh by the x axis here you see the this is the x- axis actually this is confusing because the the colors are reversed so sorry about that but if you now focus on this just don't care about this here is the correct so uh the the x-axis is green you see that here and then multiples of uh this uh x-axis of the box is shown here this is 60° 120° and so on you see the data cluster around the the the axis uh the the x axis or the X wall of the box and there's almost nothing in between and this is shown also if you summarize across CS here are are you rotating them to match cuz some would be aligning with the Y AIS are you rotating them to Define that as the xaxis cuz your examples of above are both more oriented to the Y AIS um yeah yeah sure uh this is actually a bad example so because this uh uh they are not rotated so the plot data plotted down here they are actually as they appear uh in in the reference frame defined by the camera so just don't think about these just look look at the examples here and you see that uh all of the cell actually follow the x-axis as you see on this plot down here uh and then 60° multiples of that this is in one room but if you look at in other room it can also be different so this is in a 220 by 220 cm box and now you see that both frames both the X wall uh and 60° multiples of it and the Y ball and 60° multiples are represented so data cluster around uh the axis defined by both walls so this is still not so surprising perhaps they're just aligned with the walls either one of the walls in this room or both the X and Y walls in this room so um then let's look take a closer look at the data and uh um now focus in on the distribution of cells across uh um uh orientation relative to zero and zero is perfect alignment with one of the walls so we Define the orientation of the grid relative to uh take the axis that is closest to the wall and then Define the orientation relative to that wall and what you see is that actually it does not fall on perfect perfectly on the axis defined by the wall but slightly off either slightly to the in One Direction oright in the other direction and slightly actually means about 7 and 1 12° and if you just lump these to together by just reflecting on each other this is the distribution you get and the peak here is 7 and 1 12° and then there is almost no cell that has uh a preferred orientation has an orientation around 0° or around 15° is even worse so the orientation shy away from 0 and 15° and really prefer 7 and a half like in this example here so why is that well then we can generate some hypothesis uh and one possible idea is that uh orientation actually matters for disambiguating uh different parts of the environment and different by different parts I actually mean uh activity along the walls of the environment so this is the X wall this is the Y wall and if you have a 15 Dee orientation then you actually have the grid oriented such that you have 15° offset both on the y- AIS and on the x-axis so you might imagine you get somewhat similar activity along the two walls with uh 30 that may to some extent be true too because you if you have a 30° Offset you sort of uh at a slower frequency also repeat uh dots could be uh whereas with a 72 Degree offset like here you might actually get more unique activity along the X and Y walls so this is a hypothesis it's not really this just the idea that we went on to test and what two sta did was that he uh defined 100 idealized uh grid cells in the computer stack them on top of each other uh like this and then used all kinds of faces so randomly distributed faces among those 100 cells and then did one simulation for each orientation starting at 0° and 1° 2° 3° and so on uh and for each um for each um experiment computer experiment what he did was to Define uh population vectors along the X wall and along the yall so for each for successive steps along the X walls and for successive steps along the Y wall and then correlated the population vectors uh along the X walls with the population vectors along the Y walls and compared then those correlations for each of the orientations that it tested and I'll show you the result of that simulation so what it showed is that you for um for 15° uh grid offsets you get maximum correlation and maximal correlation is perhaps what you really want to avoid when you uh want to get uh to to increase the dimation of the walls that's bad 15° is really bad minimal correlation you get at 7 and A2 deg so this is the orientation that actually gives the biggest difference in population activity along the X and Y walls so um if you now compare the simulated data with the experimental data this is uh what it looks like so if we uh stay with the simulated data first so just to repeat you that's the Brown curves Here and Now turned upside down and the correlation absolute correlation is here uh and what this is what you get the maximum correlation of 15° correlation at 72° and then an increasing correlation again at 0 de if you now compare with the obser data you actually have a minimal correlation at the uh 15° where you have the maximal correlation in the in the uh simulations and you have the maximal presence of cells the most the largest number of cells uh have the 7 and a half Ori degree orientation where you get the minimum population correlation so that actually is a match strong match between the simulations and the actual data we can in a general sense perhaps suggest that the orientation is somehow by the system uh I say system because I don't know what it is chosen in such a way that uh the the orientation of the grid uh maximizes uh difference or disambiguation between different parts of the environment and by different parts I say parts that are related to the boundaries of the environment so uh this is square boxes if you do the same in a circle um it is more disorganized so there's still some clustering which uh I can go into the discussion if you want but uh the bottom line is that uh there's much less uh strict uh 7 and 1/2 there's not really clustering around 7 and A2 any longer and perhaps finally uh this is a a thing that we soled this night so I got the data this morning so it's really fresh data but the reason is that uh that was something we really didn't understand so if you you remember perhaps you saw this slide earlier on this is data that already appeared in the 2012 paper and the point is that the distribution of orientations in this rat actually has a Peak at 15° which is really what we avoided so we did not understand how does this come about because there are so few of them so what happened to this right this is crazy but it may not be so crazy after all because uh this is the analysis this this rat has really strange grids because that grid actually uh break breaks in two parts so the mean grid orientation if you just use a three Define axis by averaging across the whole environment then you get 13° which is close to 15 which you really want to avoid but if you now look more closely here and actually Define local grid axis this is what you see so you can see that in the bottom triangle here the grid axis are the stipple lines here uh and if you compare for the upper part here it actually has a different orientation and same if you go the other way around see that you have a Bend approximately along the diagonal here so it means that if you compare those two halves then actually it uh the orientations are very very close to 7 and A2 deg or maybe they are even 7 and 1 12° but if you just take the average which you shouldn't do because it's two different grid Fields then you get 15° so again it shows that even in those deviating cases you actually have 7 and A2 degree offsets and it also suggests that then this implies that grids are much more local than we perhaps have thought because they anchor to the nearest wall and that anchoring uh is applies to a certain distance away from the wall but not infinitely so at some point the other wall that is closer this orthogonal wall in this case takes over and then in the middle you get some sort of compromise that the the cell settles into uh and around that the pattern may not look so gridlike yeah you do you know whether uh in this red you see this Distortion in different modules or just in this one in this module it's consistent uh across cells but uh for other modules I still don't know because as I said this came in this morning yes um but what I should then finally in the final slide just go back to the question of whether there is a universal grid and uh these are the data from Dory dman who is now at at in Tech in h um which U were done in this hairpin maze that I presented and as I said the point was that the grid breaks up at each turn of uh the trajectory in this uh mace and what you see here is that the fields repeat itself for each turn so the fact that the grid breaks up at each turn sort of is consistent with the general idea that there is no Universal map that stretches from here and to Tahiti but uh actually there they are much more local than we perhaps thought and they may actually then be even in Open Fields where uh there are no uh clear defining local borders like in her ma the grid may be local in the sense that it relates to one wall in one part of the box and to another wall in another part of the Box um so it's consistent with this fragmentation of the grid that was apparent in in dory's uh study and uh that brings me to the find I will not conclude anything but I I do want to say that there are lots of people who have been involved so many that I can't really mention them but yet I will mention a few and especially those that related to work I presented today the early work Brun Mar t m particularly involved in the early work um and also others who were involved Bruce mcnorton Carl BN and alander Travis men in particular and U the the mechanisms especially us Rudy and his group Men of it for anatomy uh the modules two and understand Sola have really been important uh and the same for the orientations also there work ailio crop for the speed cells and I mentioned Dory for the part integration stuff um and I think uh that more or less covers it and I should not uh at at least I should uh at the very last I want to mention my vitm who has been my colleague on all on this and involved in every aspect of it so that concludes it thank you very much 7 minutes left 7.5 minutes 7.5 minutes yes so the the 7.5 degree is very interesting you you gave a slightly different explanation for it two weeks ago in space bra I thought oh did I which I like well the difference between two weeks ago and here is that uh we now have this data that clearly suggest is local I I think that I probably didn't talk so much about in So your explanation then was that 72° is the one that minimizes the number of fields that are against the wall for any given cell uh no what I meant to say two weeks ago is the same as now namely that the the composition of all the fields along the X wall and the Y wall is uh minimally correlated at s and a half degrees okay so I so I've put my own interpretation right there which is yeah that has not changed so so so let's say you've got a field against the wall at one end then 7 and2 de minimizes the chance that so if you imagine that the walls are kind of repelling the fields then the whole system is going to be most comfortable at is that another possible yeah yeah I mean um I I think it's a very interesting question how does this arise so is there some mechanism in the system that sort of some repulsive mechanism that gets it away from the walls perhaps the Border cells are involved in this because they fire along the walls so the walls are present in the network somehow but how this happens it's still completely open I think yeah so the last piece of data the the cell was two sort of grid Maps yeah is that um is that is that actually what happens with all cells or is that a funny cell was a funny animal or is a funny environment no certainly funny depends on how you define it but it's a normal environment the only difference is that it's very large do you think this environment will cause this to happen in any more than other environments because some ambiguity in the shoes or something or yeah because we have seen it many times but I haven't really been able to explain it so in norval environments particularly when you put the rat into an environment for the first times in uh quite often the middle part of the open field is messy and doesn't really conform to the perfect grid so I think this is often but not always resolved so in this case I first thought this is just an early stage but actually this rat has been trained for months so it can be stable State as well how big was this 220 by 220 yeah so again on the 7 and a half um so I have two questions one so you you suggest that this this maximize the difference and the activity on the two walls but my first question is why do you need this one wall has a q card the one other doesn't so in principle there is a difference of what's sh out for this and the other is so some of the grids this is of course for grids that are perfect you know 60° but some are elongated and then you'll have a difference that depends on the electicity You' predict that there will be some systematic dependence between the electicity of the grid and the angle so do you see this yeah so to the first question first whether um why should the rat or the brain bother about differentiating X and Y uh the there are Behavior lots of behavior data on R trained in this CH stud is trained in rect boxes and so on which show that rats very frequently confound uh the opposing Corners so they actually mix up uh um the walls of the box I think even though in our case there is a q card the rat may not always remember to use it so I I think it is and in the real world or the rat there aren't Q codes always so I think this is a a quite good strategy for the brain to actually reduce such uh such mistakes then the second question was already forgotten what was electricity relation electricity sure electricity certainly matters so at this stage we haven't considered it but I'm sure that is an additional factor that may help help differentiate but and generate clear predictions what would be the relation betweenity and that comes that is the next stage but we haven't started those analysis yet but it's on the list okay who was next next um it seems like cells are doing some sort of symmetry breaking between the two walls and for a square environment it makes sense that you have to shift and then that happens um in a circle environment you won't have that symetry breaking in angle space does that discreetness come in Translation in other words if you um if you sh if you shift look at the phase of the grid cells would they separate no so with within a module the grids uh orientations uh they are the same they still consistent but even in a circular environment like this uh it's they have still a q card as a first thing the other thing is that in an environment like this the rats also were they were all tested also in square environments in the same room so the Q card may actually have been associated with whatever is around so that they actually um I think um the ideal condition where they start out and always only are in uh a circle environment we still haven't tested so as I said this is much more scattered but it's not uniform I guess what my question was what if you do this in the the XY plane um with the phase of the the XY phase of the GD cells separate just like the angle separated in a square environment I guess all I'm asking you how the symetry breaking happens in a circular environment whether the XY uh positions will separate no I don't think so okay but again this is not really the perfect circle okay yeah all right now I I don't I've lost the order who was yes so um you showed us in the square in the Square um environment these um alignments of the orientation of the grid with the actual access of the environment if going back to n's question if you did the similar plot with the eccentricity would it align with that uh well that that again I don't know but something that's on the list for being done yeah all right was yes and then wondering maybe the the the 7 and 1/2 de is not due to any um smart process that serves a purpose but simply just because of the inhibition like they they dislike each other so much that in the same way that you can generate the greets in the first place you dislike them to have orientations that are that are that are similar and then in that case I think um then then you'd expect that for instance if you look at different modules that have different orientations then um the the the the 7 and 1/ 12° come overwhelming you which means main modules that that that that have similar phases similar sorry similar um similar scal mhm have you have you looked how this 7 and 1 12° yeah so you can it's it's a bit difficult to see but typically those 7 and half if you look at different modules so one might for example be on this side here and another one might be on on that side and uh then in some experiments you have um both walls and then one module May link to the Y wall and one to the X wall and therefore you get 30° offices but if you have you have two types of grid uh offset between modules it's either plus or minus 72° or it's 30° and the rest almost doesn't exist yeah okay then it was t y yeah I think it's kind of a related question which is just that whether you've looked at the uh angular relationship between modules of different scale because the logic that you're L here to to sort of reason why uh this rotation against the reference frame of the environment might be good because it help can disintegrate could also be used uh if if you define the reference frame of a small grid with respect to a large grid then rotating those against one another depending on what ratio of our scales is could also give you a similar increase in coding capacity or desending so in other words you know if you have two different grid modules fixing them at exactly the same angle with respect or exactly 30 or something for exactly the same reason that you're saying 0° offset is bad with respect to the environment it might also be bad for one module with respect to another if your goal is to is to maximally disintegrate yeah so it depends on the scale relationship of uh the of the modules too so we have actually plotted that too so uh what it shows is that the the uh the maximal dis igation or the minimum correlation you get more or less around uh 72° uh for all scales is sort of fluctuating around line that is quite close to 7 half so you've looked at the you've looked at the at the dis uration or the or the information or whatever as a function of the best angle as a function of scale of scale ratio and it kind of goes it wobbles around 7 and A2 more or less yeah up to a certain point uh because um because then you can't estimate the orientation any longer of course but it it is related to these M patterns that you have been working on because uh what you really want is that the combined activity across scales is different along the two axises right so there may be some and I I keep asking this question some form if you can see some clear relationship between the the scale ratio and the orientation difference that sort of makes sense in terms of maximizing yeah no I I think I think that's important at the same time of course we have also checked whether there is an optimal scale within the box and and there we don't have anything really clear yeah okay since your your grid pattern has a triangular symmetry going on if you tried putting the rat into a triangular room see what happens yeah we have we are currently testing animals in in uh in equilateral triangles um to see because you could imagine for a perfect grid it wouldn't really matter very much um it wouldn't help to desend which we have 72° offset along the three walls so it wouldn't be different as long as the the grid has the same shape as with the walls yeah but so but we don't have clear results on it yet so it's still early days yeah so some amount of those thing that had was looking for maybe you could see hints I don't know I can see perhaps so if you look at those Maps and along the x- axis then then you you see those stripes which are going at an angle rather than just two distributions you mean here in the yeah right there yeah right there yeah so those at the short distance they're not just separated from 0° and forming two bumps but they're going at an angle which doesn't go through the origin along the Cardinal axis you mean here just slightly inward yeah there and even the previous bump closer to the origin yes so these are plus andus 7 and A2 yes but they are not just bombs they seem to form some kind of a oriented thing which seems to say that it could be related to the angle to the distance yeah yeah sure sure absolutely but still again I mean if you plot across distance there is not too much of G some J is but but not a lot the Jitter is not systematic it's actually a Jitter I'm trying to maybe in multi-dimensional space one like okay all right very good so let's thank the speaker again [Applause]
Up Next

52:00
How the Brain Creates Multiple Models of Reality | Inner Cosmos
@InnerCosmosPod
12.3K views•2024-10-01
21:55
Deciphering Neural Circuits Controlling Anorexia in Mice | Richard Palmiter
@AllenInstitute
2.3K views•2011-10-10

4:10
Vagus Nerve (CN X): Anatomy, Nuclei & Functions Explained
@Alilamedicalmedia
305.2K views•2022-10-31

13:03
How Exercise Benefits Your Brain: Science Explained
@TED
11.4M views•2018-03-21
Related Study Plans & Knowledge Roadmaps
Structured learning paths in Neuroscience
neuroscience
Appetite Regulation: Brain Circuits & Hormones
01Foundations of Endocrinology and Brain Anatomy
02Introduction to Energy Homeostasis
03Peripheral Signals: Leptin, Ghrelin, and Insulin
+ 2 more learning modules
14h5 modules
Explore Roadmap
neuroscience
Neuroeconomics: Value, Risk & Brain Mechanisms
01Foundations of Neuroscience and Brain Anatomy
02Introduction to Neuroeconomics and Subjective Value
03Dopaminergic Prediction Errors & Reinforcement Learning
+ 3 more learning modules
18h6 modules
Explore Roadmap
neuroscience
Spatial Navigation: Cells, Grids & Brain Maps
01Foundations of Brain Anatomy and Memory
02Place Cells and Head-Direction Cells
03Grid Cells: The Brain's Coordinate System
+ 2 more learning modules
12h5 modules
Explore Roadmap
neuroscience
BCIs: Neural Decoding & Prosthetic Control
01Neuroscience Foundations: How the Brain Signals Intent
02Signal Acquisition: Recording the Brain's Activity
03Neural Decoding: Translating Brain Waves into Data
+ 2 more learning modules
25h5 modules
Explore Roadmap