

![B1.6 Blackbodies plus Wien's and Stefan Boltzmann's law [IB Physics SL/HL]](https://i.ytimg.com/vi_webp/yL4uBhZocRE/maxresdefault.webp)






![E5.3 Evolution of stars [IB Physics SL/HL]](https://i.ytimg.com/vi_webp/jt7NXN4jGvo/maxresdefault.webp)


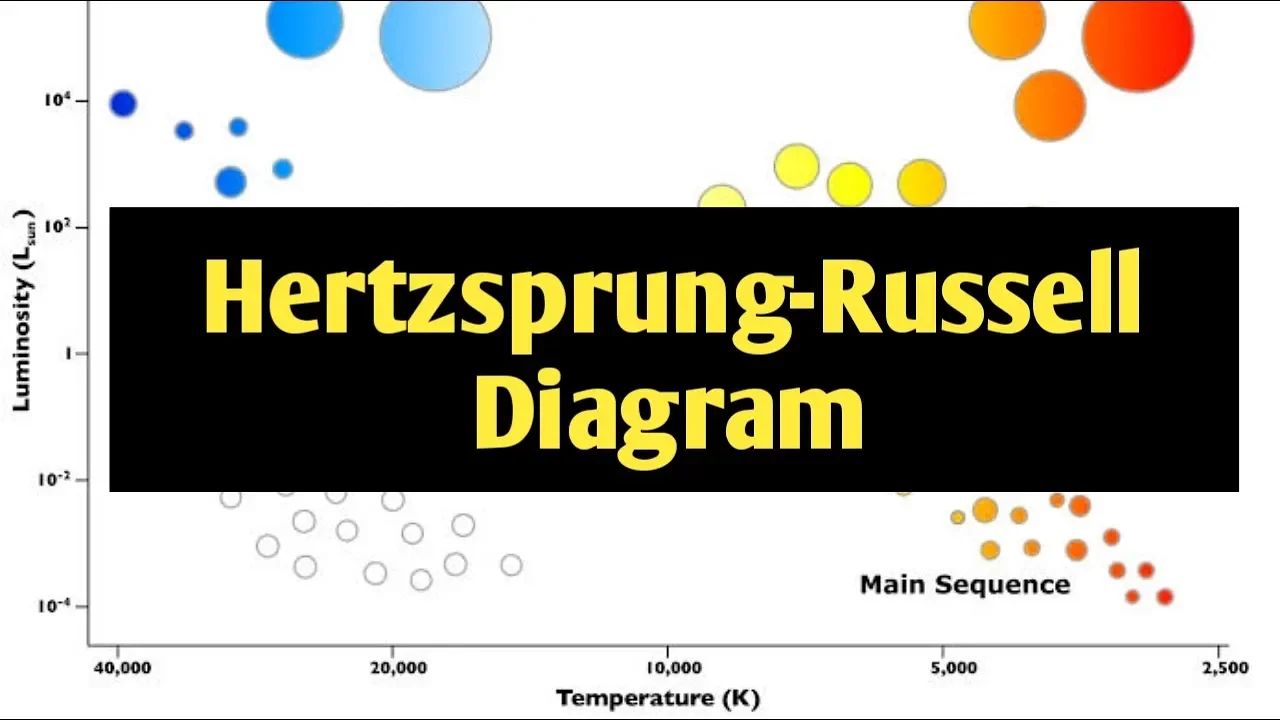











The Hertzsprung-Russell (H-R) Diagram is a fundamental astronomical tool that plots stars based on their luminosity (brightness) and color (which indicates surface temperature), revealing that most stars follow a diagonal 'main sequence' where brighter stars are bluer and hotter, while dimmer stars are redder and cooler; this diagram reveals stellar evolution by showing how stars change position as they age, with a star's initial position determined by its mass.
Decoding the Hertzsprung-Russell Diagram: Stellar Evolution & Temperature
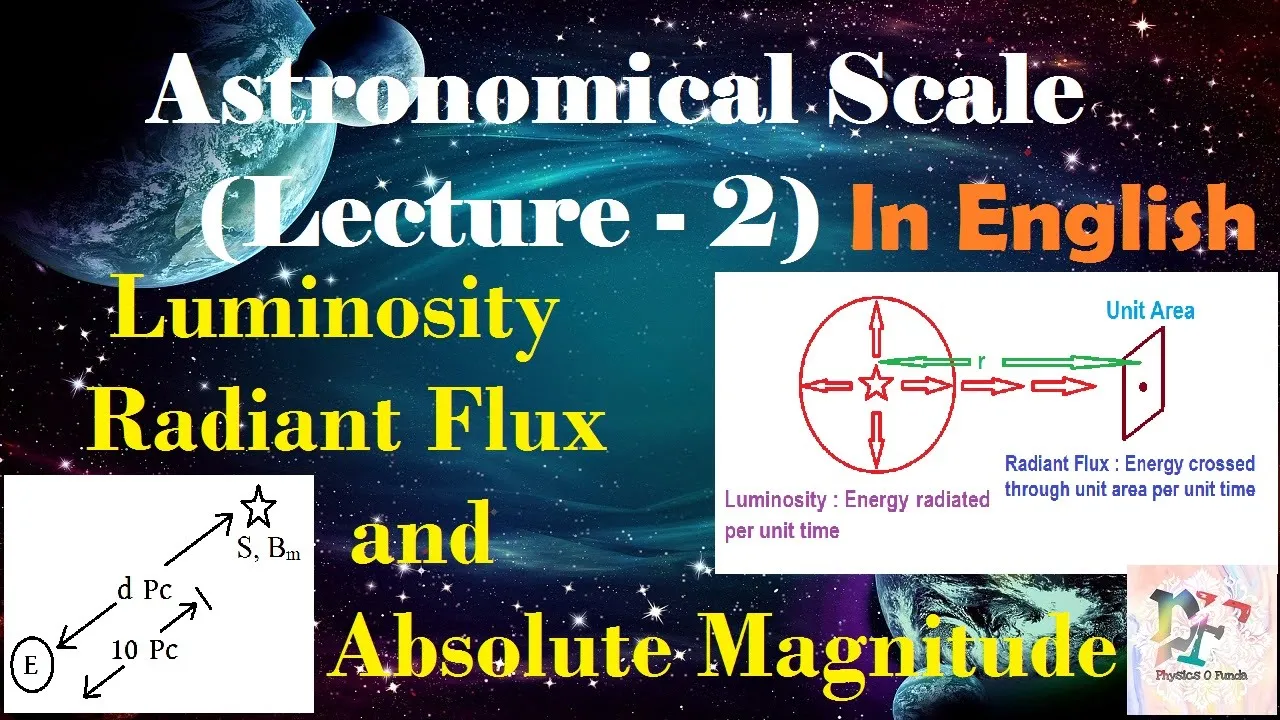
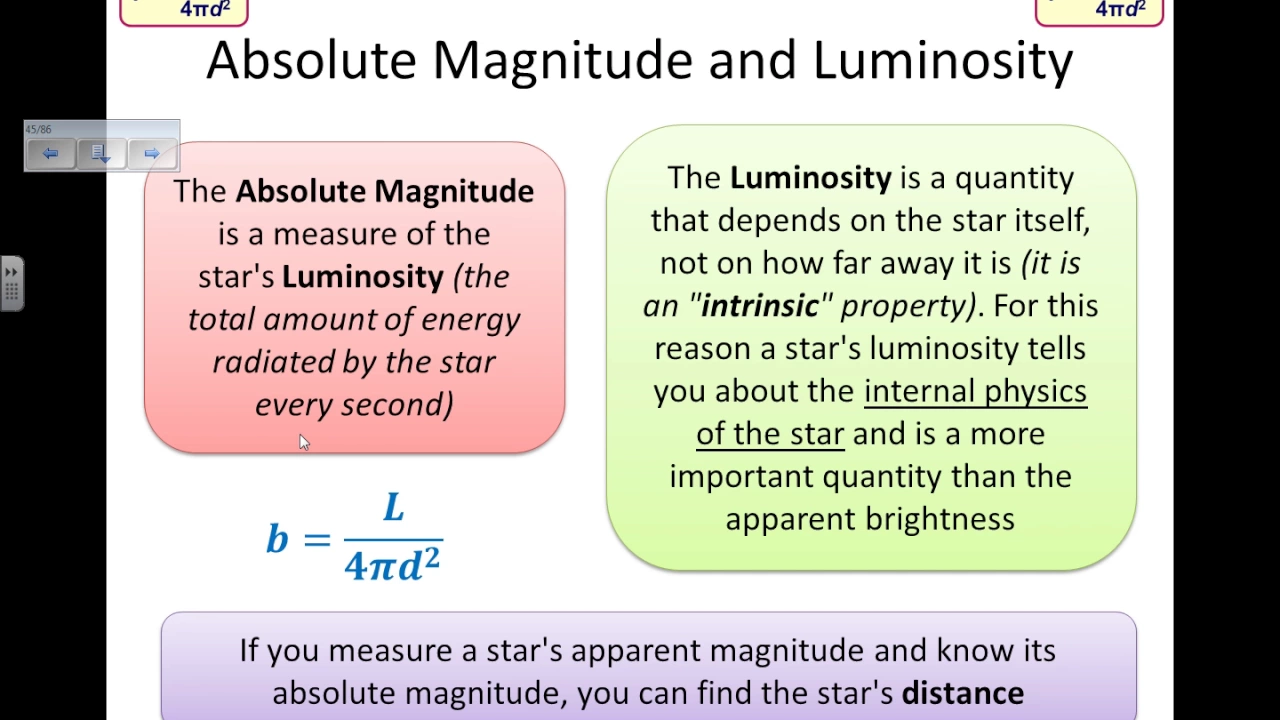
Added:Understanding the difference between a star's apparent brightness and its intrinsic luminosity (absolute magnitude).
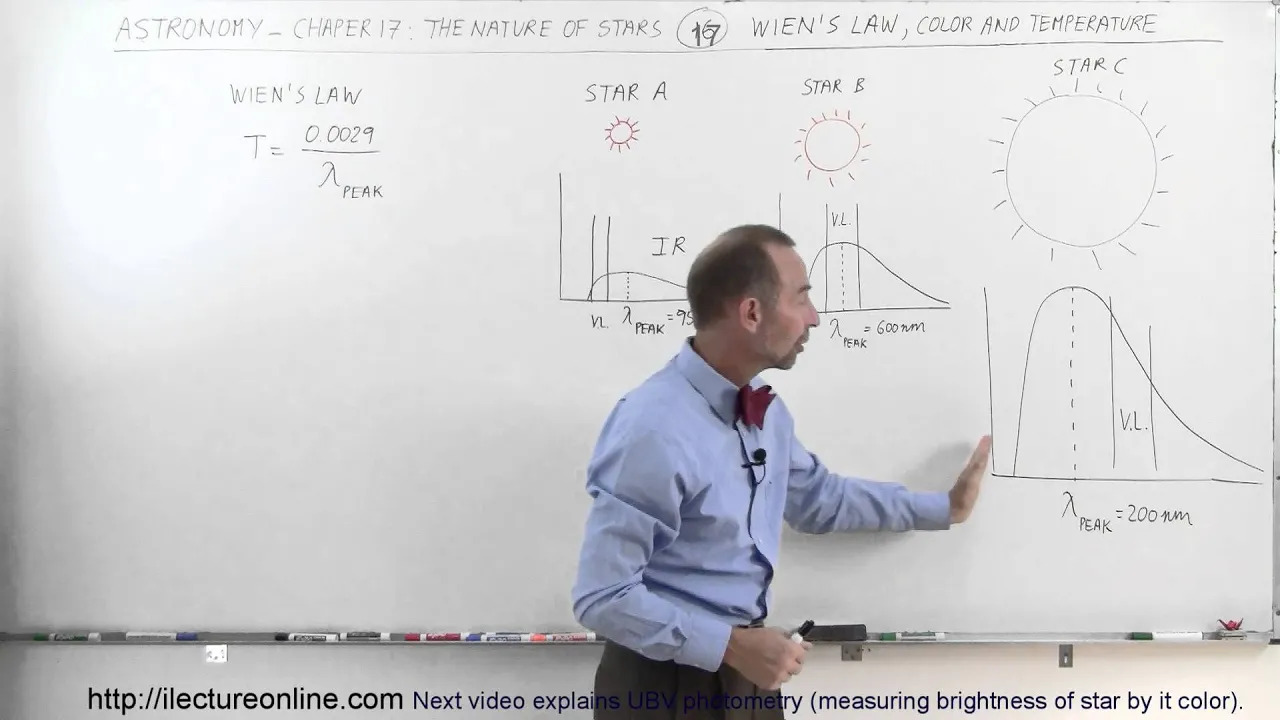
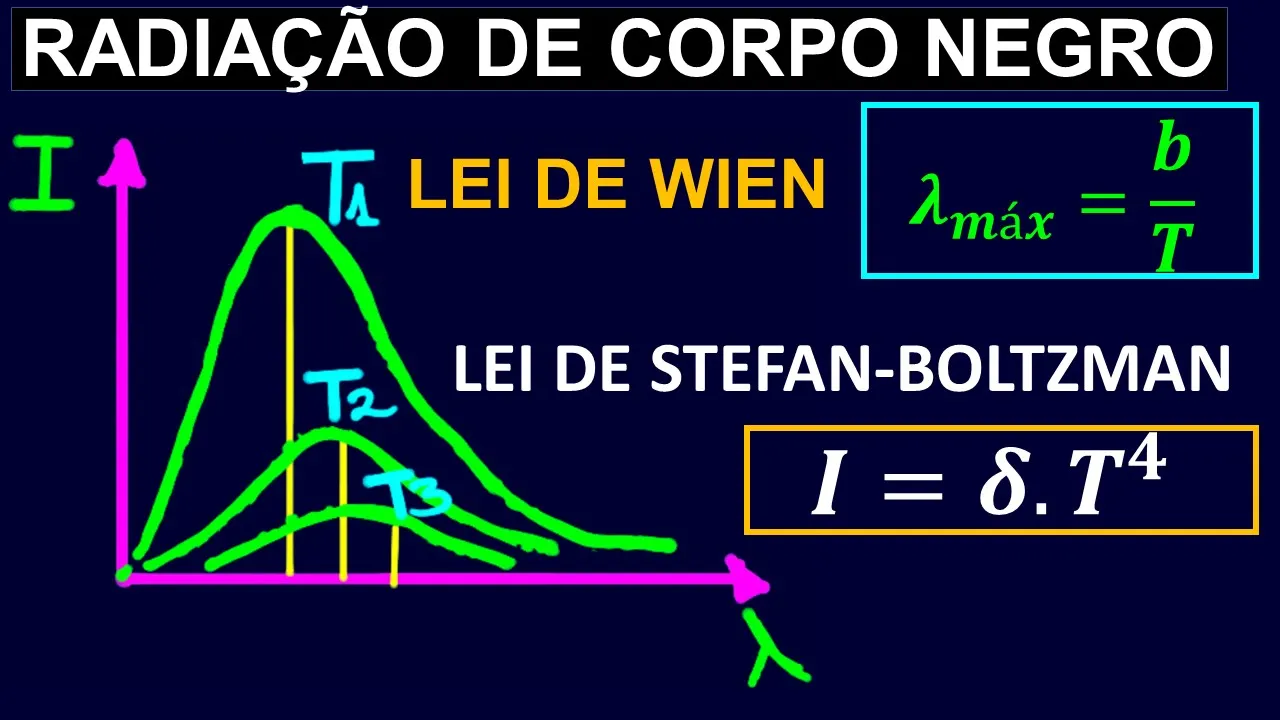
The physical relationship between a star's color and its surface temperature, rooted in blackbody radiation and Wien's Law.
The basic concept of nuclear fusion, specifically how hydrogen fuses into helium in stellar cores to generate energy.
An introductory grasp of hydrostatic equilibrium, representing the balance between gravity and outward radiation pressure in a star.
Analyzing specific stellar evolutionary tracks on the H-R diagram for both low-mass stars (like our Sun) and high-mass stars.
Exploring stellar nucleosynthesis, studying how heavier elements are formed during advanced stages of stellar evolution.
Investigating the endpoints of stellar life, including white dwarfs, neutron stars, pulsars, and black holes.
Applying H-R diagram analysis to star clusters to determine their age and distance using the 'main sequence turnoff' method.
2.5M views123.1Klikes2:42Original Release: 2025-09-25
Dude, take a look at this picture of stars. Okay. Are there any differences between them that you can make out?
Well, they have different colors, right?
Anything else? Some are brighter than others? Yes. Color and brightness are really the only differences that we can distinguish between stars just by looking up at them. Because even though stars vary greatly in their actual size, from here on Earth, they all just look like points of light. Right now, importantly, how bright a star appears to us depends on two things. how far away it is and how much light it's actually giving off, what we call its luminosity, which is something we can easily calculate once we know the stars distance. Okay, so here's what I'm getting at. What if, just for fun, we organized stars based on these two simple properties, luminosity and color.
We observed tons of stars and put them on a graph, placing the bluest stars towards the left, the reddest stars towards the right, the most luminous stars up top, and the dimmest towards the bottom. And voila, voila. What we just created here, my friend, happens to be the most important diagram in all of astronomy, the legendary HR diagram. At a glance, this thing tells you everything you need to know about any star in the universe. In what way? Well, what you might have noticed is that stars don't just have any random combination of luminosity and color, but rather when organized based on those two properties, they fall into very distinct groups. the vast majority of them fall on this roughly diagonal line telling us that in general the brighter a star is, the bluer it is. And the opposite, the dimmer the star, the more red. Now, as it turns out, a star's color is directly related to its surface temperature. And this might be counterintuitive, but the bluer a star is, the hotter it is, and the redder the cooler. H. So, in most cases, hotter equals brighter and cooler equals dimmer. But interestingly, some cool stars are insanely bright and and some hot stars are really, really dim.
So, what's the deal? Yeah, what is the deal? Well, perhaps the most profound thing that this diagram reveals to us is stellar evolution. It tells us how stars grow up, get old, and die. How? Well, it goes like this. When a star is born, how massive it is will determine where it initially takes its place on this diagram. And as the star ages, its position will slowly
Up Next
12:44
What Stars Are Made Of: Cecilia Payne's Discovery
@pbsspacetime
325.3K views•2020-09-01
61:17
First Billion Years of the Universe with the Square Kilometre Array
@iaaudc
121 views•2022-05-26

6:25
Kepler's Laws of Planetary Motion Explained (Educational Astronomy Video)
@Peekaboo_Kidz
404.9K views•2023-02-17

6:10
Gamma-Ray Bursts: Cosmic Snipers Explained | Astronomy
@kurzgesagt
15M views•2016-07-31
Related Study Plans & Knowledge Roadmaps
Structured learning paths in Astronomy
astronomy
Reionization: Pop III Stars, IGM & 21cm Line
01Foundations of Cosmology & the Early Universe
02Population III Stars & Cosmic Dawn
03Physical Mechanisms of Reionization
+ 2 more learning modules
17h5 modules
Explore Roadmap
astronomy
Planetary Rings: Dynamics, Roche & Resonances
01Foundations of Gravity and Orbital Mechanics
02Tidal Forces and the Roche Limit
03Structure, Composition, and Collisions
+ 2 more learning modules
10h5 modules
Explore Roadmap
astronomy
Asteroseismology: Stellar Waves, Ages & Cores
01Foundations of Stellar Astrophysics & Wave Mechanics
02Stellar Oscillation Modes: P-modes and G-modes
03Mathematical Framework of Asteroseismology
+ 2 more learning modules
35h5 modules
Explore Roadmap
astronomy
Adaptive Optics: Physics, Engineering & Control
01Foundations of Wave Optics and Wavefronts
02Atmospheric Turbulence & Optical Distortion
03Wavefront Sensing Technologies
+ 3 more learning modules
35h6 modules
Explore Roadmap