


![A Small, Cheap Micro-Spectrometer - Review [Pt 1]](https://i.ytimg.com/vi/MOXryggwr_Q/maxresdefault.jpg)











![[중등인강/중2 과학] 불꽃 반응실험 : 원소를 확인하는 방법 - 수박씨닷컴 안현정 선생님](https://i.ytimg.com/vi/G8dQVSyhHLg/maxresdefault.jpg)




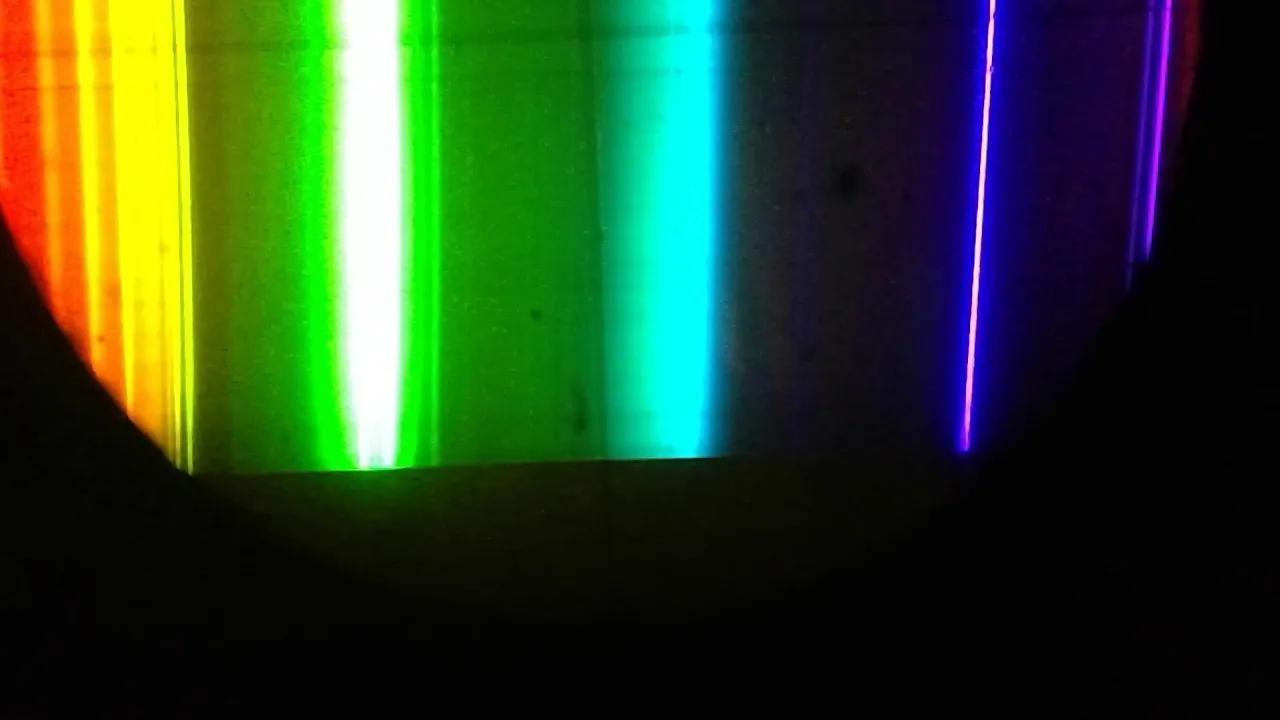
A DIY cardboard spectrometer can be calibrated by using the characteristic emission peaks of a compact fluorescent lamp (CFL) as reference points; the mercury emission lines at 436 nm (blue) and 546 nm (green), along with terbium at 489 nm and europium at 611 nm, serve as stable calibration markers because these atomic emission lines are consistent across all CFLs and never change, allowing users to adjust the software scale to match these known wavelengths and establish accurate wavelength measurements for subsequent spectral analysis.
DIY Spectrometer Calibration: Emission Peak Analysis and Setup
Added:Basic wave optics, specifically how diffraction gratings or prisms disperse light into its constituent wavelengths.
The concept of atomic emission spectra, particularly how mercury vapor in fluorescent lamps produces distinct, known emission lines.
The basic anatomy and working principle of a spectrometer (slit, dispersing element, and detector/sensor).
The mathematical concept of calibration, specifically mapping pixel positions on a digital sensor to physical wavelengths (nanometers).
Applying the calibrated spectrometer to perform quantitative absorption spectroscopy using the Beer-Lambert Law.
Implementing non-linear calibration models (such as polynomial regression) to correct for optical distortions across the entire spectral range.
Analyzing unknown light sources, such as LEDs, lasers, or chemical flame tests, to identify elemental composition.
Upgrading the DIY hardware to improve optical resolution, reduce stray light, and integrate automated data acquisition software.
7.1K views117likes16:29Original Release: 2018-02-13
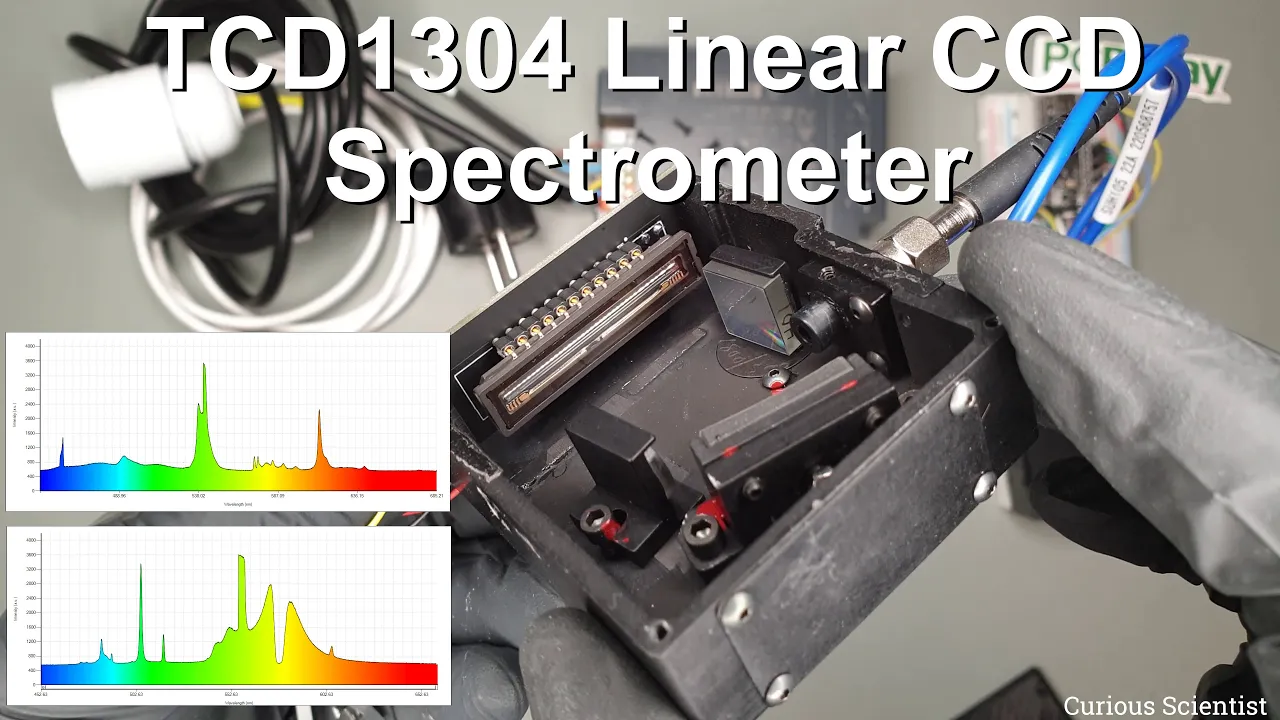
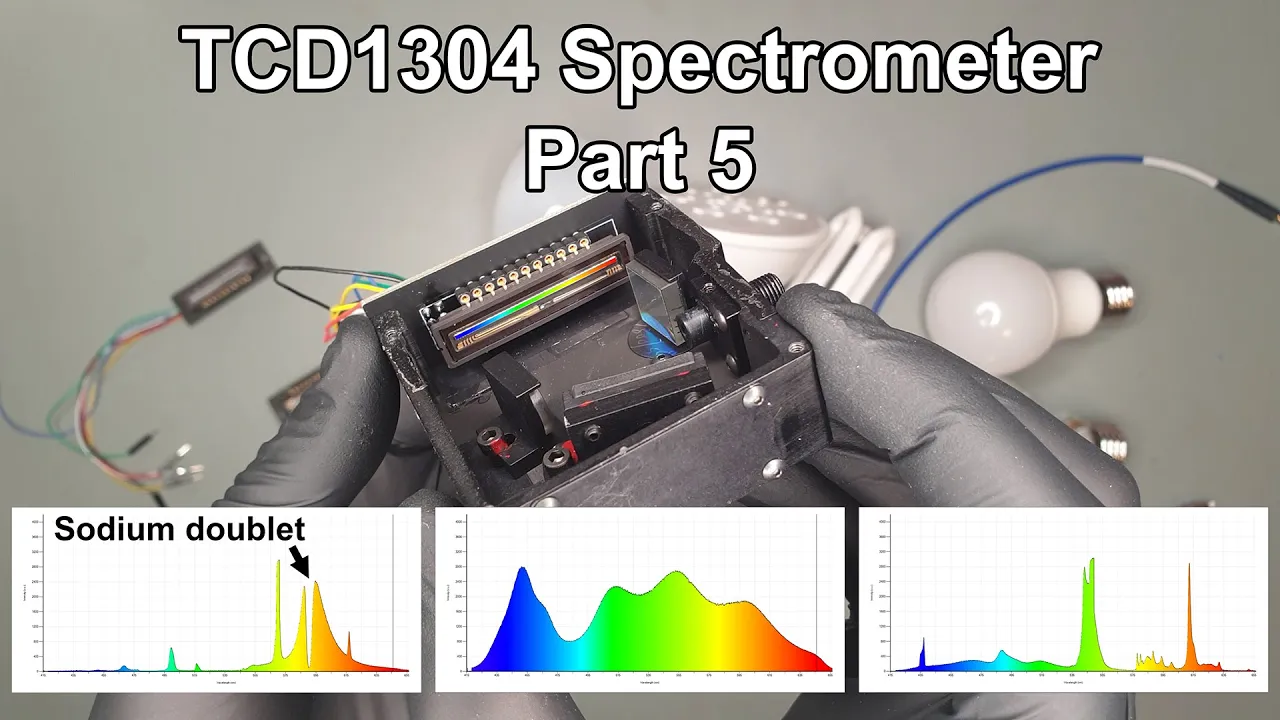
all right so I went ahead and covered the entire outside with grill tape to give it some extra strength durability and to try to block out any light leaks you can see I added a little extra scarred here on the side of the lid so that blocks that edge and I'm gonna probably have to do the same thing all along here add a little top here as a handle and yeah just looking through it down here myself already looks really dark the only light that comes in is obviously through here and it's very directional because there's that lip and so one kind of easy solution that you can do without having to go through all this trouble is you can get a black cloth and whenever you're doing your measurements you just drape that over the body to block out any stray light okay so now to mount the diffraction grating and the camera inside of our enclosure you can definitely mount it like this I think for me if we take a look here it's gonna be a bit low see yeah I mean it would work but it'd be better if it was raised up about I don't know half centimeter two centimeter and we can easily do that by making a little stand out of pieces of cardboard or something else but just for the prototype to kind of test things out I'm going to go ahead and use the original casing it came in to help me out and what I'm going to do is go ahead and just put it in just using these two cylindrical pieces and having the round side of the board here you you get the case that has the ridges in there and normally it sits in here but I'm going to move it all the way close to centers I possibly can so that the lip here is now above the camera and then the top now we just need to put back the screws okay so there's the camera inside of this housing I went ahead and trimmed the diffraction grating first of all the two by two size originally came in would have been a bit too large for my cardboard box and this way since there's a flat edge here for the initial stages at least I can line them up just tape on the diffraction grating and that way I'll have something to rest on all right so let's give it a shot I got the compact fluorescent light bulb in the fixture here let's try it without any slit so basically in the you know a centimeter wide slit I'm going to open up the therom you know software there it is here you can select which camera you want to use so I'm using just the USB plug in one here you can see the actual image that the camera inside the spectrometer is recording so clearly we're again diffraction and because of that wide slit we're getting these large chunky bands here and we can move the spectroscope around kind of did get different reflections I don't know if you can see that but these white bands here are reflections off of the inside of the box so there's probably some light leaks or we could have gotten for a better surface on the inside gone for a matte black I didn't I didn't do that I just used some regular black paint but also we can change some of the video components here so we have brightness contrast backlight saturation hue sharpening of some sort so we could reduce that down to get rid of that back reflection play around all sorts of parameters and basically what we're looking for is the CFL pattern like you see down here on the theremin aside so there's some characteristic Peaks that all fluorescent bulbs have and we are trying to find those but you can see right now is just very broad and no matter what we do really here or how we position the spectrometer it's not going to change that what we need to do is change the slits so let's go for the narrow one that's about I don't know three to four millimeters gonna put that in okay and you can probably see an almost immediate change there though we now got some much better defined slits let me just reset that okay yeah that looks a lot better already okay but you could guys can probably tell that there's something wrong with this picture here the red is on the left the blue is on the right Wow that's not how it should be so we got this flip box here that we can click now it's correct where the blue is corresponding to these low wavelength intensities and the raddest correspond to these just higher wavelength intensities and suddenly you can see we've got somewhat more well-defined peak structure here it's still nowhere near sharp as this comparison to look in here at the bottom but you know it's kind of getting there again and these white reflections they are gonna count towards the light just the same as the other ones you can see this huge hump here at the end that's not UV from the lamp that's just artifact in an erroneous component okay so we already getting there let's also reduce the size of our box here yeah keyboards not coming up automatically for some reason so I'm gonna go to 15 and if I go really small to like five you can see we've got this really narrow band so I can really select a good part I want to measure but I don't want to go that narrow try fifteen but now we need to obviously move it up so let's increase this value all right so you know that's not great but hey it's a quantitative results and we can take a look here and try to match this pattern since we got some peaks here to the known compact flourescent pattern and this is in fact how you calibrate this instrument you use the known emission peaks from a fluorescent bulb and since those emission Peaks are based on the emission of chemical elements they're never going to change the different CFLs spectra can be different you can see they've got a couple different ones where this one has this four ninety peak and it kind of changes with different IR emissions and he has they have them identified here and you can also look on the Wikipedia for a compact fluorescent bulb to see what these different Peaks belong to okay so we have a button here that's trim scale so if we hit that the two characteristic Peaks have conveniently been highlighted here for us in it's going to be the 546 peak here in the green and the 436 peak down here in the blue so what we do is if we grab the scale and drag it over we can adjust the position of these calibration points okay so I think the 546 should be this large peak here in the middle that kind of makes sense to me we've got a large number of Peaks here and then some more to a red so I think that's these here so the characteristic ones that we used to calibrate is going to this one so I just grabbed this axis up here and drag it to match so now you can see the 546 matches with the what the software is identifying as the maximum of this peak 545 but the 436 you can see as imagine and I pretty sure that should be this one here if we look down here the 436 here and then we have this teal peak in between that and the 546 so I think this is the teal peak that should be at 490 and this one just needs to be adjusted from this direction and you can kind of go back and forth try to get that as close as you possibly say think I'm gonna get it and still I mean it's pretty much spot-on the peaks are very broad but the basic shape the key peaks are definitely they're not going to get any better resolution by changing any of the video parameters what we need to do now is decrease the slit size even further so I'm going to take out this big one and put in the narrow one made out of razor blades let's go ahead and put that in and yeah now we can face it directly you can see you get very nice sharp lines and if you get it that your lines look like this crooked what that means is that the orientation of your slit is off relative to the camera into the diffraction grating so you can see here if I change the angle of this I can fix that or go in the opposite direction so there you go nice and straight up and down yeah look how much more resolution we're getting already this peak is starting to split up into different ones okay there you go oh man look at that that is really close if you've ever worked with even laboratory-grade spectroscopes you know how finicky they are how everything has to be absolutely perfect and the more complex you get with the optics with mirrors and focusing lenses everything just has to be perfect in fact most of the most of those setups are put on to shake tables so basically tables that are isolated from the vibration of the ground they are so sensitive that you know geologic movement can make a big difference okay so let's try to calibrate this in we can move our 5:46 over it to the left and this one just a bit over the controls here a bit strange if you grab the access or if you grab the yellow box they do kind of different things as far as stretching the whole thing or just moving it left to right you can see the automatically generated maximum point value adjusting so there we have the 436 to 436 546 to 546 perfect so now this is calibrated and from this point on we can go on and measure anything else being confident that the values that we get and the spectrum that we get corresponds to reality without this calibration that is not really possible you'll still get the characteristic peak positions but you won't really know where in the visible spectrum they actually lie this 546 could be 600 something if you don't calibrate it all right so here's what I got after some fine tuning and look at how well resolved these lines are so sharp so nice I am truly impressed by what we've been able to do here again huge shout out to their amino for making this possible I am all about open source technology especially when it comes to science and yeah look at those lines I mean can't get better than that and guess what the only thing that I changed was the focus on the camera me messing around with it in the beginning when I was unboxing it get it got it off focus so I took it out and just looking at the image that the camera produce I focused it in on an object pretty close to it and boom it's now working perfectly you can see even with a high brightness and contrast we barely get any stray light artifacts at all we got our calibration points exactly on we got the mercury at 5:46 in the sari and the mercury at 436 and then our terbium at 489 and the reference is 485 490 so spot-on there and then the europium peak we're at 6:14 and the reference from ther amino here is 611 even been able to resolve these yellow mercury and terbium Peaks so doing really well really happy with how this turned out alright guys there you go I'm really excited about spelled something so simple took me you know better part of a day to build it but it seems to be working accurately and that's just great many more things that I can fine-tune lots of stray light reflections that we can get rid of improved this material inside so we definitely cannot improve on that fix the camera and permanently figure out what exact position is gonna work best for us and yeah I really started using it to its full potential what we're doing right now is just preserving the spectra of different lights but we can actually use the light in combination with the spectrometer to analyze different materials and that's really what spectrometry is all about is probing into the chemistry of materials using light alright guys thanks for watching definitely let me know in the comments what you think about this build if you have any questions and we'll see you in the next one keep on growing
Up Next

3:10
Using NIST Atomic Spectra Database for Energy Levels
@pchem5782
505 views•2015-08-24

12:53
21cm Hyperfine Transition in Neutral Hydrogen: Radio Astronomy Basics
@AaronRobertParsons
12.4K views•2011-10-13

32:32
NMR Spin Physics I: Zeeman Effect, Resonance Condition & Larmor Frequency
@nptel-indianinstituteofsci8064
2.3K views•2024-01-17

27:14
Entropy and the Second Law of Thermodynamics Explained
@veritasium
27.5M views•2023-07-01
Related Study Plans & Knowledge Roadmaps
Structured learning paths in Physics
physics
Nuclear Physics (Decay, Fission & Reactors)
01Atomic Structure and the Binding Force
02Radioactive Decay and Half-Life
03Nuclear Fission Mechanics and Chain Reactions
+ 2 more learning modules
12h5 modules
Explore Roadmap
physics
Soft Matter (Polymers, Colloids & Rheology)
01Foundations of Soft Matter & Thermal Forces
02Polymer Physics and Macromolecules
03Colloids, Surfactants, and Self-Assembly
+ 2 more learning modules
38h5 modules
Explore Roadmap
physics
Analytical Mechanics: Lagrangian & Hamiltonian
01Mathematical Foundations: Calculus of Variations
02From Newtonian Mechanics to Constraint Dynamics
03The Principle of Least Action & Lagrangian Mechanics
+ 3 more learning modules
28h6 modules
Explore Roadmap
physics
General Relativity (Spacetime & Cosmology)
01Foundations of Relativity: Special Relativity
02The Geometry of Spacetime: Equivalence Principle & Curvature
03Einstein's Field Equations: The Mathematics of Gravity
+ 2 more learning modules
55h5 modules
Explore Roadmap