



![[não erre mais] Modo VCV x PCV: quais são as diferenças?](https://i.ytimg.com/vi_webp/hCMd5J2Pki8/maxresdefault.webp)



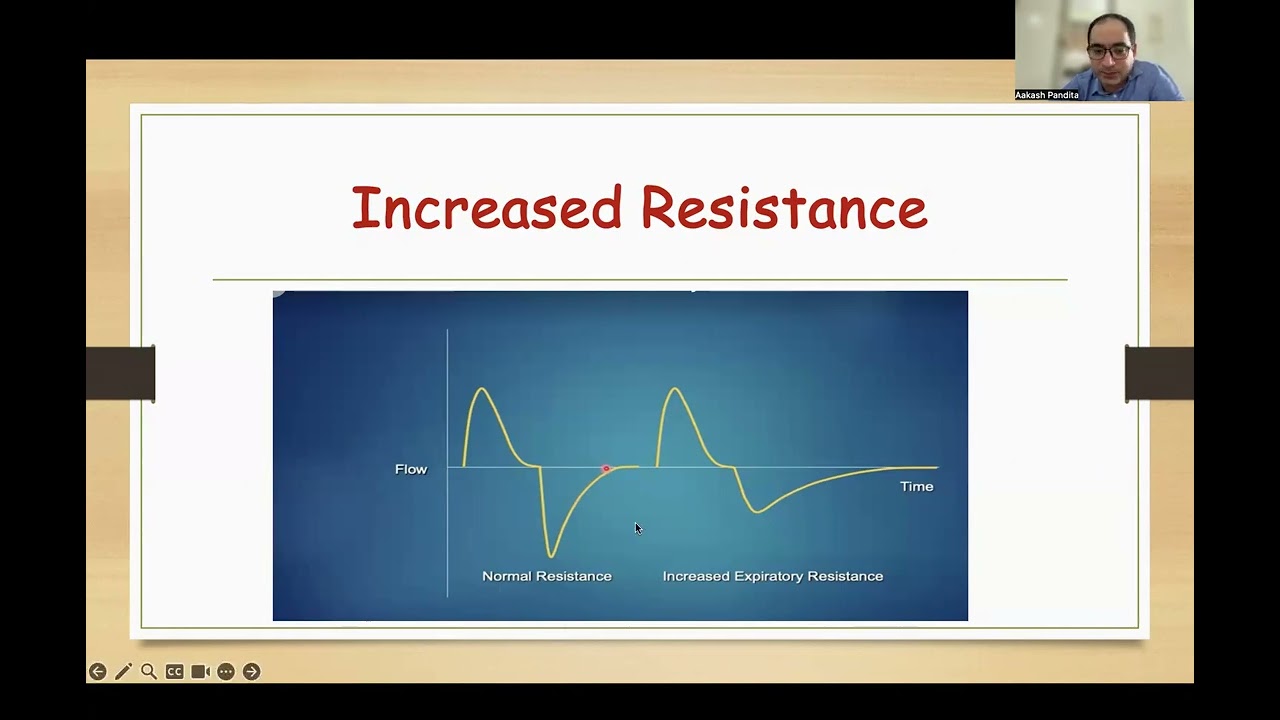

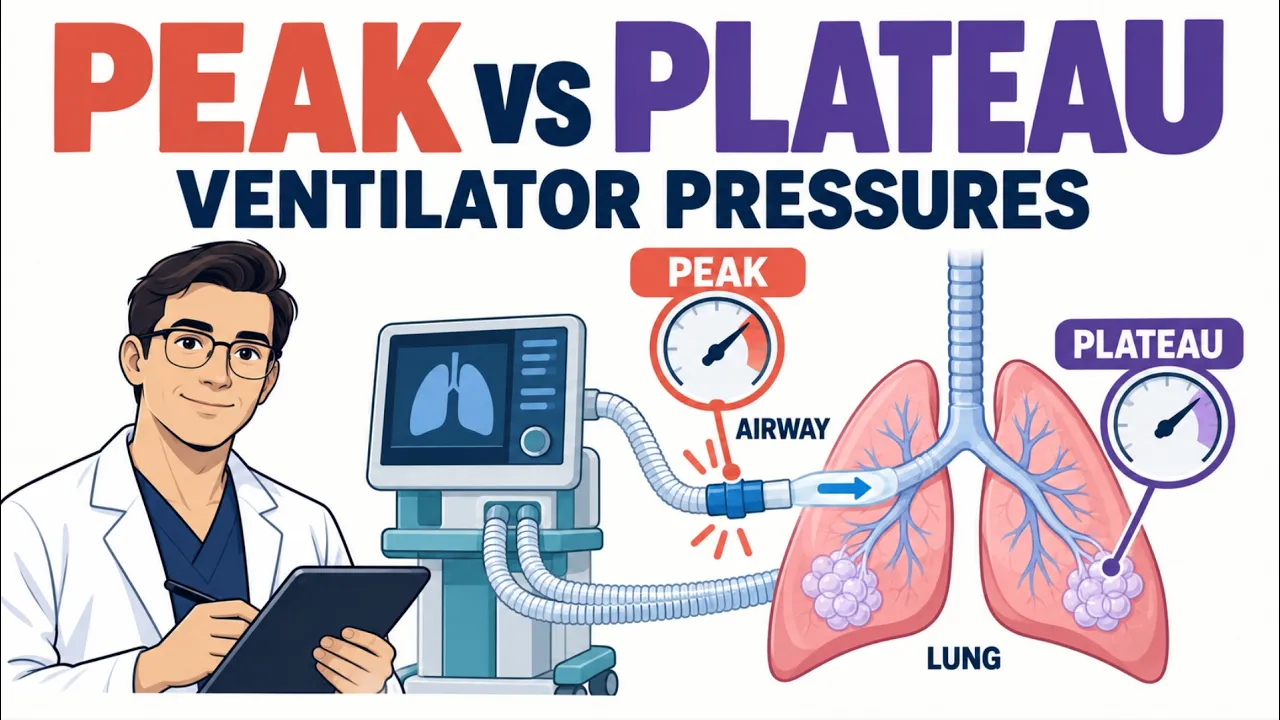
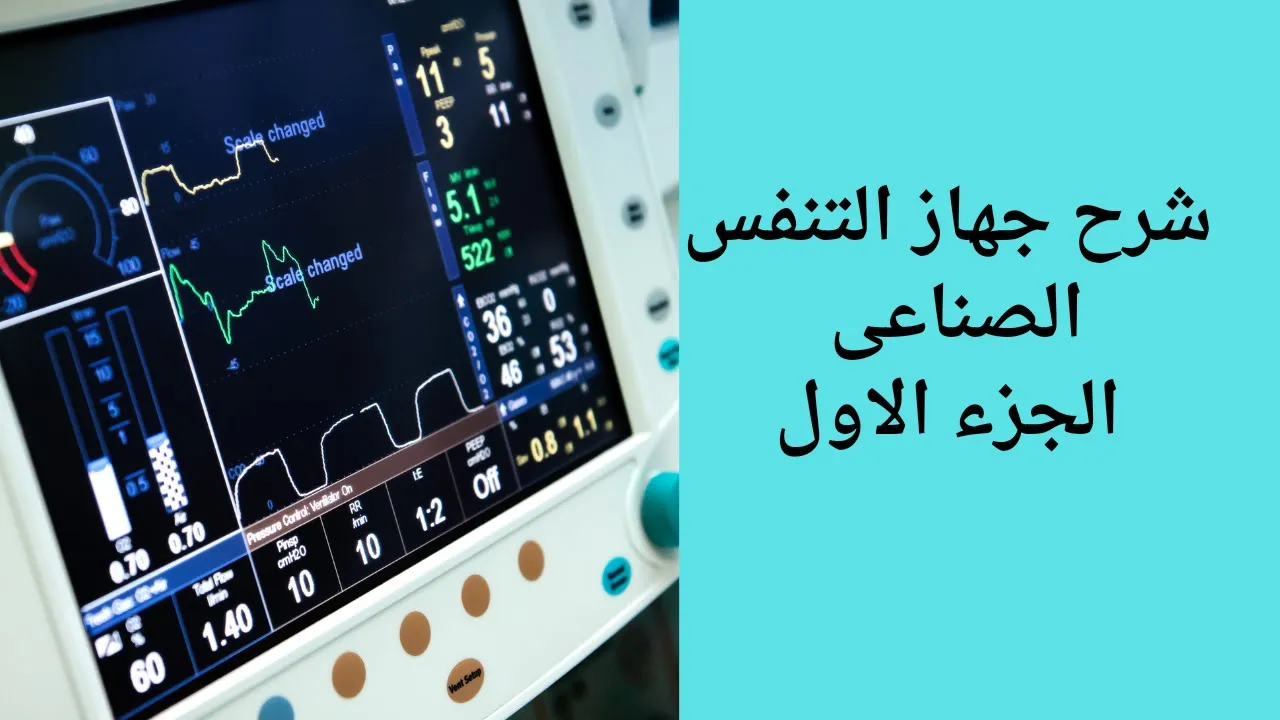




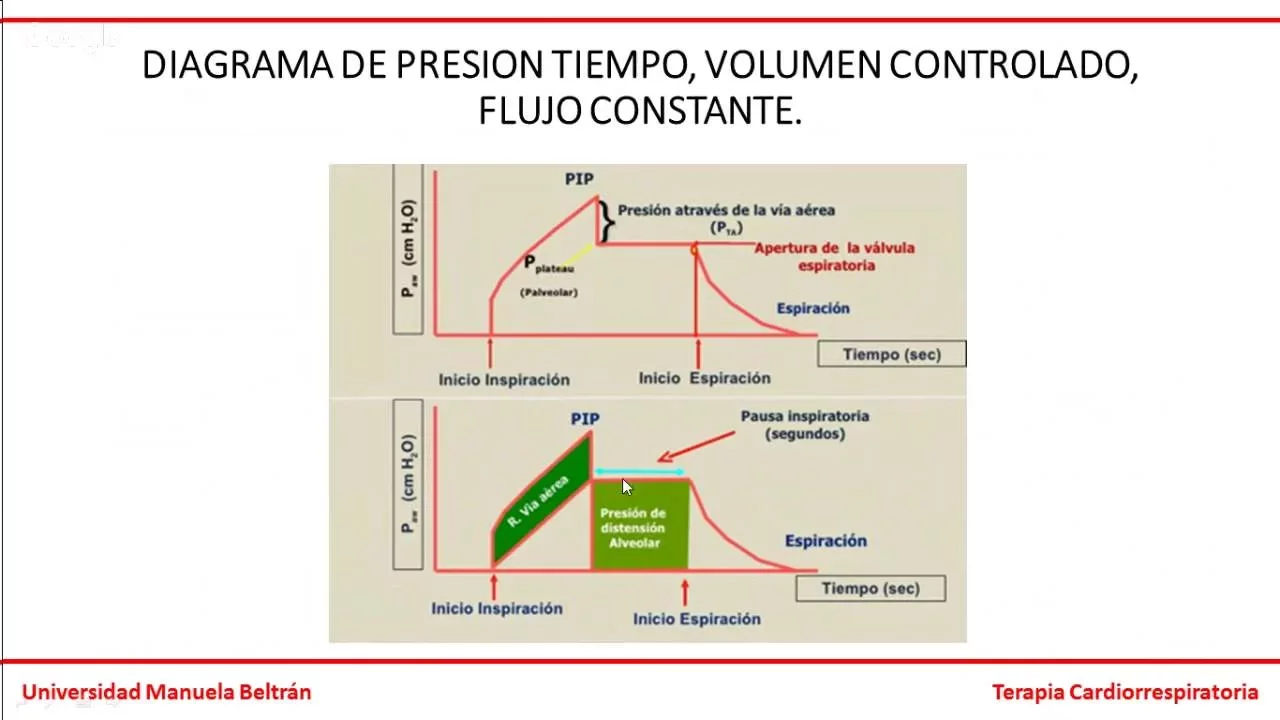



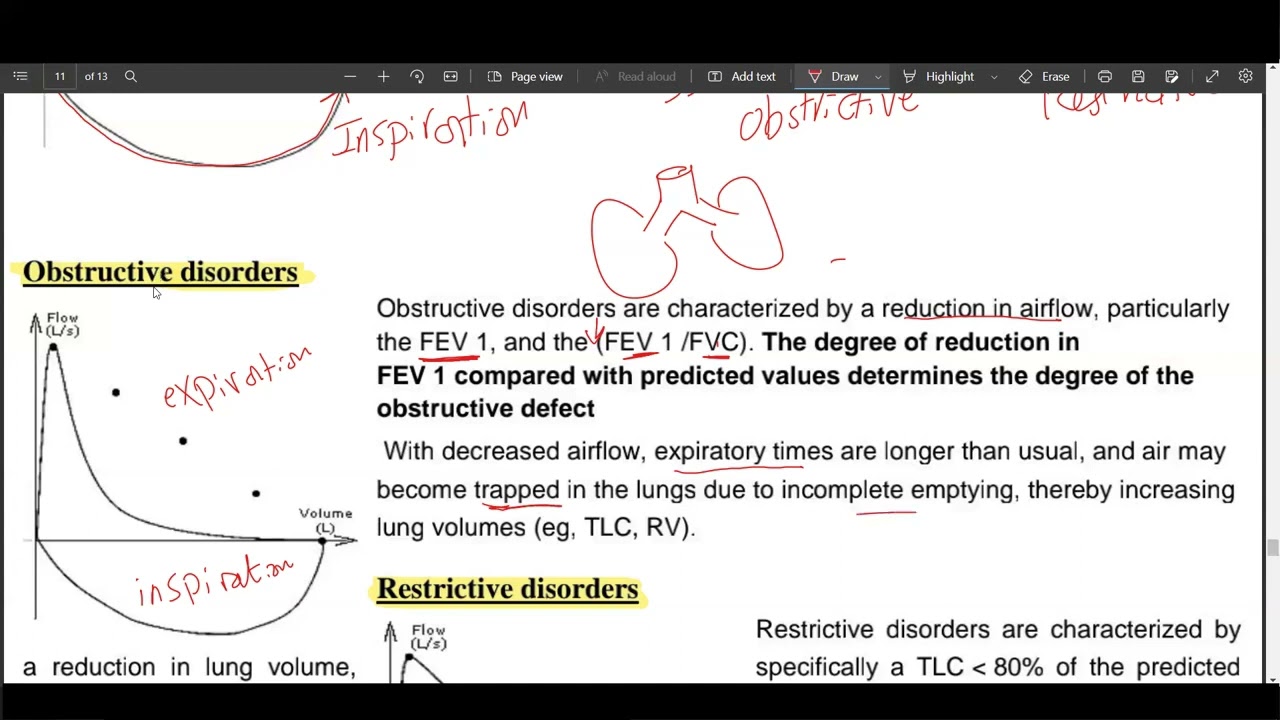

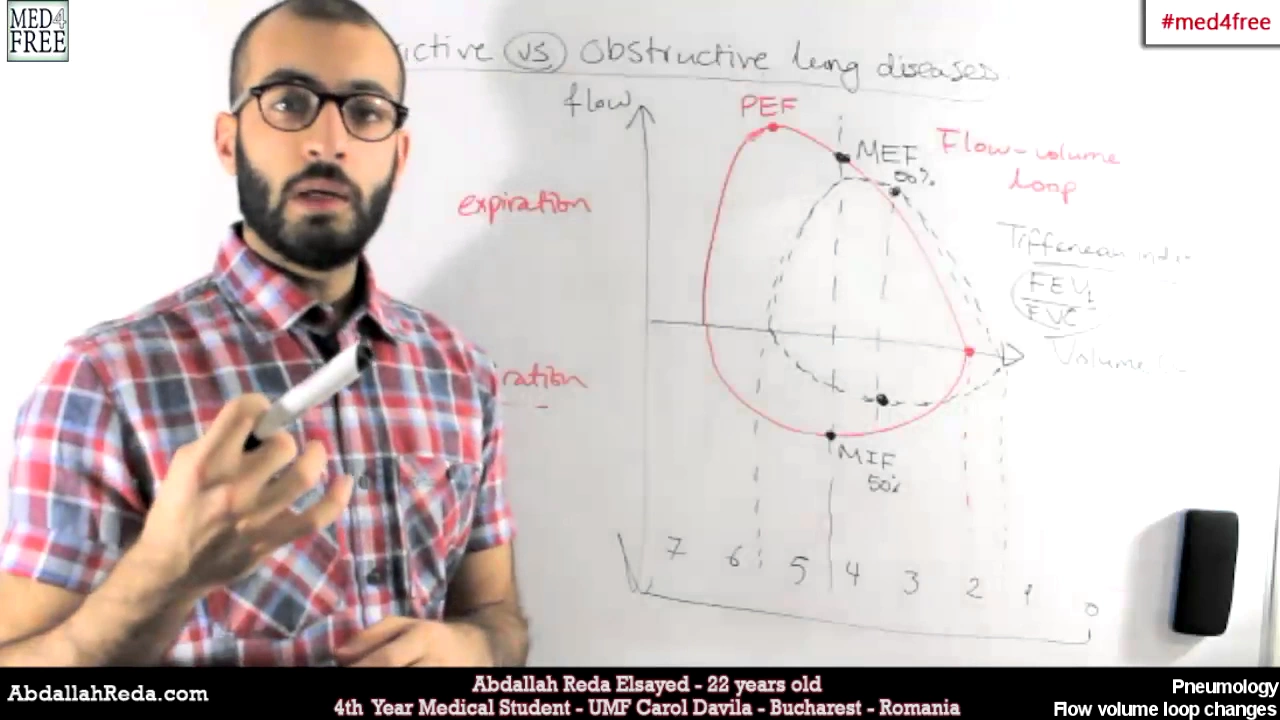





Ventilator loops (Flow-Volume and Pressure-Volume) are graphical representations that plot respiratory variables against each other rather than time, enabling clinicians to assess lung compliance, detect airway resistance, identify leaks, and evaluate patient-ventilator synchrony. In spontaneously breathing patients, loops appear clockwise, while in mechanically controlled ventilation, they appear counter-clockwise. The Pressure-Volume Loop shows PEEP as the baseline pressure, with the lower inflection point indicating minimum pressure for alveolar recruitment and the upper inflection point marking the onset of alveolar over-distension. Flow-Volume Loops reveal airway resistance through flattened inspiratory curves and scooping expiratory patterns, while also identifying conditions like bronchospasm, secretions, and air leaks. These loops are essential tools for optimizing mechanical ventilation settings and improving patient outcomes.
Ventilator Loops Basics: PV & Flow-Volume Waveforms
Added:[Music] today we are going to talk about basics of Loops in mechanical ventilation we had seen the initial part the basics about initiating a mechanical ventilation and the basic physiological terminals we talked about scalars and now today we'll be talking about the loops and which are also called as plots I'll be talking about its clinical utility in more detail towards the end of the presentation so Loops or plots as we all understand that the scalars where the pressure flow and the volume scalar they are plotted against the time that is basically only one wave form but it's like a Time variable here what is happening is it's not a Time variable it's a single breath which we are seeing but basically it's an interaction which is shown between the two things now one thing the most easy way to remember is that the volume is a common feature for all the loops which are commonly used clinically so either it can be plotted against the pressure and that is what we call as a pressure volume Loop and this is what a pressure volume Loop looks like it's only positive axis most of the times if you look at the second plot or Loop that is volume flow Loop it is called as the flow volume Loop and this is how it looks like we'll be talking about both of this in a bit detail in the coming slides now another thing before we go about talking in detail is we need to be very clear that when we are talking about this plot dos or this Loops there is two different terminologies what we use commonly the spirometry the pre-anesthetic spirometry for our lung patients or something there flow or the interpretation of the graph is clockwise that is the inspiration starts and then the flow comes reaches wherever we want the tidal volume as per the patients and then the expiration ERS so if it's a spontaneous patient or spontaneously breathing patient the flow or the graph is interpreted in a clockwise fashion but when it is controlled mechanical ventilation when we are delivering a breath it's the other way around it's interpreted in a counter clockwise or anticlockwise direction that is it's the inspiration is you can see here and then the expiration and it touches the Bas line and you will have two point that is the a point and B point where the flows will be almost zero and that will be signaling your start of inspiration or start of expiration we'll look into this in bit of detail now that was the pressure volume Loop same will be true for your flow volume Loop also in flow volume Loop if you can look this is a spontaneously breathing patient and what you can see is there's a inspiration then there is a expiration so what we see normal in our spirometri when we do a pre-operative pulmonary function test or when the pulmonologist use it again two important things second important difference is you look at the volume the volume will start like from the opposite end and it will keep on increasing on the other end but if you look at a mechanically ventilated patient then it is again upside down representation so that the basically you look at the arrows here so this is the inspiration and the bottom line is the expiration something like scalar so in scalar also in the flow part we have a flow which is represented positively and the expiration is represented something in a negative way so this is the major difference between spontaneously breathing pressure volume Loop or a flow volume Loop versus control volume one is a clockwise and the mechanically controlled breads are anticlockwise now let's talk about press pressure volume Loop so this is what a pressure volume Loop looks like now let's talk about anatomy of this wave in I mean what is what are the components and everything in detail so the first and foremost important thing is you need to see there is a pressure curve here and the other thing is the volume curve so it's no longer a time graph okay so next thing is if you can see this is the pressure which we're talking and since the inspiration is starting at a point slightly away this basic pressure which is there it is representing a peep it can be a pip which has been set it can be an intrinsic peip additionally or basically it's a total peep above which the ventilator cycle is happening now you can see that there is a initial part it's very important to get through this in a way we we are able to interpret it now what will happen is we all know when the initially ventilator starts there is a pressure in the which is generated which will create a flow but the initial pressure it is required to overcome the resistance part mostly isn't it so basically it will be going through your endot tral tube through your tracha broncus and the initial pressure you see the pressure will be rising quite significantly but the correspondence volume it's not Rising that significantly so this is basically the initial part of it and then you can see there's a slight change in the shape of the curve there's sort of a point from where the pressure is not increasing but your volume is sort of increasing steadily so this is the point where once the alular recruitment has started place now it is almost like linear shaped curve so that for every given pressure your volume is increasing increasing increasing so this is becomes very important for us to understand so this is basically a area where we will say that we have an optimal compliance we want our lungs to behave or to be in this particular part of thing we all know that lungs have many different zones and the Ali some of them will be in a healthy State some of them will be disas State all of them will not behave in the same fashion but our expectation is that this is what where our lung should be ventilated that within the given period of time now again if you see what is happening is this is a volume graph and this is a pressure graph just to remind again now if you see here the pressure is increasing again significant there is no significant change in the volume which is happening for that given pressure so that is basically like we are giving a pressure but the volume is not happening and this is something what we call as a alular over distension or baking we'll see it in more detail but this is something we we want to avoid on our graph so this is basically a wasted pressure and might be a possibility of having a what you call barot trauma or similar to them now we all have heard about the inflection point terminology the lower inflection point and the upper inflection point so basically if you can look at this lower inflection point is nothing but it's a minimum pressure required for alular recruitment so you can see here it's a minimum pressure which is required for alular recruitment so this is the point where your alviz will start opening up and after this your compliance will start going up we have already seen the baking and over distension now the top of this point like whatever volume we have achieved for that given pressure this volume will correspond to the tidal volume and this pressure which is there at the end is corresponding to the peak airway pressure so this is basically tidal volume and peak airway pressure now you see once the expiration starts it's again the same process your pressure starts falling significantly and then suddenly you'll see your volume also started to come down significantly the point at which this occur is basically a upper inflection point and this is a pressure at which there is a regional over distension so if you give more than this thing so we'll talk about the utility of lower and upper inflection point in more detail so we talked about that it's a pressure it's a point airway pressure at which the resistance of Airways always overcome in situation where the airway resistance is very high this point automatically if you can see this point if you have a high resistance if I have a tube which has been used for a smaller size tube there is a significant bronos spasm my lower inflection point will get shifted to the right side but resistance or basically we say that it's not only for the initial part as long as the flow is occurring it is during inspiration and expiration there'll be some amount of resistance so the better way to define a lower inflection point is something which is representing the critical opening pressure of the Alvi so we want to keep our peep something above it so that our Alvi doesn't get collapsed again during the expiration part of it but then the question is should a lower flection point be useful in setting the peep at least in ARS cases now there are certain controversies to it we all know that decruitment occurs during the or basically the Alva starts collapsing during the expiration part isn't it so then why we are using an inspiratory limb curve for expiration so this is one controversy which is there and secondly it has been found that lower inflation Point like this diagram is sort of an very ideal diagram so here I'm able to probably pinpoint one clear area that this is a lower inflection point but this will not always be true and then the estimation of lower inflection point will vary significantly and at studies as found as almost as somewhere in the range of 5 to 10 cm of water and for a peep to have that difference of 5 to 10 cm of water at times is quite significant so probably they say it is helpful or probably it is not that helpful so the studies are pretty controversial around it and it was a common approach in 1980s 1990s there are lot of paper also but now again it has come under significant amount of strutin now let's talk about upper inflection point we all know that it's a feature of expiratory limb basically it represents the elastic recoil of the lung tissue and the chest wall that is we all know once the expiration starts your lung and your chest wall will have a natural tendency to squeeze out the air so somewhere the re-recruitment begins as the alv starts empting we are very clear about this but we don't know at which stage it is happening so probably it might be again the same picture that D recruitments occurs throughout the expiratory phase so this rapid drop in pressure at the beginning of this curve corresponds to the deflation of the most hyperinflated lung unit so this is something like we'll have a normal Alva we'll have some sort of a hyper inflated Alva and as soon as your expiratory wve is open this hyper inflated Alvi will be something which will be giving away the pressure and volume at the earliest stage and that will present this rapid drop in the pressure isn't it so now the question is should we set the peep here because the D recruitment has started here or we should we set a peep at lower inflection point now there are studies which say that probably the peep should be set in between lower and upper inflection point somewhere in between and also simultaneously looking at the other targets like your oxygenation Target your stress index and so it should be a combination of multiple things now let's see what we all can see from a press PR volume Loop now we all know that this is a machine triggered breath you can all see it's inspiration and then there is an expiration this line which is there it's almost a simple linear line and this represents your stattic comp and we want it to be as much as straight as possible for a normal L now you see there is no triggering breath but what is happen is when there's a patient trigger bread there will be some amount of negative pressure this is the natural thing when we trigger a breath there'll be some amount of naturally negative pressure breath so this can you can see as a trigger bread which we can see as a triggering in a flow volume Loop which is more easy to identify as compared to a scalar now second thing is spontaneous mode we have already talked about that it is basically an up clockwise Direction but what I wanted to emphasize here is suppose you are keeping a patient on a NIV mode or a pressure support mode or a CPAP mode you'll be applying some amount of Peep so basically the Curve will shift to the right side but the inspiration and expiration will occur still in the same so this is again very easy to identify and app your day-to-day practice now how does a pressure volume Loop looks in a volume control mode and a pressure control mode now you can see it looks pretty much same so if we'll have to look slightly into more details mean more minute observation will be required we all know that in volume control ventilation what will happen is your flow is pretty much like it's varying according to the I mean the flow is fixed and the pressure will be varying according to whatever your lung compliance is there but in the pressure pressure control mode we all know that the pressure is finalized that pressure is fixed and you don't need to change it your flows are something which will adjust accordingly and the initial part will be very steep so what the major difference here is what we can see in the pressure volume loop again the same thing I have just kept it the initial this is a pressure and this is the volume the initial part because it has been shifted to right side so this part is representing the P pressure whatever is there whe it is a set pressure whether it's a total pressure and also combination of inic pressure we have all seen that this is a tri and some of which is due to Airway resistance and some of this is due to the collapsed Ali at the start now this is the flat part because this is a pressure control mode your pressure is G pretty much fixed you can see from this particular diagram that if it's a pressure control your pressure waves are going to be a square wave and your flows are something which are going to vary depending upon the patient so this flat upright portion of the loop represents the time of decelerating P this is an initial part that is your lungs and alila started to expand now this is sort of a decelerating flow which ising to achieve your Giver title volume and your mean airway pressure will be increased now this is the line which connects the beginning of inspiration and end of inspiration this is only the time as we discussed where you'll have a zero flow and this basically represents the true static lung compliance so this becomes pretty straightforward but as the expiratory valve is open the pressure rapidly drops peep on expiration again a bit difficult to find that what exactly is going to be your expiration point or o and then we have seen that there is a pressure patient triggering now if the same pressure volume Loop if I see in a volume control mode what you can see is that with volume control there is a constant flow so probably there will be more chances to develop a lower inflection point or a upper inflection point to be there and because the there's a constant inspiratory curve also there so it can be more easily useful for finding out the compliance if I have a flow which is changing like in pressure control I might be finding it slightly difficult to find the compliance on the lung but if it's a volume control ventilation where there's a constant flow I might find it more easy to find the lung compliance now we all understand lung compliance is basically how much of volume can be generated for a given breath if I have a good lung compliance even for a 1 cm of water I might be generating 50 MLS of change in my lung volume but if I have a s or a bad lung I might not be even generating 10 mL or so so what will happen is you can see I might need more and more pressure to deliver the same volume so if you can see here the volume are same in all these three graphs okay but the pressure required for these three graphs are significantly different so here I'm requiring very less amount of pressure you can see this is a peak airway pressure this is the second peak airway pressure and this is the third peak airway pressure so Airway pressures are increasing but my volumes are pretty much same that implies that this is a bad lung with a bad compliance so what it is easy to graphically say is when your lung pressure volume leap is appearing more like sleeping on its side or lying down position it implies a bad lung or a bad compant lung and when it is more upright in a more vertical position it probably implies that you have a good compliance in the lungs so this becomes important so basically as simple as that your lung compliance is decreased your pressure volume Loop will start appearing going down and if your lung compliance is increased sometimes you'll have it in COPD mmat patient your Curve will shift to the left it will appear more straight now what will happen in a pressure control ventilation because in pressure control we have keeping the pressure fixed what is going to change is the volume so what you can see is there are three curves the pressure is same because it's a pressure control ventilation but your volume starts coming down if you have a very good complant or a over comp lung you'll have a very high volume for the same thing then it will come down and it will start coming down as much as your pressure starts dropping out so this is how a difference between a volume control and pressure so basically same lungs but two different mode of ventilation it's a volume control and pressure control so you'll be able to see compliance in both the way you'll be able to calculate compliance more better in a volume control mode with a pressure volume Loop now second thing is resistance we talked about compliance so far that how my lung is but there is also a component of resistance so what will happen is if I have to take say there is a small endot tral tube there's a patient who is biting there's a mucus Club I'll require more pressure to generate the same amount of tidal volume and if there is an expiratory resistance my Curve will again it will take more time to come down and the pressure will fall gradually down say bronos spasm is there secretion is there so what will happen is that there will be increased amount of hysteresis or basically there will be widening of the curve in compliance the Curve will shift the position your curve might not be widened it will simply be Shifting the curve and in your resistance basically the shape of the Curve will increase and many times as we see it's basically both the things which are there together there'll be some amount of increase resistance some amount of decrease compliance so you might see both the things happening in a given patient what is hysteresis hysteresis is basically see what we expect is like this has been the inspiration and ideally this should be the same way the expiration should be there but you see there's a slight difference between inspiration and expiration because of different is how the lung inflates and deflates so this Gap in between is called as hysteresis this hysteresis will increase when there is increased amount of resistance again change in Airway resistance you can see it's an expiratory resistance this should have been a normal one you can see there's a widening on the expiratory side and you can see basically it's a king or bitten endot tral tube inspiration as well as expiration both side the Curve will widen out now assessing the recruitment using pressure volume curve again not normal lung the pressure volume curve is linear we all said that it's a linear curve and the inflection and deflection curves are separated as small area of hysteresis the compliance should remain constant that is in the linear part of it but when the ards starts even in the early ards the shape may start differing and the inflation and deflation lims will demonstrate a change in the slope so what is the impli or the implication of this thing that the respiratory system compliance varies at different level of pressure we all know that and his stress is greater than in normal lung patient due to recruitment occurring during inflation and decruitment occurring during inflation what I want to say when I say what is do you mean by recruitment so what I mean to say we can now we were looking at the whole curve together now what we are doing is we are trying to look at the convexity and concavity of the lung last time we discussed about the stress index what it is simply income is that if I have a upward facing concavity I have still a potential for lung recruitment if I have a downward facing concavity my lungs are probably not going to get more expanded so less the amount of hysterisis the more and more the chances are that there will be less amount of expansion potential but if it's a concavity which is there upward I still might have a potential that my some of the lung areas are not AED and I can do a recruitment we have all SE about beaking it is called as a duck peel or beaking basically it looks like a penguin so basically this this is an extra pressure but no volume is generated and this is something which should be avoided and this can be easily identified on the pressure volume Loop isn't it now beaking generally doesn't occur with a pressure control ventilation that is one of the advantage but what will happen is your FL your volumes will keep on going up and down so that is something we need to be very clear about now one more important thing is like we saw about the triggering we saw about elastance or the compliance we talked about resistance now another important aspect is work of breathing also can be estimated from a pressure volume Loop so you can see that basically there are two types of work that is overcoming the resistive work and the elastic work that is the lung structure and everything so whatever the expiratory part is there this is basically for the FRC and everything the Natural Forces so it will be elastic work and for the resistive work you'll have resistance during the inspiration and resistance during the aspiratory work so these both of them combined together will give us a work of breathing so if you are setting a peep ey peep or extrinsic Peep And if you are also having a significant widened curve or something you'll see that your work of breathing is increasing see basically this is an again intrinsic work and this is basically and what happens is this work will again go up because you are having some amount of dynamic hyperinflation because of intrinsic peep which is developing in this patient another important usefulness is to see the leak we saw it in on volume control scalar that the volume scalar goes up but it suddenly comes down and there is a gap in there same happens here also your inspiration is there but the circuit the flow doesn't reach zero and this loss in the volume basically indicates that there is some amount of leak in the circuit this is more easily appreciable as compared to a scalar now dis synchron this is also something which you will be able to identify we have seen so far many ideal ways isn't it but many time our patient will show this type of Loof and then weit are like what is happening to this patient so basically there are various type of dis synchron which are happening there can be a flow starvation the patient is trying to initiate an inspiration the patient is trying to Exhale against the closed wall basically you see that there is an inspiration still which is happening but the patient is trying to Exhale so that is giving some sort of a peing sort of thing and then again you will have an inadequate sensitive trigger forces the patient to work hard generating a large amount of negative pressure now it should have been a small breath but if it is generating a large amount of breath you can say your pressure is probably not very nicely done and you need to do it again so this is some something useful for finding it out now coming to the second part that is the flow volume Loop flow volume Loop is a very small part I'll be covering it in a rapid way again we see we have seen that the anatomy is basically it's like a scalar only so scalar we used to have like a positive wave and this wave used to go down here we are having the flow and the flow is coming and reaching back here and then you have this volume which is being represented here you can see the inspiration is starting here and then you have an expiration which is coming there and this is basically representing your Peak flow and this is representing your Peak expiratory flow rate coming down so this is what a normal flow volume Loop looks like like a peak inspiratory flow rate this is my Peak inspiratory flow rate this is corresponding to my Peak expiratory flow rate this is the tital volume which I'm generating the inspiratory part and the expiratory part and this is where it is touching the F FRC if you want to correspond it to the scalars you can again see because there are two different shapes can you see can you appreciate the two shapes one there is a square waveforms like a pattern in this Loop and then the second is an accelerating disil pattern so if it's a square wave type of pattern we have told that wherever you look a square type wave then whichever SCAR or Loop that is the control variable so if it's a flow which is a square so I will say that this is a volume control ventilation if it's a pressure wave which is a square wave I'll say this is a pressure control ventilation so this is something which is corresponding to the same part now how do I differentiate between spontaneous and control in a flow volume Loop a spontaneous breath is recognized by the slightly irregular Contour of its inspiratory portion you can appreciate there's an slightly irregular Contour but if you look at a control ventilation it will be appearing more uniform depending upon the type of waveform which you have kept it or the flow which you have kept it again this is a square type of waveform so what I will say this is probably a volume control ventilation and because this is like a variable sort of an acceler decelerating waveform so this is basically a pressure support or a pressure control ventilation I am saying pressure support because the inspiration is abruptly ending so whatever time sensitive or pressure sensitivity I have kept say I said I had kept it at 25% of my pressure support as soon as my flow has reached to the 25% of its peak the expiration has started down here this is what a pressure control ventilation would look like inspiration EXP ation and going and as I am increasing my pressures you can see my flows will also increase and ultimately it will result in an increased tidal volume now the most important thing to identify here is an increased Airway resistance you can see that this is a normal Loop but because there is a Airway resistance you can see that the air flow has come down and therefore the tidal volume has also come down significantly what I need to understand in that graph is that the inspiratory Curve will be flattened I will have a reduced Peak expiratory flow there will be some sort of a scooping out of expiratory flow because it is time and if sufficient time is not given for say bronchospasm my b line will not touch and there will be some amount of gas trapping which will generate autop PE and dynamic hyperinflation in a long time so this is an obstructive Airway this is both of them you can see some sort of scooping out is there you are seeing that the peak aspiratory flow has come down but probably here there is still some amount of time before it is reaching expiration here the expirat time is less more sever bronchospasm may be and it is not touching the Baseline that means there is some amount of Auto peep which is happening here again if I have given a Bronco dilator this was my initial flow and once my Bronco dilator has been there because the resistance has come down my air flows has increased nicely but this is again in a spontaneously breathing patient because this is an expiration and inspiration in a mechanically ventilated patient you'll see it in a upside down fashion something like that isn't it now restrictive lung is again you'll have pretty much normal inspiration expiration but your tital volume is going to come down so you'll see that the pattern flow is pretty much the same but your tidal volume has come down and if there is an additionally decreased compliance your tidal volume has come down but also there are high flows because you're needing more amount of pressure and this is still generating despite such a high in respiratory flow and expiration you are generating a very less amount of tial volume very commonly it can be seen in say ards you'll have a very high flow but it is not generating sufficient amount of tidal volume for the patient air leak we have seen it in the pressure volume graph that it is not touching Baseline here also what is happening is it is coming back but this amount of air it is leak here is very easy to identify Airway secretions which is something we have seen in the scalars also you'll be able to appreciate it as synchrony which we have seen in the pressure volume Loop it can be during the inhalation part it can be during the exhalation part so it will be again easy to identify now coming to the last part part that is what is the utility of this thing we have talked about it in the starting it's a easy way to look at the compliance like you just look at the graph whether it is Shifting down standing straight then it is probably useful for finding the best peep for keeping lungs open and recruited it is debal we'll come to that part again definitely useful for avoiding the over distension we have seen the beaking phenomenon we will be able to estimate the work of breathing we'll be able to decide that how much support my press needs still and of course estimating the degree of Airway obstruction and its response the Bronco therapy which we're looking about flow volume Loops again the peak inspiratory flow expiratory flow tital volume air leak which we can see and of course the resistance which we'll be able to see now as we were talking to sir also sometime back before the start of seminar the flow volume Loops in certain Studies have been shown that it is able to be a good disease of severity marker and even before the symptoms appear like it becomes very Frank it might be useful to see that there are changes which are happening your flow volume Loop especially in Rel to Airway resistance if you are developing a bronos spasm you might be able to pick it early in the stage in flow volume loow pressure volume Loop the most important thing which was studied was whether can this be used to set the PIP so this is one of the article which was 1998 and this is one of the landmark articles where they said that probably this can be used to identify the lower and upper inflection points and then can be used but then in subsequent study they found that despite all this enthusiasm about use and everything it probably varies from Patient to Patient and it is difficult to identify the upper and lower inflection point because of the lung heterogenity the graph and everything and there might be a lot of interobserver variability and keeping this P Plateau around this upper infection point for majority of the patient in ards doesn't guarantee against lung over distension so while it is useful probably as a standalone point it will not be useful so you'll have to look into your scalars you'll have to look into your clinical sign you'll have to look into your number numbers on the ventilators you'll have to look into oxygenation Target and probably all combined together might still be a useful Point again for inflection you will need sedation often paralysis if you have to exactly identify the heterogenity of the lung we all know in ards there's a baby lung concept some are very hyper inflatable lungs some are like not at all recruitable and this is difficult to generate and clearcut upper and lower inflection points some trials have shown reduction in mortality but better oxygenation but not conclusive this is a very nice article in 2003 American clinics and it's a free article what they say it has nicely talked about pros and cons of a pressure volume Loop in management of ards again the same thing so probably a lot of intensivist don't find them as having additional use in day-to-day clinical practice so because of inconsistent agreement on the inflection point the heterogenous lung pathology just before I conclude this is basically the nice two studies where they talked about like different intensivist anesthesia people people with wearing sort of experience and this even found that even with most experience intensivist and everything if you're not used to looking at the scalars or the loops probably there might be chances as high as 30 to 40% to identify a given disy or anything but at the same time when you are using scalars and groups they also found that your chances of patient ventilator synchrony your chances of increased oxygenation decreased number of ventilator days or ventilator free days are increased if you are able to utilize your scalars and Loops in day-to-day practice more about scalars in your day-to-day practice so this that is why the scalars and Loops are important part for us I'll not be talking about stress Index this was basically last time we were discussing about the stress index and we're talking about the mean airway pressure so thank you sir [Applause] [Music]
Up Next
Patient Ventilator Asynchrony Classification
@LittleCriticos
17.8K views•2020-09-26

Graphic Medicine: Comics for Collaborative Healthcare Communication
@nationalpatientadvocate
189 views•2023-12-04
Ventilator Waveforms: Scalar Basics in Critical Care
@OzoneAnaesthesiaGroup
161 views•2024-07-18
Stages of Labor and Vaginal Birth | Childbirth Animation
@nucleusmedicalmedia
52.1M views•2017-08-18
Related Study Plans & Knowledge Roadmaps
Structured learning paths in Medicine