Left Ventricular Hypertrophy (LVH) on ECG can be diagnosed using two main criteria: (1) an R wave in lead AVL greater than 11mm, or (2) the sum of the R wave in leads V5/V6 plus the S wave in lead V1 exceeding 35mm; these criteria help identify LVH by detecting electrical changes resulting from increased left ventricular muscle mass.
Left Ventricular Hypertrophy on ECG: ECG Diagnosis Explained
Added:Deep Dive
Understanding of normal cardiac anatomy and physiology, specifically the electrical conduction pathway through the ventricles.

(ECG) The Hemiblocks #usmle #internal_medicine #cme #ecg #كورسات_باطنة #محاضرات_باطنة #medical
5.3K
The normal cardiac conduction system consists of the sinoatrial (SA) node, atrioventricular (AV) node, right bundle branch, and left bundle branch. The left bundle branch further divides into anterior fascicle and posterior fascicle. Electrical impulses travel from the SA node through the AV node, then down the right bundle branch and left bundle branch to the ventricles. Understanding this normal pathway is essential for recognizing conduction abnormalities.
Click to watch →

Morfologia Interna do Coração: Teoria e Prática (Sistema Circulatório)
9.6K
The ventricles contain trabeculae carneae classified as crista, pons, and pillars (papillary muscles). Papillary muscles anchor chordae tendineae that prevent valve prolapse during ventricular contraction. The crista supraventricularis separates the trabeculated region from the conus arteriosus. The cardiac conduction system generates and transmits electrical impulses coordinating heart contractions. The pathway begins at the sinoatrial node (natural pacemaker at SVC-right atrium junction), travels to the atrioventricular node (inferior-posterior interatrial septum), then through the bundle of His, which divides into right and left bundle branches. The right bundle branch penetrates the modiolus septomarginalis to reach the anterior papillary muscle, while the left bundle branch distributes to the left ventricle.
Click to watch →
Premature Ventricular Contraction - causes, symptoms, diagnosis, treatment, pathology
539.8K
The normal cardiac electrical conduction pathway begins with the SA node sending an electrical signal that propagates through the atrial walls, causing both upper chambers to contract. The signal then reaches the atrioventricular node (AV node), where it is delayed for a split second before traveling down the bundle of His into the left and right bundle branches, and finally into each ventricle's Purkinje fibers, causing them to contract.
Click to watch →
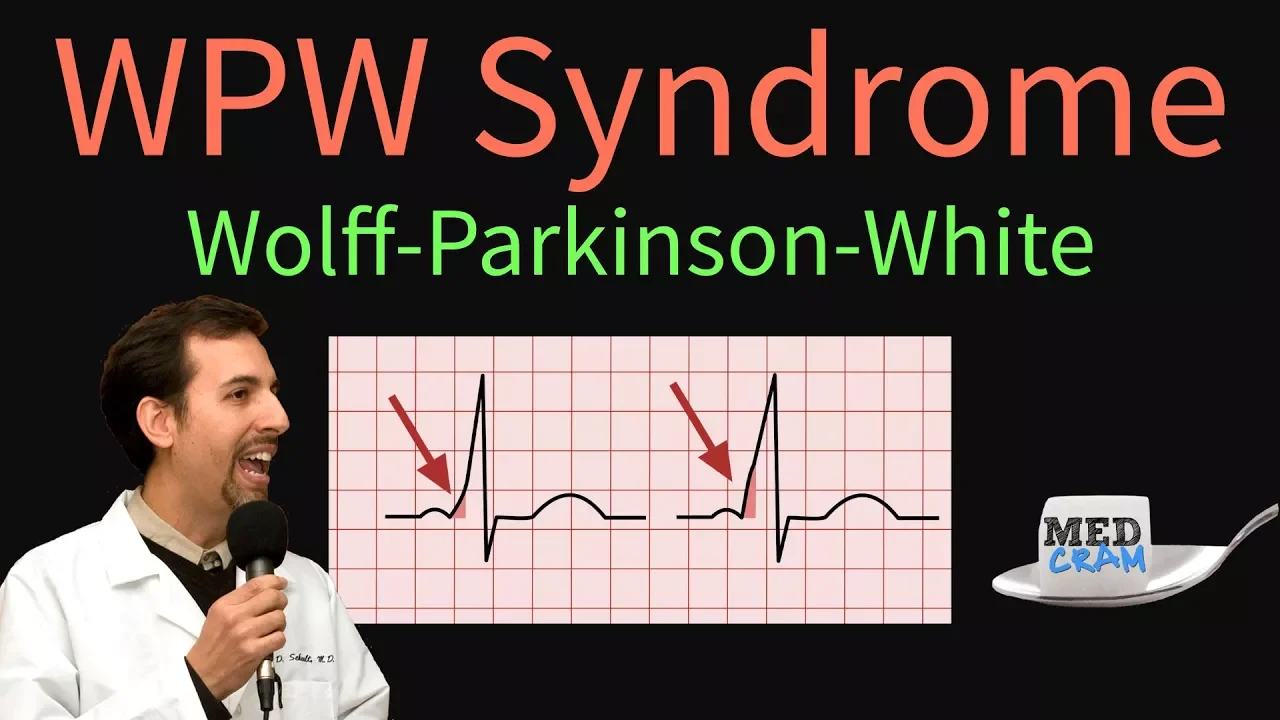
WPW / Wolff-Parkinson-White Syndrome: ECG / EKG findings, symptoms, pathology, & treatment
215.8K
The heart's electrical conduction follows a specific pathway: the sinoatrial (SA) node generates electrical impulses that depolarize the atria. Before reaching the ventricles, all electrical activity must pass through the AV node, which serves as the only normal pathway for electrical conduction to the ventricles. This system includes an insulated layer that prevents direct atrial depolarization from reaching the ventricles.
Click to watch →

Entenda de verdade o traçado do eletrocardiograma (ECG) | Explicação fácil
85.4K
This section details the ventricular conduction system and its anatomical basis. After the AV node delay, impulses travel through the bundle of His (fascio de His), which splits into right and left bundle branches. These branches carry electrical impulses to the respective ventricles. The Purkinje fibers are the final conducting elements that distribute impulses throughout the ventricular muscle. The interventricular septum is a fibrous structure with minimal muscle mass that does not contract significantly. Ventricular contraction begins at the apex (bottom) and moves upward, coordinated by the Purkinje fibers. This bottom-to-top contraction pattern ensures efficient blood ejection from the ventricles into the pulmonary artery and aorta. The left ventricle is larger and more muscular than the right because it pumps blood to the entire body (systemic circulation), which requires higher pressure.
Click to watch →
Deep Dive
Familiarity with standard 12-lead ECG electrode placement and the concept of precordial (chest) and limb leads.

ECG Course 1
572.9K
A standard 12-lead ECG consists of limb leads (I, II, III, aVR, aVL, aVF) and precordial leads (V1-V6). Limb leads are placed on the arms and legs, while precordial leads are positioned on the chest. V1 and V2 are placed on the right side of the heart, while V5 and V6 are on the left side. Lead II is commonly used for rhythm strips because it provides optimal P-wave and QRS morphology visualization.
Click to watch →

Colocación de Electrodos
277
The standard 12-lead ECG consists of 10 limb leads and 6 precordial leads. Limb leads (I, II, III, aVR, aVL, aVF) are obtained from electrodes on the right hand, left hand, and both feet. Precordial leads (V1-V6) are placed on the chest wall: V1 at the 4th intercostal space right sternal border, V2 at the 4th intercostal space left sternal border, V3 at the midpoint between V2 and V4, V4 at the 5th intercostal space midclavicular line, V5 at the 5th intercostal space anterior axillary line, and V6 at the 5th intercostal space midaxillary line. All precordial leads are placed on the left side of the chest.
Click to watch →

Seminario Clinica Médica - ECG y Ecocardiograma
230
The standard 12-lead ECG includes 6 limb leads (I, II, III, aVR, aVL, aVF) recording frontal plane activity and 6 precordial leads (V1-V6) recording horizontal plane activity. Limb leads use electrodes on upper and lower limbs, while precordial leads use chest electrodes. V1 is at the 4th intercostal space right sternal border, V2 at left sternal border, V3 midway between V2 and V4, V4 at 5th intercostal space midclavicular line, V5 at anterior axillary line, and V6 at midaxillary line. Each lead has positive and negative poles determining vector recording direction.
Click to watch →

BASIC ECG II PROF. DR. M ATAHAR ALI
1.5K
A standard 12-lead ECG uses 10 electrodes: 4 limb electrodes (right arm, left arm, right leg, left leg) and 6 precordial electrodes (V1-V6). Precordial positions: V1 at 4th intercostal space right sternum, V2 at 4th intercostal space left sternum, V3 between V2 and V4, V4 at 5th intercostal space midclavicular line, V5 at anterior axillary line, V6 at midaxillary line.
Click to watch →

Basic of ECG | ECG Made So Easy | Electrocardiography PART - 1
28.1K
A standard 12-lead ECG uses 10 electrodes: 6 chest electrodes (V1-V6) and 4 limb electrodes. The leads are classified as: Standard leads (I, II, III) - bipolar leads from limb electrodes, Augmented leads (aVR, aVL, aVF) - unipolar leads providing additional views, and Chest leads (V1-V6) - unipolar precordial leads. Chest lead placement: V1 at 4th intercostal space right sternal border, V2 at 4th intercostal space left sternal border, V3 midway between V2 and V4, V4 at 5th intercostal space midclavicular line, V5 at 5th intercostal space anterior axillary line, V6 at 5th intercostal space midaxillary line. Lead II is most commonly used for rhythm analysis.
Click to watch →
Deep Dive
Knowledge of normal ECG waveforms, intervals, and segments, particularly the QRS complex and what it represents.

Curso EKG| GESCONS
190.7K
A wave is any positive or negative deflection in the ECG. A segment is an isoelectric line between two waves. An interval is the combination of a wave plus a segment. The P wave represents atrial depolarization and is the only part of the ECG where atrial activity can be visualized. The QRS complex represents ventricular depolarization, with Q being the first negative wave, R the first positive wave, and S the first negative wave after a positive wave. The T wave represents ventricular repolarization. The ST segment extends from the end of the S wave to the beginning of the T wave and is clinically important for detecting ischemia and infarction.
Click to watch →

ECG/electrocardiogram -pqrst waves /part1-ecg interpretation and clinical Significance
1.5K
A normal ECG contains five waves: P (positive, atrial depolarization), Q (negative), R (positive, tallest wave), S (negative), and T (positive, ventricular repolarization). The baseline is a straight reference line. Complexes combine multiple waves (QRS complex represents ventricular depolarization). Segments are lines between waves (PR segment, ST segment). Intervals are time durations including segments and waves (PR interval, QRS interval, QT interval, ST interval, RR interval).
Click to watch →

Body Fluids & Circulation - L 7 | ECG | Unacademy NEET | LIVE DAILY | NEET Biology | Dr Sachin Kapur
181.4K
This segment explains the QRS complex in detail. The QRS complex begins as a downward deflection (Q wave), followed by a large upward triangular wave (R wave), and ends with a downward wave (S wave). The R wave has the maximum amplitude in ECG. The QRS complex represents rapid ventricular depolarization as the action potential spreads through ventricular contractile fibers. The instructor explains that the QRS complex is the second wave in ECG and is a composite of multiple electrical events occurring during ventricular activation.
Click to watch →
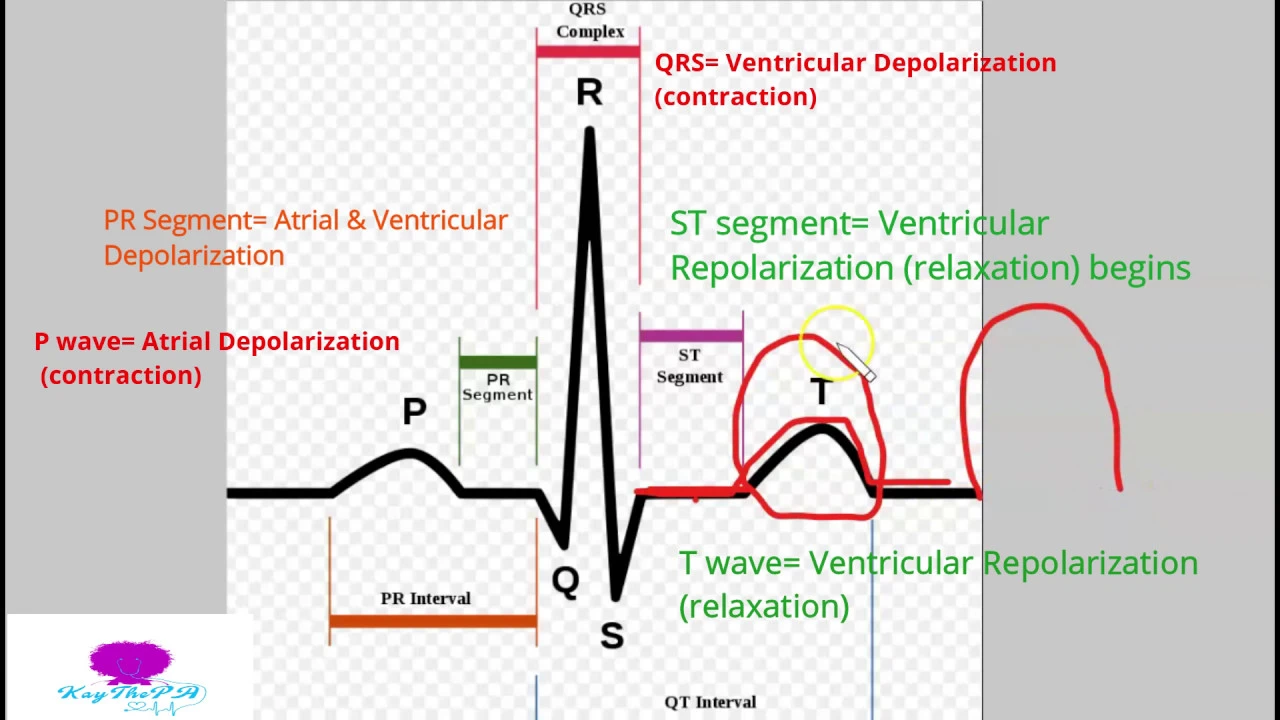
Basic EKG for the Healthcare Professional 1: Waves & Intervals
2.7K
An EKG tracing consists of specific waves and intervals that represent cardiac electrical activity: the P wave represents atrial depolarization (contraction), the PR segment shows the delay between atrial and ventricular depolarization, the QRS complex represents ventricular depolarization (contraction), the ST segment marks the beginning of ventricular repolarization (relaxation), and the T wave continues ventricular repolarization; three critical intervals include the PR interval (normal 0.12-0.20s, >0.20s indicates heart block), the QRS duration (normal <0.12s, >0.12s indicates bundle branch block), and the QT interval (normal 0.35-0.44s), while the R-R interval measures heart rate by measuring from one R wave peak to the next.
Click to watch →

Invata bazele electrocardiogramei EKG
128.4K
The QRS complex represents ventricular depolarization. Normal duration is 0.08-0.10 seconds. The Q wave is the first negative deflection (if present), R is the first positive deflection, and S is the negative deflection following R. A Q wave exceeding 1/4 the height of the adjacent R wave suggests myocardial infarction (necrosis). The R wave is the first positive deflection, and the S wave is the negative deflection following R. In some derivations (like aVR), the first deflection may be negative but is still called R if it's the first positive deflection.
Click to watch →
Deep Dive
The concept of normal R-wave progression across the precordial leads (V1 to V6).

R Wave Progression in ECG, R Wave Abnormalities in an ECG, ECG Lectures USMLE, Neet pg
107.9K
R wave progression refers to the normal pattern of R wave amplitude changes across the precordial leads (V1-V6) during ventricular depolarization, where V1 and V2 typically show small or negative R waves, V3 and V4 show intermediate R waves in a transition zone, and V5 and V6 show progressively larger positive R waves; abnormal R wave progression (poor R wave progression) occurs when this expected pattern is disrupted, such as when V1 and V2 show positive R waves or when there is inappropriate absence of Q waves in leads I and AVL, which may indicate underlying cardiac pathology including myocardial infarction or bundle branch blocks.
Click to watch →
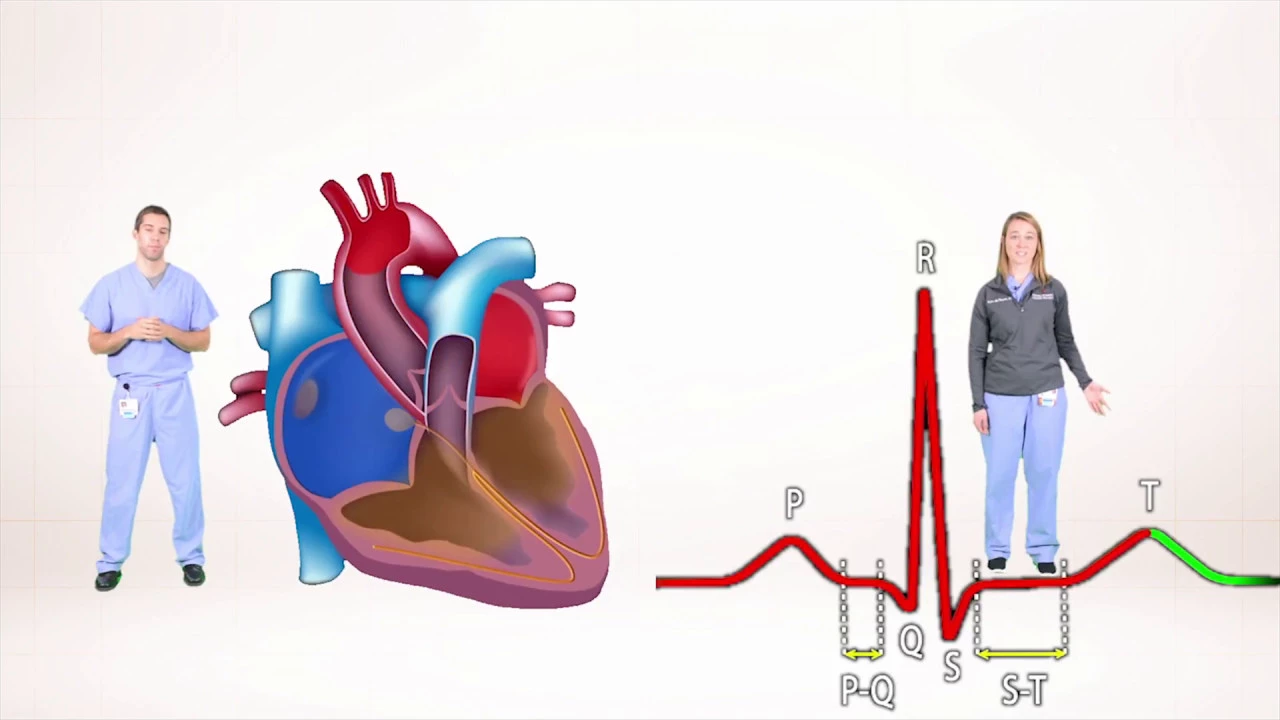
ECG for Beginners. Understanding the waves of ECG, P wave, QRS complex.
376.4K
In precordial leads V1 through V6, R wave progression follows a predictable pattern: V1 and V2 show small R waves followed by large deep S waves; V3 and V4 show R waves and S waves of approximately equal size; V5 and V6 show predominantly R waves with sometimes no visible Q wave. This normal progression reflects the changing orientation of the heart's electrical vector across the chest wall.
Click to watch →
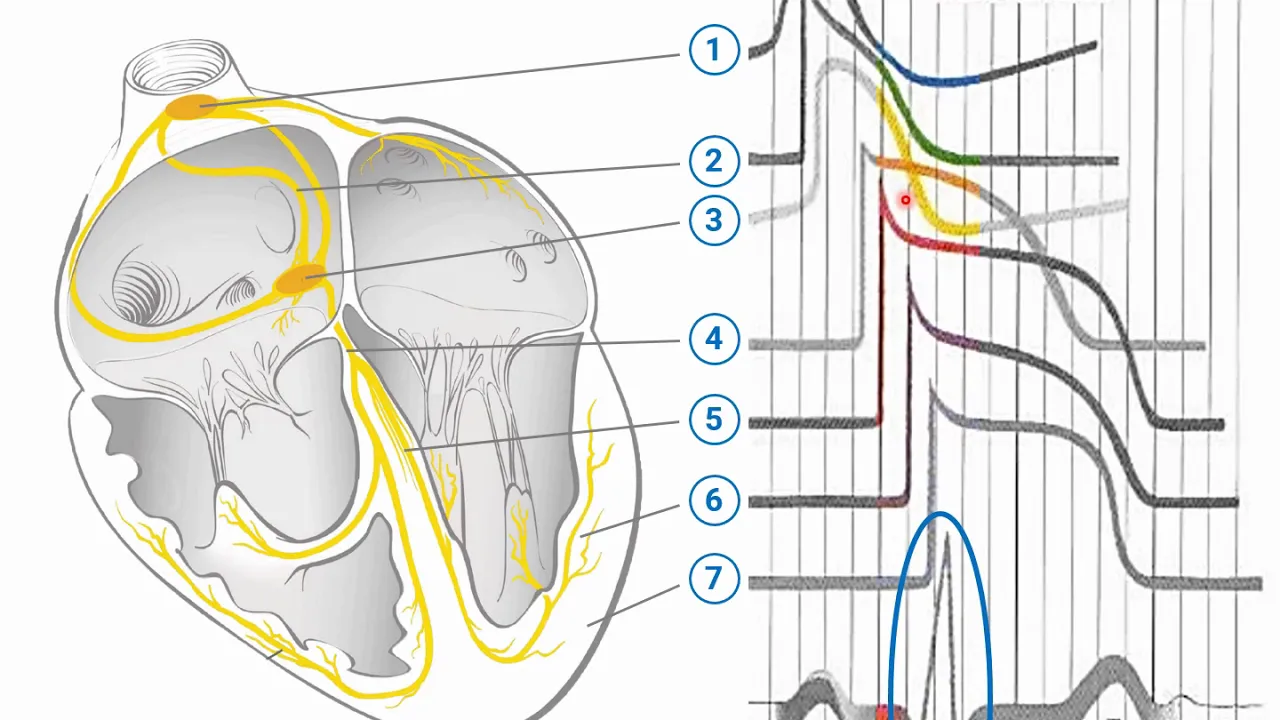
ĐIỆN TÂM ĐỒ (Phần 2)
38.2K
The R wave amplitude progressively increases from V1 to V6, reflecting the progressive depolarization of the ventricular free walls. In V1, the R wave is small because the lead views the septum (which depolarizes first). In V6, the R wave is large because the lead views the left ventricular free wall (which depolarizes last). This normal progression is called R wave progression and is essential for identifying cardiac pathology when it is absent or abnormal.
Click to watch →

Normal R wave progression, NORMAL R WAVE IN LIMB AND CHEST LEADS "NORMAL ECG VALUES" | NARCOSIS😴🤤
2.4K
Normal R-wave progression in ECG refers to the gradual increase in R-wave amplitude from lead V1 to V6 in the precordial leads, where R-wave voltage is normally at least 5mm in limb leads and exceeds 10mm in chest leads, with the R-wave being smaller than the S-wave in V1 and taller than the S-wave in V6, reflecting the normal depolarization sequence of the heart from the septum to the left ventricular apex.
Click to watch →
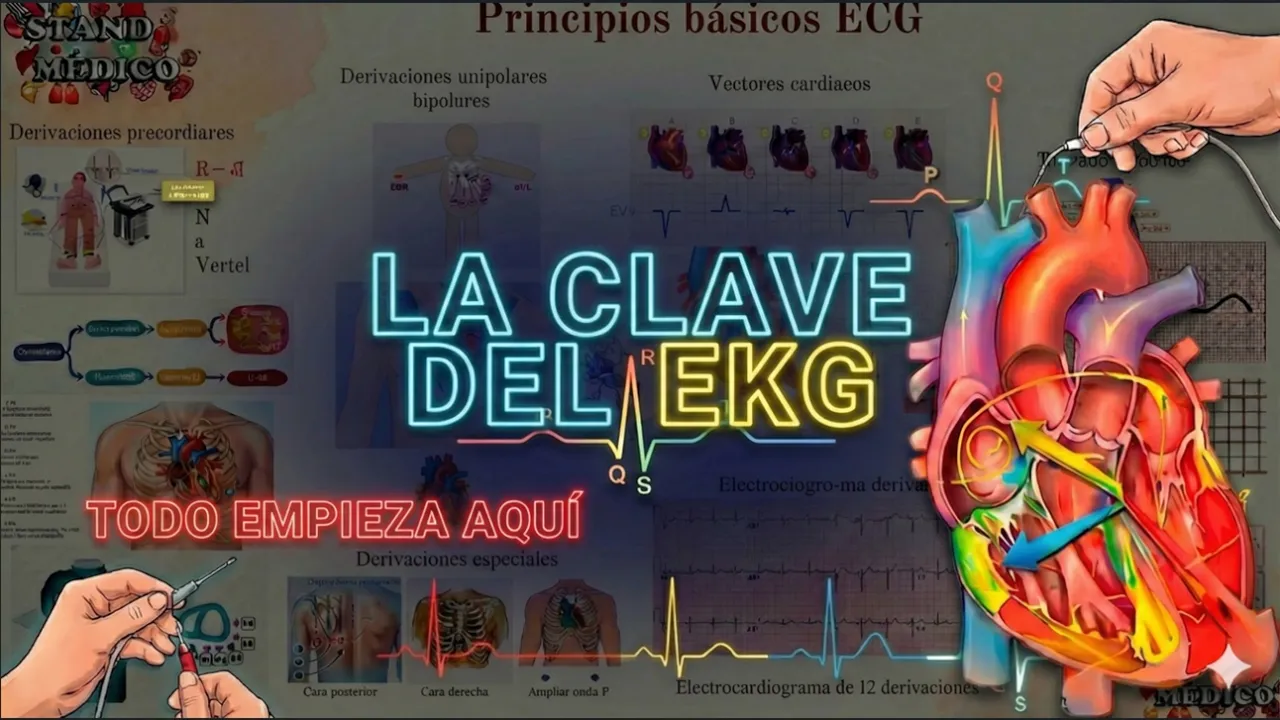
Principios y VECTORES del EKG: el porqué del trazado
103
Normal R wave progression in precordial derivations follows a predictable pattern as the electrical vector approaches the recording electrodes. In V1 and V2 (septal derivations), the R wave is small or absent, and the S wave is deep because the vector is directed away from these electrodes. In V3 and V4 (anterior derivations), the R wave begins to increase in amplitude as the vector approaches. In V5 and V6 (lateral derivations), the R wave is largest because the vector is directed most directly toward these electrodes. This progressive increase in R wave amplitude from V1 to V6 is called normal R wave progression. A standard 12-lead ECG presents all 12 derivations in sequence, with precordial derivations (V1-V6) typically shown first, followed by limb derivations. Lead II is commonly used as the long strip for detailed analysis because it aligns with the predominant cardiac vector.
Click to watch →
Prerequisite Knowledge
- Concept 01Understanding of normal cardiac anatomy and physiology, specifically the electrical conduction pathway through the ventricles.
- Concept 02Familiarity with standard 12-lead ECG electrode placement and the concept of precordial (chest) and limb leads.
- Concept 03Knowledge of normal ECG waveforms, intervals, and segments, particularly the QRS complex and what it represents.
- Concept 04The concept of normal R-wave progression across the precordial leads (V1 to V6).
Subsequent Learning
- Step 01Application of specific diagnostic criteria sets for LVH, such as the Sokolow-Lyon criteria and the Cornell voltage criteria.
- Step 02Recognizing 'strain patterns' (ST-segment and T-wave abnormalities) associated with secondary repolarization abnormalities in severe LVH.
- Step 03Differentiating LVH from mimic conditions like Left Bundle Branch Block (LBBB), Wolff-Parkinson-White (WPW) syndrome, or normal variants in young athletes.
- Step 04Clinical correlation of LVH findings with underlying etiologies such as systemic hypertension, aortic stenosis, and the role of echocardiography in definitive diagnosis.
Core Methods
AVL Criterion
Combined Criterion
Case One
Case Two
AVL Resolves
Final Takeaway
Core Methods
0:03Playing Section
- 1
Introduces two simple LVH criteria for EKG interpretation.
- 2
Focuses on practical application rather than exhaustive rules.
Limitations of ECG in LVH Diagnosis and the Superiority of Echocardiography and Cardiac MRI
While ECG criteria are widely taught, they suffer from critically low sensitivity (often 20–50%) and high variability in diagnosing Left Ventricular Hypertrophy (LVH). Electrical signals are highly influenced by non-cardiac factors like body habitus, chest wall thickness, gender, and lung disease, leading to frequent false negatives and positives. Consequently, modern clinical practice advocates for imaging modalities—specifically Echocardiography and Cardiac Magnetic Resonance (CMR)—as the true standards for diagnosis. CMR provides precise, direct measurements of myocardial mass, rendering ECG a poor substitute for definitive clinical decision-making.
Deep Dive
Application of specific diagnostic criteria sets for LVH, such as the Sokolow-Lyon criteria and the Cornell voltage criteria.
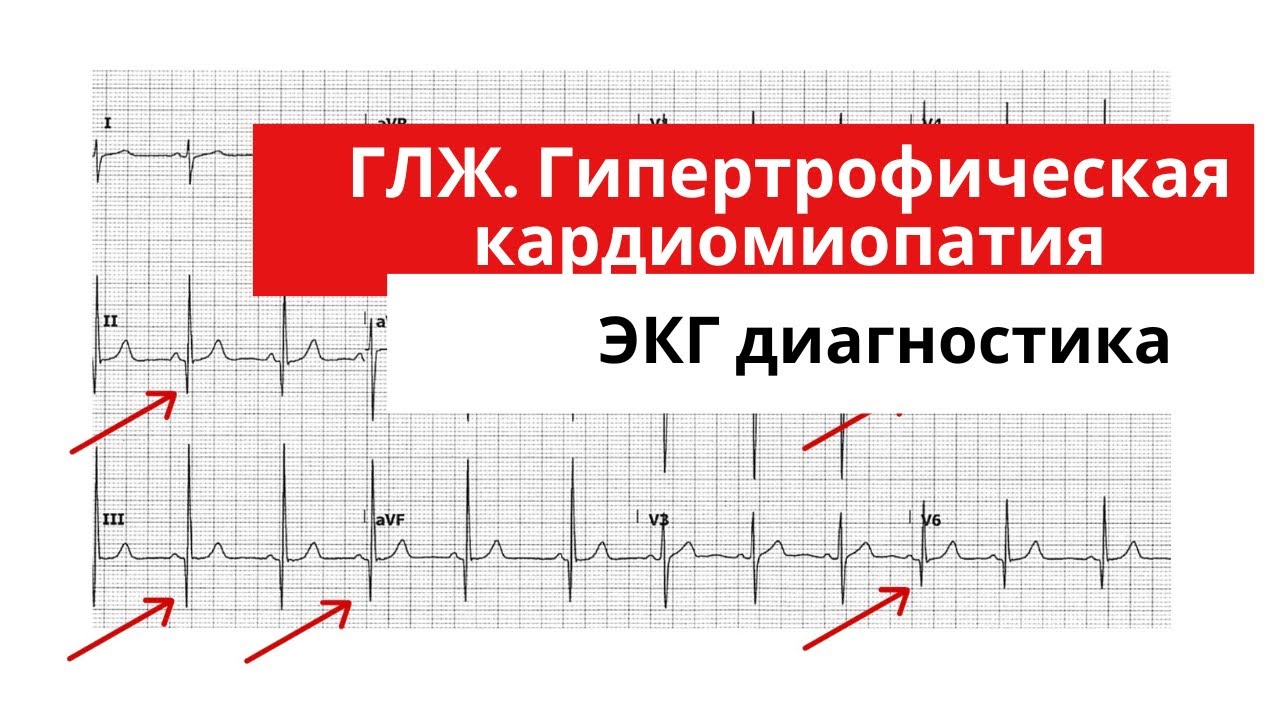
Гипертрофия левого желудочка. Гипертрофическая кардиомиопатия. Как распознать по ЭКГ?
18.2K
Two primary voltage criteria diagnose LVH. Sokolow-Lyon: sum S wave in V1/V2 plus R wave in V5/V6 ≥35mm, or R wave in aVL ≥11mm. Cornell: sum S wave in V3 plus R wave in aVL >28mm (men) or >20mm (women). These criteria have 90% specificity but only 30-40% sensitivity. Voltage criteria should not be used in young patients (<40 years) because they commonly have tall R waves in left chest leads and deep S waves in right chest leads as normal variants.
Click to watch →

How To Read An EKG In 2023 (High Yield)
53.5K
Multiple criteria exist for diagnosing LVH: Sokolow-Lyon criteria: S wave in V1 or V2 plus R wave in V5 or V6 >35mm. Framingham criteria: R wave in aVL >11mm. Cornell criteria: S wave in V3 plus R wave in aVL >28mm in men, >20mm in women. LVH is commonly associated with hypertension and can cause repolarization abnormalities (strain pattern) visible as ST-T changes following large R waves.
Click to watch →

Hipertrofia ventricular izquierda.
1.5K
The Cornell voltage criteria sums R wave in aVL with S wave in V3; thresholds are >20 mm for women and >28 mm for men, with 40% sensitivity and 92% specificity. Combining Cornell with Sokolow-Lyon indices increases diagnostic sensitivity. The Lewis index differentiates LVH from RVH: (R in I + S in III) minus (S in I + R in III); values >17 mm indicate LVH, while <14 mm indicate RVH. Additional voltage criteria include R wave >13 mm in aVL, >20 mm in aVR, >27 mm in V4-V6, and S wave >30 mm in V1-V3. These criteria provide rapid diagnostic information, though echocardiography remains the gold standard.
Click to watch →
8. QRS Complex - ECG assessment and ECG interpretation made easy
43.1K
Left ventricular hypertrophy produces high-voltage QRS complexes due to increased electrical activity toward left-sided leads (V5, V6) and away from right-sided leads (V1, V2). Sokolow-Lyon criteria diagnose LVH when SV1 + RV5/6 > 35mm. Multiple criteria exist (Cornell voltage criteria, RAE score, etc.). Right ventricular hypertrophy shows opposite pattern: dominant R waves in V1/V2 and deep S waves in V5/V6. Strain patterns (ST depression, T wave inversion) accompany both conditions, indicating myocardial ischemia or overload.
Click to watch →

Left Ventricle Hypertophy Criteria. Which One? Ischemia or Not?
5.1K
Several EKG voltage criteria exist for LVH diagnosis: (1) Sokolow-Lyon: S-wave in V1 + R-wave in V5/V6 ≥35 mm; (2) Cornell: S-wave in V3 + R-wave in aVL ≥28 mm (men) or ≥20 mm (women); (3) Cornell Product: (S-wave V3 + R-wave aVL) × QRS duration ≥2440 mV·ms. These criteria are based on the principle that in LVH, the electrical vector shifts leftward, causing deeper S-waves in V1 and taller R-waves in lateral leads. The Cornell Product modification accounts for prolonged QRS duration in LVH. Each criterion has different sensitivity and specificity, and no single criterion is perfect for all patients.
Click to watch →
Deep Dive
Recognizing 'strain patterns' (ST-segment and T-wave abnormalities) associated with secondary repolarization abnormalities in severe LVH.
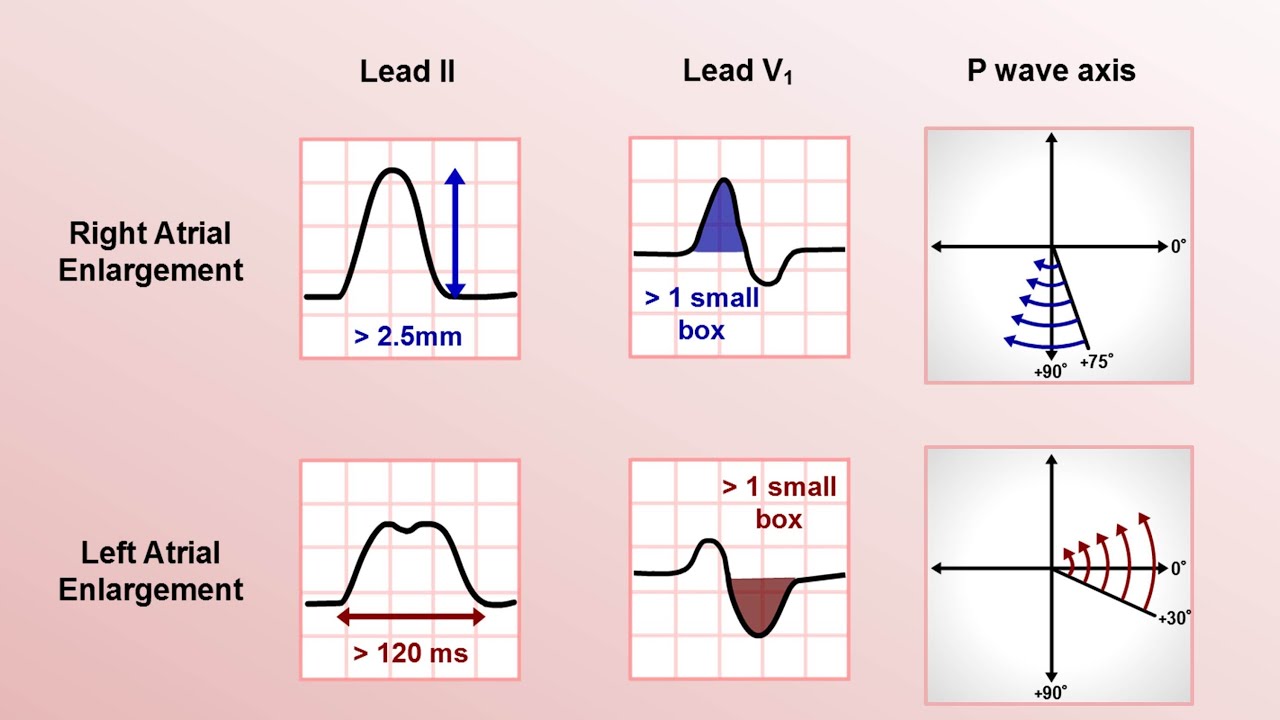
Intro to EKG Interpretation - Chamber Enlargement
358.9K
Secondary repolarization abnormalities consist of downsloping ST segment depression followed by T-wave inversion, most commonly seen in leads over the hypertrophied ventricle. These were formerly called 'strain patterns' but this term is no longer recommended as the underlying mechanism is more complex than simply an overworked ventricle. Other causes include bundle branch blocks and preexcitation syndromes.
Click to watch →

EKG Series: Strain Pattern (LVH and RVH)
10.5K
Strain patterns on EKG are ST-T wave abnormalities caused by abnormal ventricular repolarization; RVH with strain is diagnosed using the acronym STRAIN (ST concave downward, R:S ratio >1 in V1, check for biphasic T waves or S1Q3T3 pattern, and inverted T waves), while LVH with strain is diagnosed using the same acronym but looking for ST depression in lateral leads (V4-V6) with ST elevation in right leads (V1-V3), all left precordials depressed, and inverted T waves in laterals; however, ST elevation alone cannot definitively diagnose strain versus STEMI without clinical correlation.
Click to watch →
3° Aula do Curso de Eletrocardiograma - LACARD
180
Left ventricular overload produces secondary repolarization changes including ST segment depression and T wave inversion in lateral precordial leads (V5, V6). This occurs because hypertrophied muscle has relatively less coronary blood supply, creating an ischemia-like pattern. These changes are secondary to overload and should not be interpreted as primary ischemia. The pattern of ST depression and T inversion in V5-V6 is called the 'strain pattern' or 'estrem pattern' when in left precordial leads. This pattern indicates left ventricular overload.
Click to watch →

ECG course: Ventricular Enlargement, Dr. Sherif Altoukhy
12.9K
Secondary repolarization abnormalities, termed strain patterns, occur when ventricular hypertrophy impairs normal repolarization, causing ST segment depression and T wave inversions. In LVH, strain pattern appears in lateral leads (V5-V6, aVL) as T wave inversion and ST depression. In RVH, strain pattern appears in right precordial leads (V1-V3) and inferior leads (II, III, aVF). These changes result from delayed and abnormal repolarization in the hypertrophied myocardium. While ECG provides initial screening, echocardiography is essential for confirmation—measuring wall thickness and calculating mass index to differentiate pathological hypertrophy from physiological adaptations like athlete's heart. The key distinction: LVH exaggerates normal R wave progression; RVH reverses it.
Click to watch →

Generalidades del EKG y la Enfermedad Coronaria
10K
Left ventricular hypertrophy (LVH) with strain pattern is characterized by high voltage QRS complexes in left-sided leads (V5, V6, I, aVL) with specific repolarization abnormalities. The Sokolow-Lyon criteria (S in V1 + R in V5 or V6 > 35 mm) or Cornell criteria (R in aVL + S in V3 > 28 mm in men, > 20 mm in women) can be used for diagnosis. The strain pattern shows ST-segment depression and T-wave inversion in lateral leads (I, aVL, V5, V6), representing subendocardial ischemia from increased wall stress. This pattern is distinct from acute ischemia and indicates chronic pressure overload of the left ventricle.
Click to watch →
Deep Dive
Differentiating LVH from mimic conditions like Left Bundle Branch Block (LBBB), Wolff-Parkinson-White (WPW) syndrome, or normal variants in young athletes.

Master the Left Bundle Branch Block ECG: Get a clear understanding of LBBB with our video.
240
Wide QRS patterns resembling bundle branch blocks may not always indicate true BBB. Pacemaker rhythms can mimic BBB: right ventricular pacing mimics LBBB by activating ventricles from the RV apex, while left ventricular pacing resembles RBBB by activating from back to front toward V1. Left ventricular hypertrophy (LVH) can mimic LBBB with prolonged QRS, increased voltage, and T-wave discordance, but is distinguished by prolonged intrinsicoid deflection (>60ms) in V5-V6. Ventricular pre-excitation (Wolff-Parkinson-White syndrome) creates BBB-like patterns: left ventricular pre-excitation produces positive R wave in V1, while right ventricular pre-excitation creates deep S waves in V1, with short PR interval and Delta wave as clues. Ventricular arrhythmias at slower rates can also resemble BBB. The left bundle system subdivides into anterior and posterior fascicles, while the right bundle is a single pathway. Fascicular blocks shift QRS axis without widening: Left Anterior Fascicular Block (LAFB) causes left axis deviation (-45° or more), while Left Posterior Fascicular Block (LPFB) causes right axis deviation (+120° or more). Bifascicular block indicates blockage of any two fascicles.
Click to watch →

LVH & LBBB | ECG FINDINGS
206
Left Ventricular Hypertrophy (LVH) is diagnosed using the Sokolow-Lyon criteria: sum of S wave in V1 plus R wave in V5/V6 exceeding 35 mm, or R wave in aVL exceeding 11 mm. Left Bundle Branch Block (LBBB) is identified by a broad QRS complex (>120ms) with a W pattern in V1 and M pattern in V6, along with broad QRS complexes in leads I and aVL. These conditions can coexist and should be evaluated together for comprehensive cardiac assessment.
Click to watch →

ПРАЗДНИЧНЫЙ ПРЯМОЙ ЭФИР КАРДИОЛОГА #shorts
90.1K
Left ventricular hypertrophy (LVH) in young athletes may be a physiological response to intense training (athlete's heart). If there are no other risk factors (hypertension, rhythm disturbances), this may not require intervention. However, ongoing cardiology monitoring is recommended.
Click to watch →
Other ECG abnormalities: Q wave, LAD, LAE, RBBB. How to manage? G.Finocchiaro
569
Complete left bundle branch block (LBBB) is always abnormal in athletes, defined by QRS >120ms, dominant S in V1, and broad R waves in lateral leads. LBBB is rare in athletes (<1/1000) but common in cardiomyopathies (31% of dilated cardiomyopathy patients). LBBB predicts mortality and requires full diagnostic workup. Ventricular pre-excitation (WPW) shows short PR <120ms and delta wave, the second most common ECG finding in athletes. Despite being common (2 found in 100 screened), it carries sudden cardiac death risk and requires EP study regardless of symptoms.
Click to watch →
Lecture de l’ECG en pratique d’urgence Pr Said Jidane
7.2K
This section covers conduction abnormalities and special syndromes. Left bundle branch block (LBBB) shows wide QRS complexes (>0.12 seconds) with characteristic morphology. The Sgarbossa criteria identify acute MI in LBBB: concordant ST elevation >1 mm, concordant ST depression >1 mm, or discordant ST elevation >5 mm. Wolff-Parkinson-White (WPW) syndrome shows delta wave (slurred QRS upstroke) and short PR interval (<0.12 seconds), representing early ventricular activation through an accessory pathway. WPW can lead to reentrant tachycardias and ventricular fibrillation. Treatment involves ablation of the accessory pathway. Left ventricular hypertrophy (LVH) is diagnosed using Cornell criteria: R in aVL + S in V3 >28 mm in men, >20 mm in women.
Click to watch →
Deep Dive
Clinical correlation of LVH findings with underlying etiologies such as systemic hypertension, aortic stenosis, and the role of echocardiography in definitive diagnosis.
Left Ventricle Hypertophy Criteria. Which One? Ischemia or Not?
5.1K
When LVH criteria are positive: (1) Consider clinical context (hypertension, aortic stenosis, etc.); (2) Use echocardiography for confirmation; (3) Consider serial EKGs to track changes; (4) Differentiate LVH from ischemia (LVH strain shows asymmetric ST depression, ischemia shows symmetric patterns). The key is to use EKG criteria as screening tools, not definitive diagnoses, and always correlate with clinical findings.
Click to watch →

Left ventricular hypertrophy
80.1K
Beyond hypertension, multiple conditions cause LVH: aortic stenosis (narrowed valve increases cardiac workload), amyloidosis/Fabry disease (abnormal protein deposition in heart muscle), kidney dysfunction (fluid retention and pressure elevation), and hypertrophic cardiomyopathy (genetic inheritance causing abnormal wall thickening). When LVH is diagnosed, clinicians must systematically investigate underlying causes through 24-hour blood pressure monitoring, echocardiography for valvular assessment, kidney function tests, and family history evaluation. Identifying the root cause is critical because treating the underlying condition can reverse LVH and prevent progression to serious complications.
Click to watch →

Left Ventricular Hypertrophy (LVH) - What is LVH, and how is it diagnosed & managed?
43.1K
Left Ventricular Hypertrophy (LVH) is defined as an increase in left ventricular mass due to increased wall thickness, cavity size, or both, primarily caused by chronic pressure or volume overload from conditions like hypertension, aortic stenosis, or valvular diseases; it presents with characteristic ECG findings including increased QRS voltage, prolonged QRS duration, left axis deviation, and ST-T wave changes, though echocardiography remains the gold standard for diagnosis and quantification; management focuses on treating the underlying cause rather than LVH itself, as untreated LVH can progress to heart failure, ischemia, and arrhythmias.
Click to watch →

Work-up del paziente ipertenso: dalle linee guida alla pratica clinica
195
Echocardiography evaluates LVH by measuring interventricular septum and posterior wall thickness with end-diastolic diameter to calculate left ventricular mass. Eccentric hypertrophy shows increased wall thickness with normal chamber dimensions, while concentric hypertrophy shows increased wall thickness with normal wall-to-radius ratio. ECG can identify LVH changes over time, which is important given the high prevalence of hypertension makes annual echocardiography unsustainable. Patients whose LV mass regresses have significantly better prognosis than those with persistent LVH. The LIFE study showed losartan 100 mg reduced primary composite endpoint, particularly stroke, with benefit anticipated within the first year by LVH regression. Meta-analyses show ACE inhibitors, ARBs, and calcium channel blockers determine greater blood pressure reduction and LVH regression. ECG findings include left axis deviation, left anterior fascicular block, intraventricular conduction abnormalities, and arrhythmias like ventricular extrasystoles causing ECG artifacts.
Click to watch →

03.04.2021 19:00 Поражение сердца как органа мишени артериальной гипертензии. Часть 1
1.3K
Two instrumental methods diagnose LVH: ECG and echocardiography. ECG has low sensitivity (5-50%) but high specificity (85-95%), while echocardiography achieves 85-100% sensitivity and is the gold standard. Three ECG criteria exist: (1) Sokolow-Lyon index (S in V1 + R in V5/V6 > 35 mm); (2) R wave in aVL > 11 mm; (3) Cornell product (S in V3 + R in aVL × QRS duration > 28 mm for men, > 20 mm for women, or > 2400 mm·ms). Echocardiography directly measures wall thickness and calculates left ventricular mass index (LVMI), with thresholds of 95 g/m² for women and 115 g/m² for men when indexed to body surface area.
Click to watch →
Core Methods
AVL Criterion
Combined Criterion
Case One
Case Two
AVL Resolves
Final Takeaway
Core Methods
0:03- 1
Introduces two simple LVH criteria for EKG interpretation.
- 2
Focuses on practical application rather than exhaustive rules.
Limitations of ECG in LVH Diagnosis and the Superiority of Echocardiography and Cardiac MRI
While ECG criteria are widely taught, they suffer from critically low sensitivity (often 20–50%) and high variability in diagnosing Left Ventricular Hypertrophy (LVH). Electrical signals are highly influenced by non-cardiac factors like body habitus, chest wall thickness, gender, and lung disease, leading to frequent false negatives and positives. Consequently, modern clinical practice advocates for imaging modalities—specifically Echocardiography and Cardiac Magnetic Resonance (CMR)—as the true standards for diagnosis. CMR provides precise, direct measurements of myocardial mass, rendering ECG a poor substitute for definitive clinical decision-making.
Understanding of normal cardiac anatomy and physiology, specifically the electrical conduction pathway through the ventricles.
Familiarity with standard 12-lead ECG electrode placement and the concept of precordial (chest) and limb leads.
Knowledge of normal ECG waveforms, intervals, and segments, particularly the QRS complex and what it represents.
The concept of normal R-wave progression across the precordial leads (V1 to V6).
Application of specific diagnostic criteria sets for LVH, such as the Sokolow-Lyon criteria and the Cornell voltage criteria.
Recognizing 'strain patterns' (ST-segment and T-wave abnormalities) associated with secondary repolarization abnormalities in severe LVH.
Differentiating LVH from mimic conditions like Left Bundle Branch Block (LBBB), Wolff-Parkinson-White (WPW) syndrome, or normal variants in young athletes.
Clinical correlation of LVH findings with underlying etiologies such as systemic hypertension, aortic stenosis, and the role of echocardiography in definitive diagnosis.
145.1K views2Klikes2:51@drjamalsusmlenotesandmatch6200Original Release: 2018-10-02
okay so this is a short lecture about LVH criteria on EKGs, you might be asked that a lot while you're reading your EKGs. basically there are tons of criteria for LVH but for your level you can use those two simple methods: either you look at lead AVL and measure the R wave. if the R wave is above 11 millimeters then this goes with LVH. the other criteria which might be a little bit more complicated but it's very good you look at the R wave in v5 and v6 you measure its height and then you add it to the S wave on v1. if the sum of this makes it more than 35 millimeter then the patient has LVH. let's see how it looks in examples. if you look at this EKG you can notice that the R wave in v6 is too tall. if we count it it's gonna be 5 10 15 20 maybe 25 so the R is going to be 25 while you add it to the S wave in v1 and the s in v1 is gonna be from here to here it's gonna be 5 10 15 20 or so. so the S wave is 20 if you add them together you'll end up with 45 millimeter and that's above than 35 millimeter so that tells me that this patient has LVH well if you look at this EKG doing this R and S criteria might not be enough see the R and v5 and v6 is not it's not that high. S might be high but if you add them together you might not reach 35 but if you look at AVL and count how many boxes you have for the R wave. you can see that you have at least 5 10 15 and maybe a little bit more let's call it 15 millimeter for that criteria we said in AVL the R should be higher than 11 millimeter if we have 15 millimeters so this patient has LVH by the AVL criteria and this is how you can basically say if your patient has LVH by just looking at his EKG
Up Next

10:04
Right Ventricular Hypertrophy RVH ECG Interpretation Made Easy
@MedNerdDrWaqasFazal
81K views•2023-06-18

48:47
Graphic Medicine: Comics for Collaborative Healthcare Communication
@nationalpatientadvocate
189 views•2023-12-04

10:28
Neuroanatomy: Central and Peripheral Nervous System Divisions Explained
@AKLECTURES
136.2K views•2014-09-20
3:05
Stages of Labor and Vaginal Birth | Childbirth Animation
@nucleusmedicalmedia
52.1M views•2017-08-18
Related Study Plans & Knowledge Roadmaps
Structured learning paths in Medicine
medicine
Abnormal LFTs: Diagnostic Workup & Pathology
01Liver Anatomy and Basic Physiology
02Introduction to Liver Function Tests (LFTs)
03Hepatocellular vs. Cholestatic Patterns
+ 3 more learning modules
12h6 modules
Explore Roadmap
medicine
Analyzing Blood Smears: RBC, WBC & Platelets
01Introduction to Blood Components & Smear Preparation
02Normal Morphology of Blood Cells
03Erythrocyte Pathologies & Morphological Variants
+ 2 more learning modules
12h5 modules
Explore Roadmap
medicine
Mechanical Ventilation: Waveforms & Alarms
01Anatomy and Physiology of Breathing
02Introduction to Mechanical Ventilation & Core Modes
03Ventilator Settings and Waveform Interpretation
+ 2 more learning modules
12h5 modules
Explore Roadmap
medicine
Neuro Exam: Localization & Stroke Syndromes
01Foundations of Neuroanatomy and Vascular Supply
02The Neurological Examination: Step-by-Step
03Principles of Neurological Localization
+ 3 more learning modules
18h6 modules
Explore Roadmap