












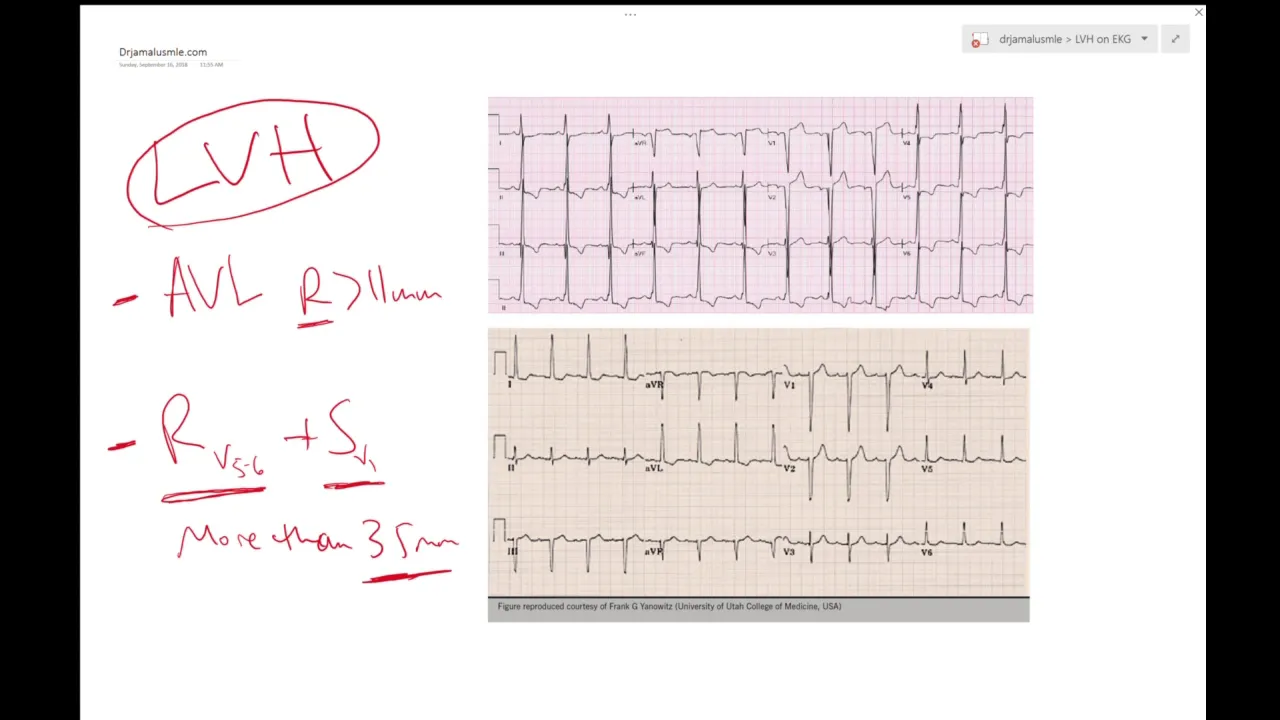








Right Ventricular Hypertrophy (RVH) is diagnosed on ECG by identifying positive QRS deflection in leads V1 and V2 with an R/S ratio of ≥1, representing a key indicator of right ventricular muscle thickening; however, this diagnosis must be confirmed by excluding right bundle branch block and considering causes such as pulmonary valve stenosis or ASD, while recognizing that strain patterns (upward-sloping ST segment with T-wave inversion) support but do not confirm the diagnosis.
Right Ventricular Hypertrophy RVH ECG Interpretation Made Easy
Added:Basic 12-lead ECG anatomy and lead placement, specifically the orientation of the precordial leads V1 through V6.
The concept of the cardiac electrical axis and how to identify Right Axis Deviation (RAD).
Normal cardiac anatomy and physiology, including the relative muscle mass of the left versus the right ventricle under normal physiological conditions.
The standard morphology of the QRS complex and T waves in a normal electrocardiogram.
Left Ventricular Hypertrophy (LVH) ECG criteria and how to clinically differentiate it from RVH.
Clinical etiologies of RVH, such as pulmonary hypertension, chronic obstructive pulmonary disease (COPD), and valvular heart diseases like mitral stenosis.
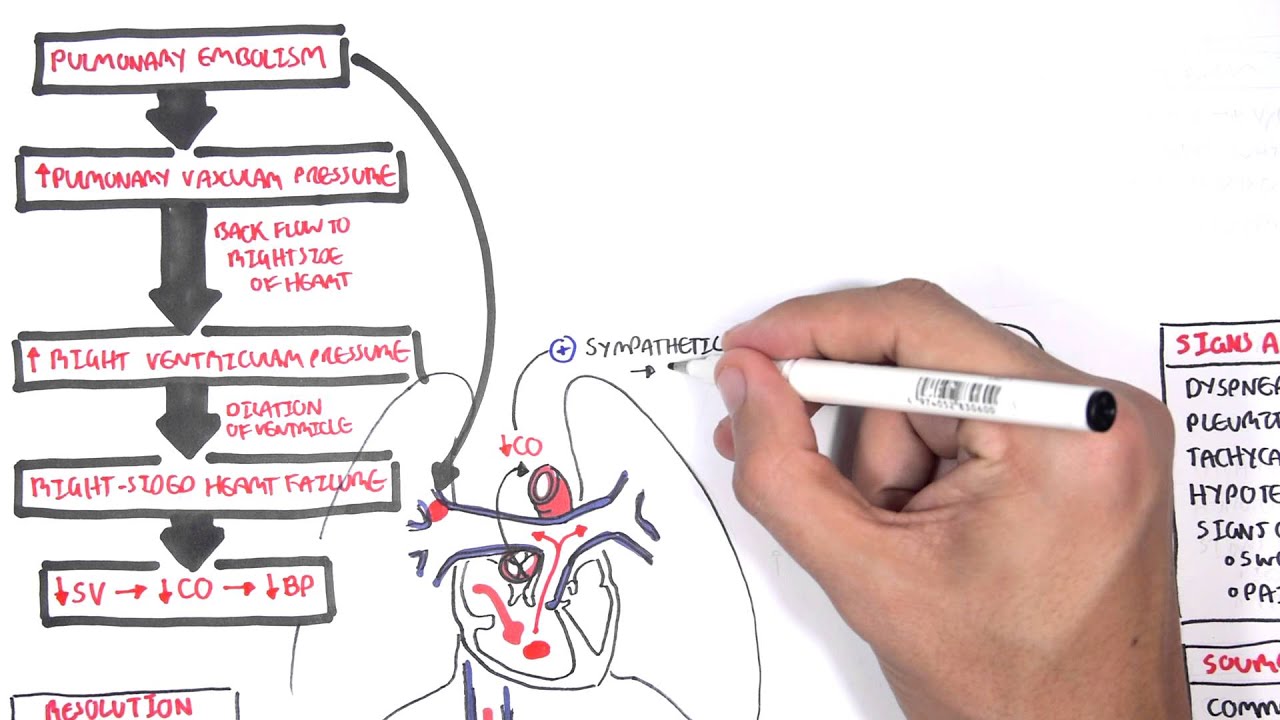
Distinguishing right ventricular strain patterns on an ECG from acute ischemic changes and acute pulmonary embolism (including the S1Q3T3 pattern).
Pediatric ECG interpretation, specifically understanding when right ventricular dominance is physiological (normal newborn) versus pathological.
81K views1.8Klikes10:04Original Release: 2023-06-18
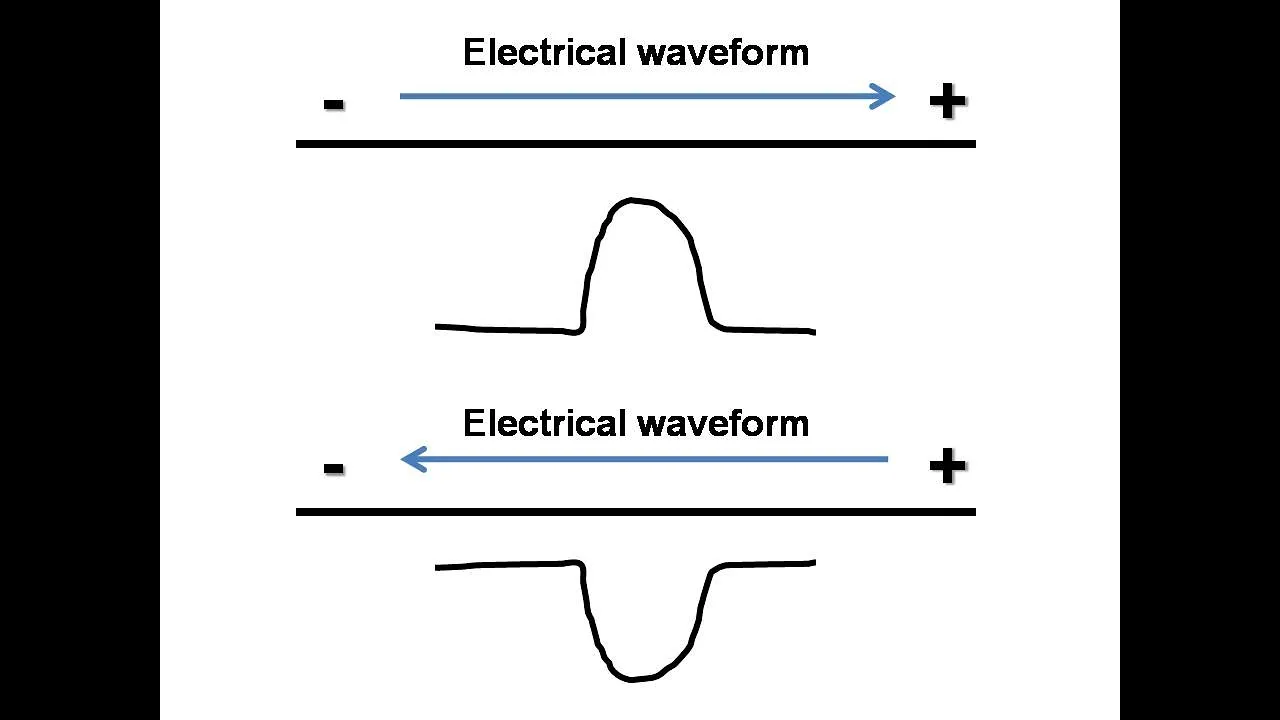
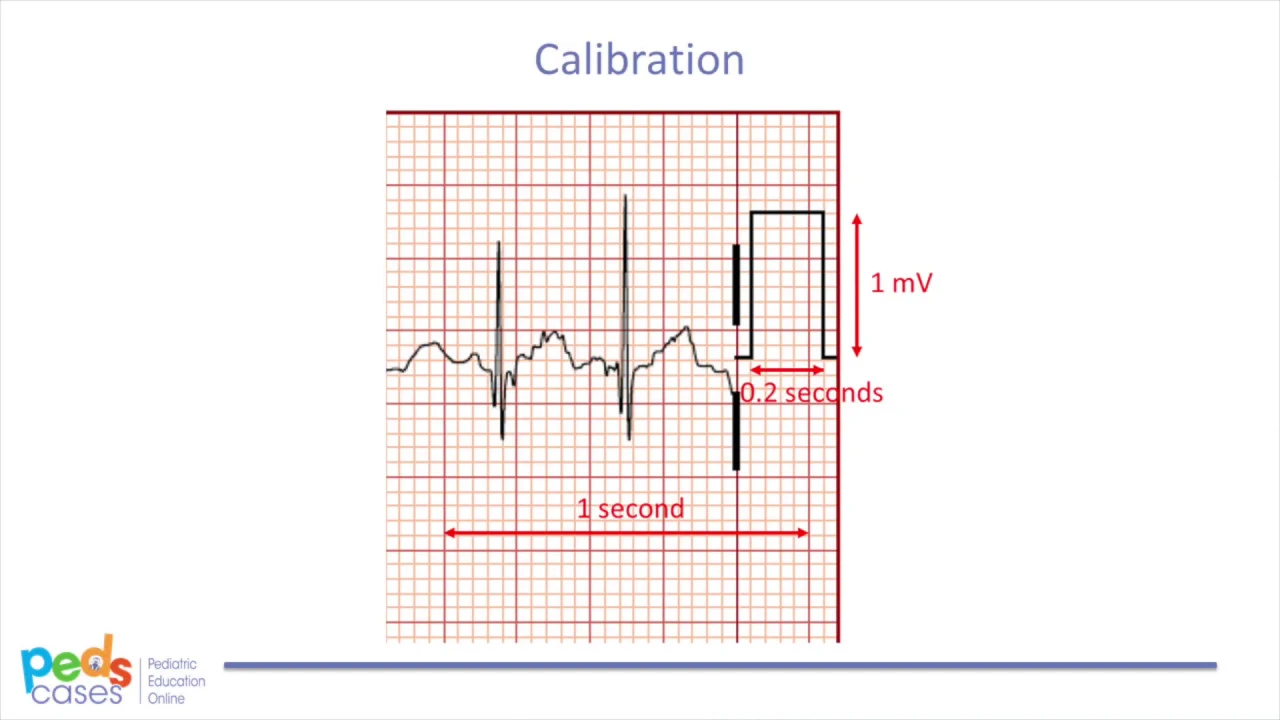
okay in our video series of ECG interpretation Made Easy by six step method in this video we are going to talk about step 5 of ECG interpretation and that is the hypertrophy in this video we are going to talk about ventricular hypertrophy in my previous video I talked about atrial hypertrophy in detail first of all coming to right ventricular hypertrophy in right ventricular hypertrophy what you are going to see is that you are going to see changes in the QRS complex in V1 and V2 since the ventricles cause QRS complex on ECG and if there are changes in the ventricles there will be changes in the QRS complexes and you will have to look at lead V1 and Lead V2 to look for right ventricular hypertrophy now normally on an ECG in V1 and V2 the QRS complexes are negatively deflected as we discussed in our wave progression video that QRS complexes are normally negatively deflected in V1 and V2 but if they are positively deflected if there is a huge R wave it means that there is a right ventricular hypertrophy and if you take the RS size ratio if you calculate the size of R wave and you divide it by the size of S12 since the r wave is bigger you will get an answer of greater than or equal to 1. so RS ratio is greater than or equal to one millimeter greater than or equal to one small box so the r wave is bigger normally in V1 and V 2 the r will be small the normal ROV is small the S Wave is bigger but if the r wave gets huge if it is large and S Wave is small and the ratio is greater than or equal to 1 that shows that there is right ventricular hypertrophy how do you calculate the r wave you can use calipers you calculate the size of R wave and then you calculate the size of S Wave and then you divide the R by S or what you can simply do is that you calculate the number of small boxes or number of large boxes in the r wave and you divide it by the number of small or large boxes in the S Wave and you get an answer if the answer is more than one the r wave is bigger and it is right ventricular hypertrophy now the other supporting criteria of right ventricular hypertrophy include right atrial enlargement in the right it will enlargement you will see p material on PV we have talked about right lateral enlargement in details in my previous video you can check out that video the link is given in the description below write excess deviation strain pattern now the first two things I have already discussed in my previous video The Strain pattern is a new thing in the strain pattern Whenever there is hypertrophy in the heart you will see a certain pattern of strain certain pattern of stress on the ventricles The Strain pattern is seen in V1 and V2 and the strain pattern appears as a rounds upward slope on the ST segment and T wave inversion that round slope this round slope does not indicate any ischemia this does not indicate sub endocardial ischemia this round shape this round pattern this is strain pattern and it is really Associated Whenever there is direct ventricular hypertrophy or when left ventricular hypertrophy there are associated changes of strain pattern this is the strain pattern this does not indicate ischemia now these are supporting criterias these are not the main criterias the main criteria is that the r wave will be bigger than the S Wave the ratio is more than one now there is also an exclusion criteria that you need to know because whenever these things are present you cannot commend on right ventricular hypertrophy if there is right bundle branch block there will be M wave in V1 and V2 and you cannot say that that patient is having a right ventricular hypertrophy because if these things are present you cannot comment on right ventricular hypertrophy by this method and there is a posterior wall Mi and in young children and adolescents in these patients you cannot say for sure that right ventricular hypertrophy is present by this calculation method causes of right ventricular hypertrophy include pulmonary valve stenosis ASD tetralogy of fellow in all these in technology fellow we also have pulmonary strenues now if the pulmonary valve is blocked the right ventricle has to push harder to push the blood out from it so that there will be right ventricular hypertrophy and you will see ECG changes that point out toward right ventricular hypertrophy now this is an ECG showing right ventricular hypertrophy if you look at V1 if you look as I said normally the QRS complexes should be negatively deflected should be negatively deflected in V1 and V2 normal QRS complexes are negatively deflected but over here in V1 and V2 the QRS complexes are positively reflected they are deflected upwards this is not normal this is not a normal pattern this indicates that there is right ventricular hypertrophy if you look at the r wave and you compare the r wave with this small negative deflection the S Wave the r wave is bigger than the S Wave RS ratio is greater than 1 and this indicates that there is right ventricular hypertrophy now with that if you look over here this this upward sloping look at the sloping of the ST segment look at the inversion of the T wave this sloping pattern this sloping indicates to what the strain pattern this is the strain pattern upward deflection of the r wave with strain pattern with strain pattern this is not showing ischemia this is showing the right ventricular hypertrophy look over here over here this is the presentation of right ventricular hypertrophy now we will solve this ECG by six step method and we'll solve find out that whether there is right Axis deviation or not we will find out more supporting criterias for right ventricular hypertrophy now if you have been following my previous videos you will be easily able to understand what is calibration Rhythm interpretation our way of progression X is deviation bundle branch I have talked about this six step method in detail in my previous videos you can check out those videos the link are given in the description below now let's solve this ccgl the general impression is that it looks good there are no ugly morphologies and the calibration let us look at the calibration the calibration marker shows it is two large boxes tall one large box white which is standard calibration the ECG is printed out at 25 millimeter per second let's look at the Rhythm interpretation in the Rhythm interpretation this is the sinus rhythm there are p waves followed by QRS complexes p waves followed by QRS complexes it is a sinus rhythm let's look at the rate let's calculate the number of large boxes between the QRS complexes we have one two three four and almost five so 300 150 175 and 60 60 beats per minute sinus rhythm at the rate of 60 beats per minute let's look at the r wave progression now in the r wave progression we look at the precordial leads in the precordial leads V one and v two should be negatively reflected V5 and V6 should be positively deflected and they are positively deflected in V5 V6 but they are also positively reflected in V1 and V2 which is not normal the r wave progression is poor there is poor R wave progression now let's look for axis deviation in the axis deviation you will have to look for Lead 1 and you will have to look for lead avf now in normal axis the both QRS complexes are positively deflected in Lead 1 the QRS complex is negatively deflected because this S Wave is bigger than the r deflection the S deflection is bigger than the r deflection so it is a negatively duplex it is a downward deflecting QRS complex if we look at the evf it is upward deflected now if both the QRS are pointing toward each other if they are trying to reach out for each other if the QRS reaches for each other that is a right Axis deviation so there is a right Axis deviation in the ccg if you look for bundle branch block we'll have to look at V1 V2 let us find out for the M way we do not have an M wave let us look for V5 V6 we do not have an the M wave over here so there is no bundle branch block now let us look for hypertrophy let's go for the atrial hypertrophy in the atrial hypertrophy let's look at the P wave the p waves are normal over here there is small notching present in the lead one but it is the P wave is not wide if the notching is there the PVF should be greater than three small boxes so the P wave is small so we will say that the hypertrophy is not there it is difficult to say that whether there is atrial hypertrophy or not let us look for ventricular hypertrophy let's look at V one and v two the r wave is positively reflected the QRS complexes are positively deflected which is not normal and the r wave is bigger than the H wave so there is a right ventricular hypertrophy in the ccg now let's complete the Rhythm interpretation so it is a sinus rhythm at the rate of 60 beats per minute with poor R wave progression right Axis deviation with right ventricular hypertrophy this is the beauty of six second method if you have been following my previous videos we have discussed each one of these things and by this six step method where you look at the general impression in the Second Step you look at the calibration the third step Rhythm interpretation four step QRS assessment fifth step hypertrophy and sixth step we will discuss in the coming videos the ischemia assessment but this six step method you never miss out a single finding in ACG if you liked my video please click on the Subscribe button in this video we talked about what is right ventricular hypertrophy how to calculate right ventricular hypertrophy what is the exclusion criteria the causes of right ventricular hypertrophy and at the end we solve different ECGs if you liked my video please click on the Subscribe button and check out my other videos on ECG interpretation Made Easy by six step method the link of those videos is given in the description below thank you very much
Up Next

6:49
Social Model of Health Explained: Sociology & Public Health
@5minutesociology323
11.6K views•2020-07-24

48:47
Graphic Medicine: Comics for Collaborative Healthcare Communication
@nationalpatientadvocate
189 views•2023-12-04

26:57
ECG Interpretation Made Easy: 12-Lead EKG Basics
@MedNerdDrWaqasFazal
1.1M views•2023-02-04
3:05
Stages of Labor and Vaginal Birth | Childbirth Animation
@nucleusmedicalmedia
52.1M views•2017-08-18
Related Study Plans & Knowledge Roadmaps
Structured learning paths in Medicine
medicine
Abnormal LFTs: Diagnostic Workup & Pathology
01Liver Anatomy and Basic Physiology
02Introduction to Liver Function Tests (LFTs)
03Hepatocellular vs. Cholestatic Patterns
+ 3 more learning modules
12h6 modules
Explore Roadmap
medicine
Analyzing Blood Smears: RBC, WBC & Platelets
01Introduction to Blood Components & Smear Preparation
02Normal Morphology of Blood Cells
03Erythrocyte Pathologies & Morphological Variants
+ 2 more learning modules
12h5 modules
Explore Roadmap
medicine
Mechanical Ventilation: Waveforms & Alarms
01Anatomy and Physiology of Breathing
02Introduction to Mechanical Ventilation & Core Modes
03Ventilator Settings and Waveform Interpretation
+ 2 more learning modules
12h5 modules
Explore Roadmap
medicine
Neuro Exam: Localization & Stroke Syndromes
01Foundations of Neuroanatomy and Vascular Supply
02The Neurological Examination: Step-by-Step
03Principles of Neurological Localization
+ 3 more learning modules
18h6 modules
Explore Roadmap