










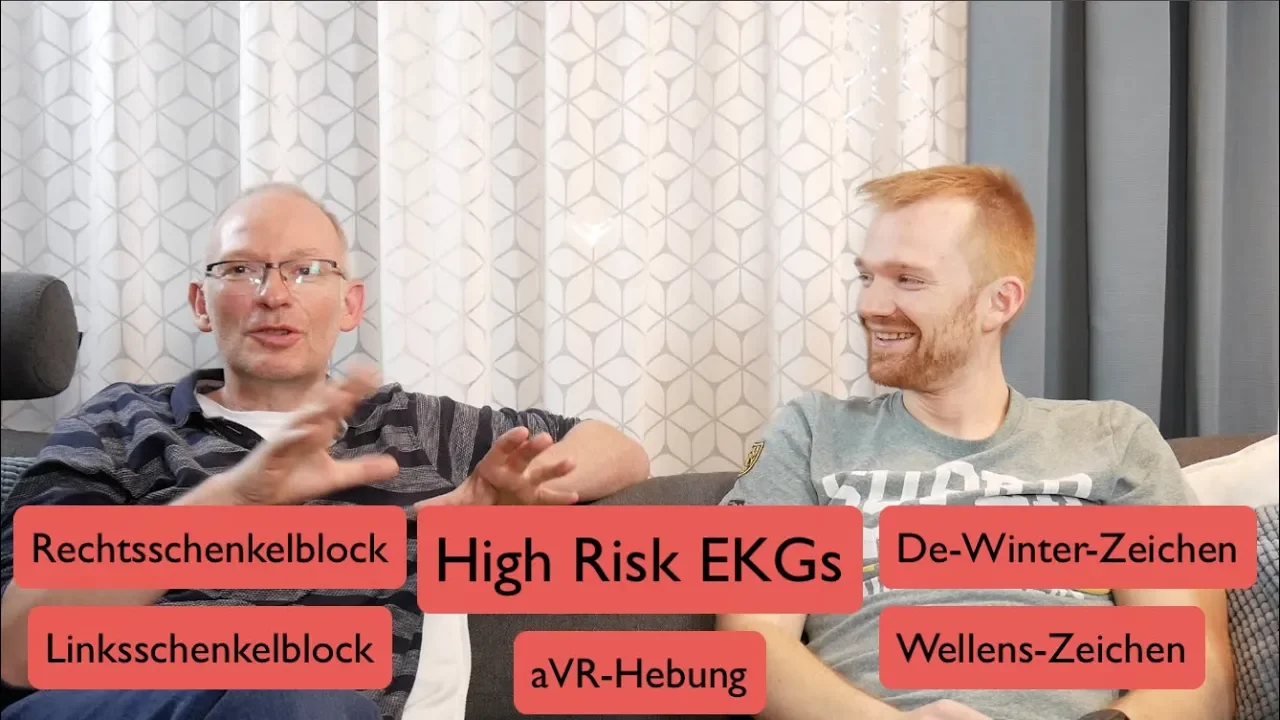







STEMI is diagnosed by ST elevation ≥1mm at the J point in at least two contiguous leads (≥2.5mm in males, ≥1.5mm in females for V2-V3), while NSTEMI shows ST depressions ≥0.5mm or T-wave inversions ≥1mm in two contiguous leads; however, ECG can be normal in 7-10% of MI cases, and serial ECGs are essential since ischemia is dynamic, and clinicians must consider hidden STEMI patterns like De Winter's pattern or left main occlusion presenting with ST depressions.
ECG Diagnosis of Cardiac Ischemia: STEMI and NSTEMI Explained
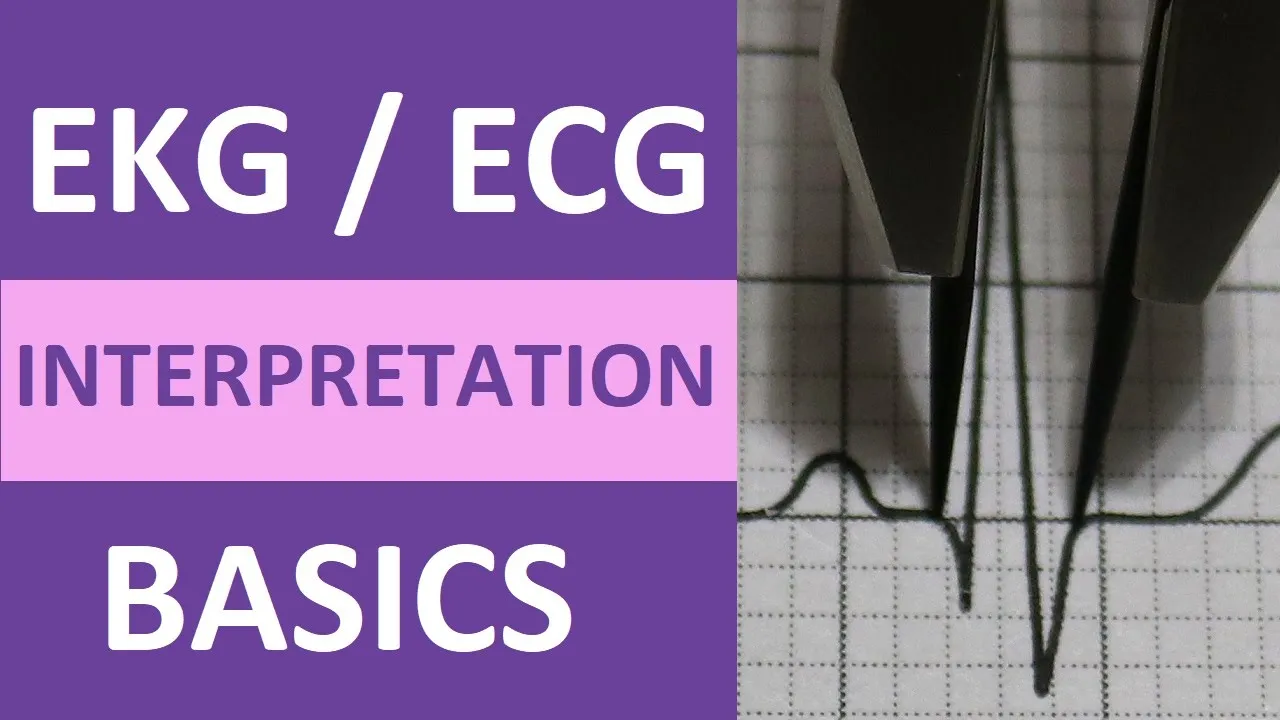
Added:Basic ECG waveform anatomy, including the identification of P waves, QRS complexes, T waves, and the baseline TP segment.
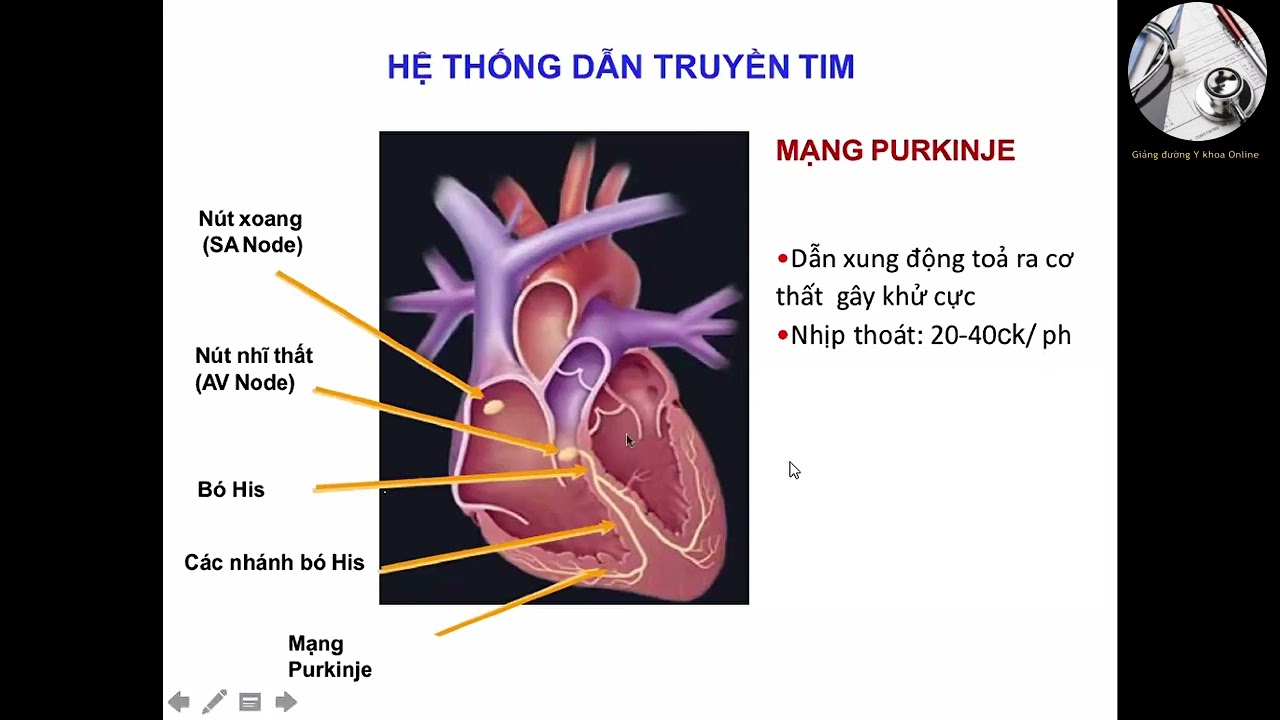
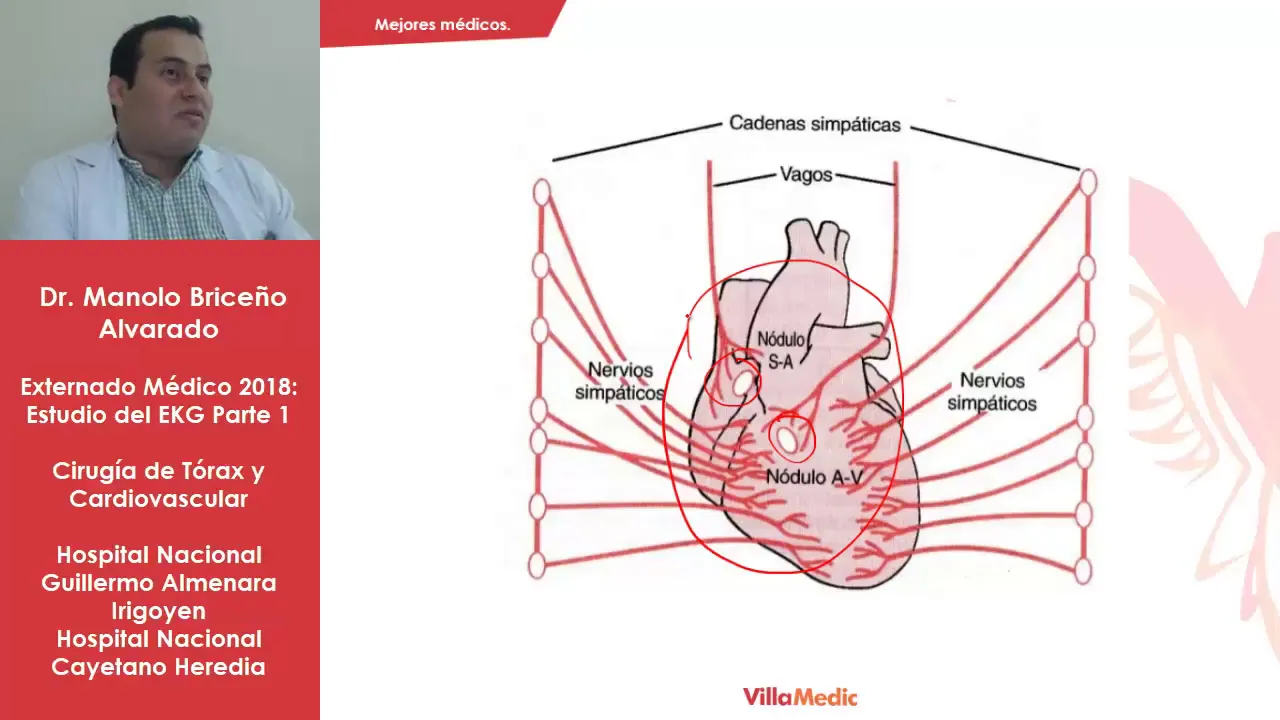
Fundamentals of cardiac electrophysiology, specifically myocardial depolarization and repolarization processes.
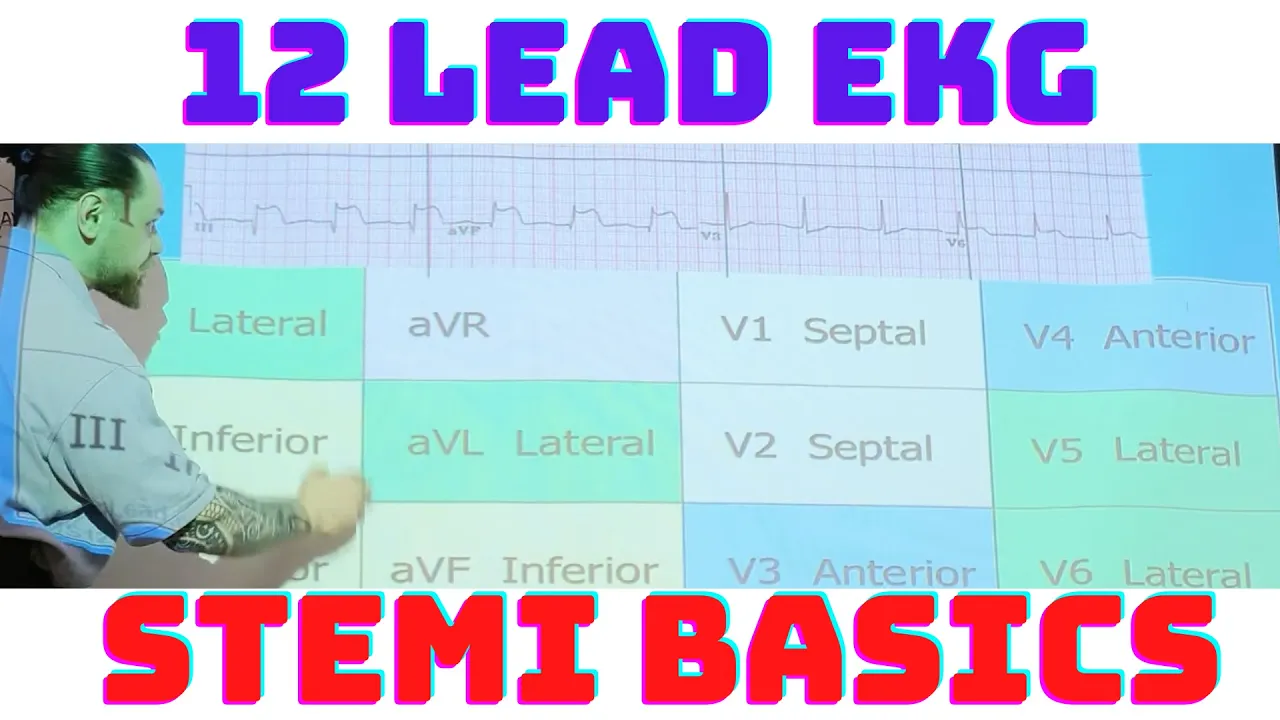
The standard 12-lead ECG layout and lead anatomy, specifically which leads correspond to the inferior, lateral, anterior, and septal walls of the heart.
The basic pathophysiology of coronary artery disease, including the concepts of myocardial ischemia, injury, and infarction.
Identifying STEMI equivalents and subtle coronary occlusion patterns, such as Wellens' syndrome, de Winter T waves, and Sgarbossa criteria in the presence of LBBB.
Differentiating ischemic ST-elevation from non-ischemic STEMI mimics, including acute pericarditis, benign early repolarization, and Left Ventricular Hypertrophy (LVH).
Predicting the specific culprit coronary artery (e.g., Left Anterior Descending, Right Coronary, or Left Circumflex) based on the distribution of ECG changes.
Clinical decision-making and reperfusion strategies, such as determining indications and timeframes for emergent Percutaneous Coronary Intervention (PCI) versus thrombolysis.
3.2K views148likes14:36Original Release: 2022-01-25
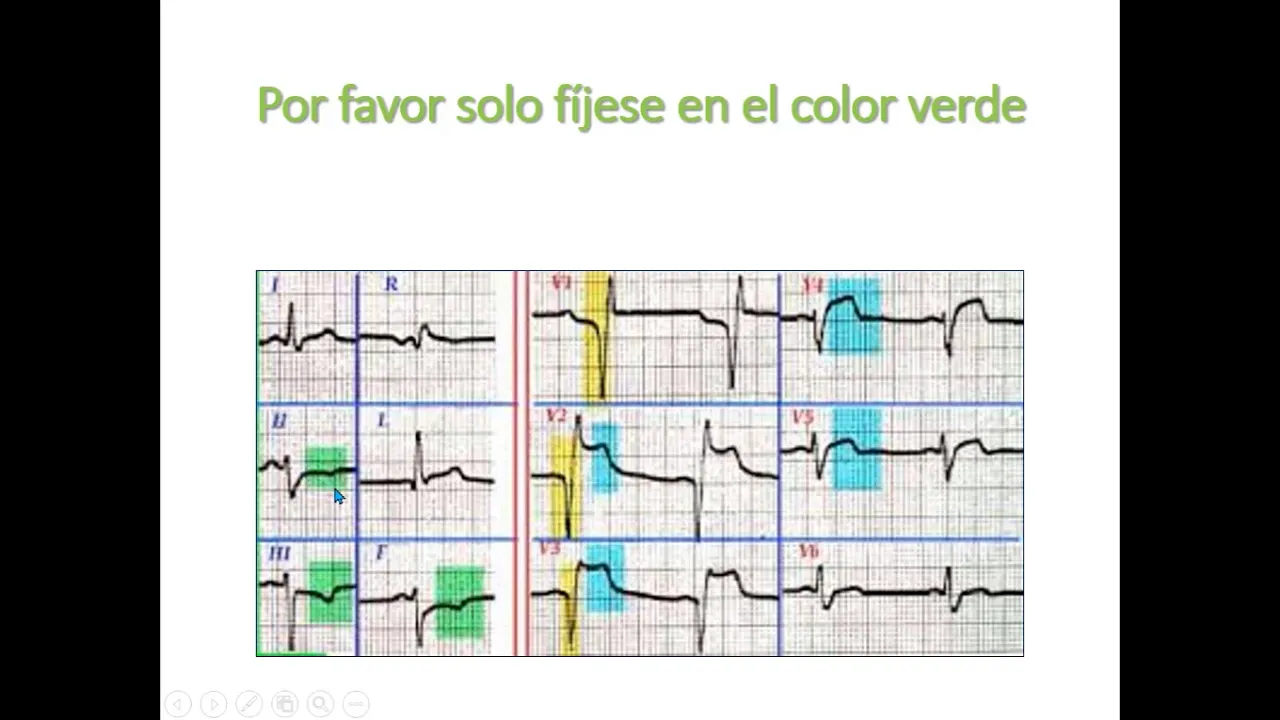
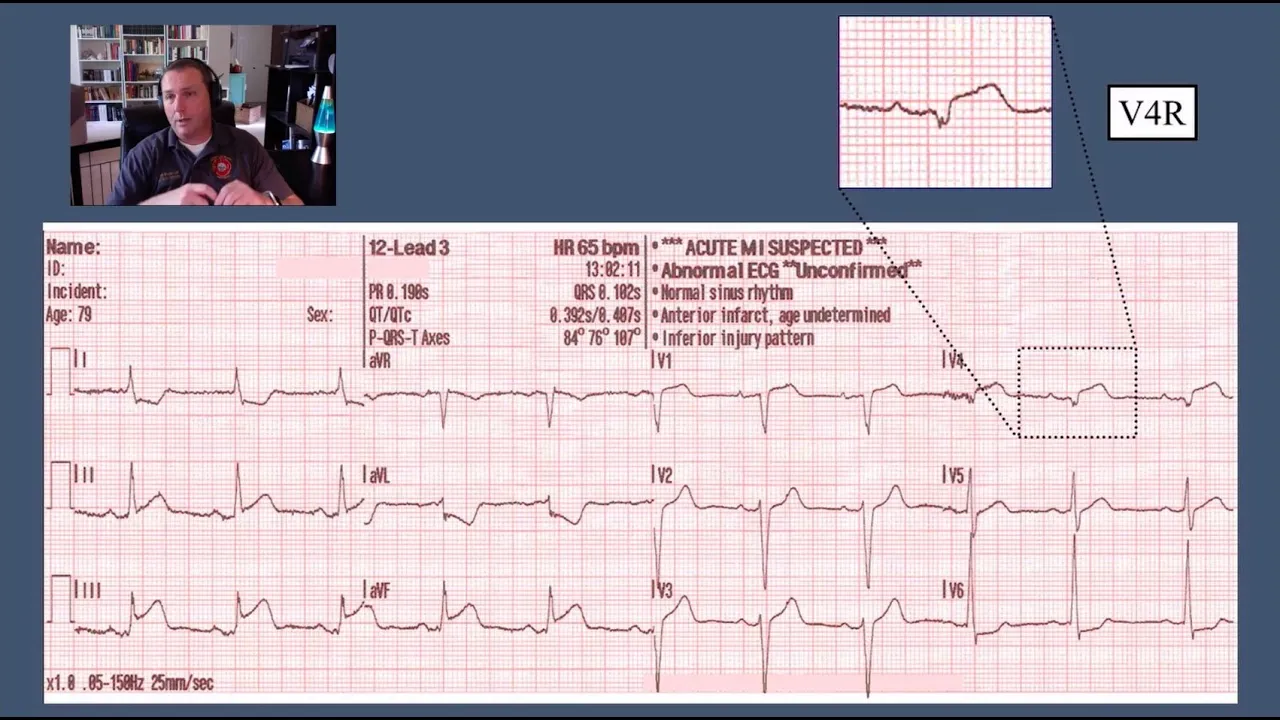
how is myocardial ischemia actually diagnosed in a 12 year dcg we'll understand in this particular video [Music] welcome to another session on ecg sadhna in the previous session we have discussed about the electrophysiologic mechanisms of generation of externations stdepressions the development of q waves all of which are findings in cardiac ischemia if you have not watched that video yet i would suggest that you watch that video after this particular one in this particular video we are going to discuss from the clinician's perspective how exactly can you pick up cardiac ischemia i am dr naman agarwal let's get started a very important concept for you to understand is that whenever you are interpreting ecg in an emergency settings always see the clinical picture first so if the patient presents to you with sufficient suggestive cardiac ischemia and you see some diagnostic criteria on the ecg then is the point where you diagnose estimation myocardial infarction so what are these criteria for the diagnosis of est elevation myocardial infarction you should have an est elevation add the j point which is at least one millimeter in at least two contiguous leaves so there are three or four different things which you need to understand so first of all what is the j point the point where the qrs complex ends is called the j point the st elevation is measured at the j point so you measure the estimation from the ecg's baseline and the ecg's baseline is the tp segment so if this is the t wave and here if you assume that there is a p wave here from the next complex this is the tp segment if you extrapolate this segment to the j point you see that the j point is slightly elevated above the baseline so you measure the distance from the tp segment to the amount of estimations at j point and if you find that it is at least one millimeter that means that that's abnormal now these extra elevations should be seen in at least two contiguous leads now we have discussed about the orientation of the chest leads in the limb leads in a previous video do check the link in the description below so if you find that the s t elevation at j point in two contiguous leads is at least one millimeter in a clinical setting of cardiac ischemia you should think about an s t elevation myocardial infarction this criteria for one millimeter does not apply in lead v2 and v3 because some amount of escalation is actually normal in these two leads so a higher threshold is required for abnormality so if you find that the escalations are at least 2.5 millimeters in males of certain age or if it is more than 1.5 millimeters in females then you diagnose it as stemi so this is how you diagnose est elevation uh myocardial infarction now if you can see in the other bits this is the t wave this is the p wave somewhere here this is the tp segment which i have extrapolated you see this is the point where the qrs complex has ended and the hence this is the j point you can see that there is a significant st elevation here next example now you can see here that the baseline probably is not linear in such cases we can roughly consider the pr segment as the baseline and if this is the baseline this is the point where the qrs complex ends so this is the j point and you can see these massive estimations so this is the tombstoning pattern of estimation so all these are examples of st elevation myocardial infarction now another finding in ecg for diagnosis stemi is reciprocalst depressions whenever you have a doubt that this estimation is because of stemi or some other cause this is very suggestive of the possibility of stemi another thing sometimes the reciprocal stdepressions actually precede the development of st elevations so you may not find significant distillations yet because the clinical course is evolving but you may find reciprocal depressions which are very very prominent and hence these can help you in suspecting myocardial infarction another thing sometimes the amount of stdepressions actually helps you in seeing that how much area of myocardium is at risk for example if it is a left anterior descending occlusion if the st depressions in inferior leads are more than one millimeter it is suggestive of a proximal led occlusion which means that more of the myocardium more of the left ventricle is at risk of cardiac ischemia and infection now if we see still evasions in a set of chest leads or limb leaves we can localize that which area of the heart is actually affected by the ischemia so if we see estimations in v2 v3 v4 more importantly v3 v4 we mean that there is an anterior wall ischemia which is ongoing if we see est elevations in v1 v2 which is facing the septum if the inferior wall is got infected we see still elevations in lead 2 3 avf the lateral wall is pointed towards by v5 b6 and 1 and avl and corresponding to these there are some reciprocal leads which means that you will find reciprocal sd depressions in lead 2 3 and avf in case of an anterior stemming if you find distillations in 2 3 avf in an inferior wall stemming you are very likely to find s2 depressions indeed 1 avl v2v3 which are the reciprocal leads to the inferior lead now as you can see there are no leads which are placed posteriorly so there is no acg lead which can directly look at the posterior wall of the heart so you can see that facing leads are none however we can place some extra leads beyond v6 that is v7 v8 v9 which can actually look at the est elevations in the posterior wall even a 0.5 millimeter est elevation in the posterior leads is enough for the diagnosis of posterior voramine however in a standard 12 edcg you will see that v1 and v2 are placed anteriorly so these become the reciprocal leads of posterior one if you see st depression in v1 and v2 you should have a high index of suspicion for the diagnosis of posterior wall myocardial infarction similarly the right ventricle is not directly represented by the set of the 12 leads which we obtain in the ecg but if you find if but if you obtain additional right sided chest leads v4r is considered the most specific lead for the diagnosis of right ventricular micro infection now this is an example of the patient who presented to the emergency with chest pain of four hours duration we can see that there are significant distillations in lead v1 lead v2 lead v3 there are st depressions in lead 2 3 and avf so we can say that this patient has gotten anterior stemming and there are reciprocal st depressions in the inferior leads in the next example you can see that the st elevations are seen in the inferior leads that is knee 2 has got testilevation lead 3 has got distillation lead avf has got significant distillations which means that this is what an inferior wall stemming in addition you can see that there are st depressions in lead v1 and v2 and if you can recall the st depressions in v1 and v2 suggests the involvement of posterior wall so in addition to the inferior wall the patient also has got a posterior volumin as you can also see that there are reciprocal depressions in lead 1 and lead avn down here you can also see that we have obtained right sided lead however you don't see any st elevations in lead v4 you do see some exterior visions in lead v4 v5r and v6r so possibly the patient also has got a right ventricular myocardial infarction now this is how we diagnose stemi on the ecg but you need to understand some pearls and pitfalls the clinical context in which the ecg has been obtained and the ecg has been interpreted is very very important and the next point is that not all est elevations are myocardial infarctions there is a list of n number of conditions which can lead to estimations in the ecg though in the previous slide where we consider the diagnostic criteria it is not just the amount of estimation it's more important to recognize a particular morphology rather than just taking the callipers and measuring the amount of escalation for example consider these three ecgs what are all these myocardial infarctions actually no you can see that this the second and third ones are concave upwards estimations something like this however the exterivation here is more straight up rather than concave this is an estee elevation of myocardial infarction that is stemi this is an example taken where the patient had acute pericarditis and this is an ecg of a patient with early repolarization syndrome despite the fact that the estimation is minimal in the first example this is the estimation you should not miss the morphology is very different so in addition to the amount of estimation on the ecg the focus should be more on the morphology though we discussed in the previous video that a complete occlusion of the coronary artery leads to st elevation myocardial infarction but that is not always true there are many conditions in which a complete occlusion causing myocardial infarction that is called the occlusion mi may present without an estimation last but not the least an ecg can be normal in myocardial infarction in up to seven to ten percent of the cases and hence serial ecg's are very important myocardial ischemia is a dynamic condition so if you obtain an ecg right now and you find that this is not diagnostic but you have got a high index of suspicion based on the clinical presentation again you should actually repeat the ecg after some time so if any of this happens if the chest pain of the patient worsens if the chest pain of the patient improves if you see that there is an overall clinical worsening do repeat the ecg many times the first tcg is not the one which picks up myocardial infarction it's the subsequent tcgs which pick up the stemi talking about some other ecg changes we have discussed that q waves are an important ecg manifestation of acute cone syndrome to make it simple for you guys any amount of q wave is normal in lead 3 and lead avr but if you find that the q wave is present in any other lead and it is at least one millimeter wide it is pathological now these q waves usually develop some hours to days after the development of an occlusion marker infection but mind you again this is not the rule and sometimes the q waves can be seen as early as 30 minutes after the coronary occlusion so the presence of q waves do not mean that the infection is completed and this is not the indication to withhold a particular reperfusion therapy now the t waves can have various morphologies there could be hyper acute t waves there could be re-perfusion t waves i'll probably have a different video discussing about the various killer tea waves in the emergency department now a word about non-establishing myocardial infarction this happens because of an incomplete coronary artery occlusion and which leads to subendocardial ischemia so typically the description is a down sloping or a horizontal s depression of at least 0.5 millimeters again in two continuous leads or if there are t-wave inversions there should be at least one millimeter deep but mind you it's more important to focus on the morphology rather than on the values and the measurements another important finding is that there should not be any sustained sd elevations in ecg for the diagnosis of endsteming transient estimations however can still be noted in these patients perhaps the most important bit whenever you're diagnosing a non-estillation equine syndrome is to beware of hidden stemies sometimes the est elevations may be hidden or they may not be present at all and there are prominent testy depressions either reciprocally or otherwise and hence you diagnose these patients as enzymy but unfortunately they are occlusion marker infection so you have to be aware of these conditions some of the examples include an isolated posterior wall micro infection an early inferior stemi where the est elevations in the inferior leaves has not yet come but you find profound stdepressions in avl lead 1 lead v2 v3 etc in the left main coronary artery occlusion you may not see any accelerations if you miss seeing the lead avr avr could be the only lead where you find st elevation rest all the 11 leads you'll find sk depressions so there are profound std depressions but actually this is not a non-stemi this is because of an occlusion myocardial infarction of the left main coronary and these patients have a very high risk of mortality and going into cardiogenic shock now sometimes the patients with acute coronary syndrome present very early and you find a pattern which is something like this there is a prominent r wave then there is an s3 depression followed by a prominent t wave this stdepression is actually up sloping rather than horizontal or down sloping this is what is called the divinter's pattern t waves and these are suggestive often acute led occlusion now you also have to be aware of some mimics of non-stemi and these could be a massive pulmonary embolism or a significant aortic dissection these can lead to significant ester depressions in the presence of chest pain so you may falsely diagnose these conditions as non-stemi let's see this example once this patient presented to the emergency with some typical ischemic sounding chest pain you really don't see any significant escalations anywhere however you see that there is a t-women version and an st depression in lead avl is this n-stemi actually not if you focus more carefully in lead 3 there is a slight st elevation at the j point though this may not meet the diagnostic criteria of one millimeter as per the guidelines but this morphology is slightly concerning presence of this s3 depression and tv version in the lead avl is very subtle early indicator that the patient can actually have an inferior wall stemming uh once we repeated the ecg on this particular patient we had full blown escalations in the inferior leads with complete heart block so this is a very crucial example for you to understand that whenever in the setting of cardiac ischemia you see st depressions not all stdepressions are non-stemi first step is to actually look out if this could be a stemi i hope that today's video about the discussion of diagnosis of stemi and non-stemi was informative if you liked the video do hit the like button do subscribe to the ecg sadhna channel for more such interesting discussions on cases concepts and challenges about emergency ecgs i hope to see you in the next video until then stay healthy and keep saving lives
Up Next
2:51
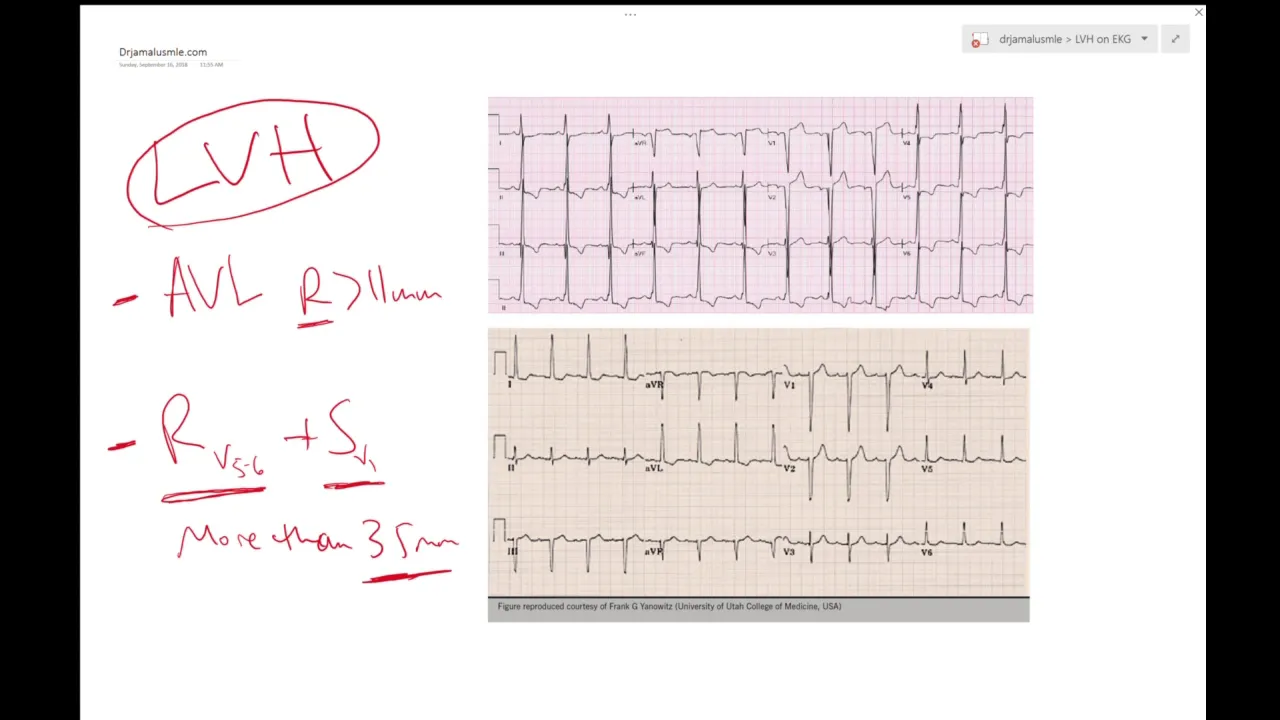
Left Ventricular Hypertrophy on ECG: ECG Diagnosis Explained
@drjamalsusmlenotesandmatch6200
145.1K views•2018-10-02

48:47
Graphic Medicine: Comics for Collaborative Healthcare Communication
@nationalpatientadvocate
189 views•2023-12-04

10:28
Neuroanatomy: Central and Peripheral Nervous System Divisions Explained
@AKLECTURES
136.2K views•2014-09-20
3:05
Stages of Labor and Vaginal Birth | Childbirth Animation
@nucleusmedicalmedia
52.1M views•2017-08-18
Related Study Plans & Knowledge Roadmaps
Structured learning paths in Medicine
medicine
Abnormal LFTs: Diagnostic Workup & Pathology
01Liver Anatomy and Basic Physiology
02Introduction to Liver Function Tests (LFTs)
03Hepatocellular vs. Cholestatic Patterns
+ 3 more learning modules
12h6 modules
Explore Roadmap
medicine
Analyzing Blood Smears: RBC, WBC & Platelets
01Introduction to Blood Components & Smear Preparation
02Normal Morphology of Blood Cells
03Erythrocyte Pathologies & Morphological Variants
+ 2 more learning modules
12h5 modules
Explore Roadmap
medicine
Mechanical Ventilation: Waveforms & Alarms
01Anatomy and Physiology of Breathing
02Introduction to Mechanical Ventilation & Core Modes
03Ventilator Settings and Waveform Interpretation
+ 2 more learning modules
12h5 modules
Explore Roadmap
medicine
Neuro Exam: Localization & Stroke Syndromes
01Foundations of Neuroanatomy and Vascular Supply
02The Neurological Examination: Step-by-Step
03Principles of Neurological Localization
+ 3 more learning modules
18h6 modules
Explore Roadmap