
















![(M5E9) [Microeconomics] First Order Stochastic Dominance: Definition](https://i.ytimg.com/vi/WLZEXm5cUIA/hqdefault.jpg)




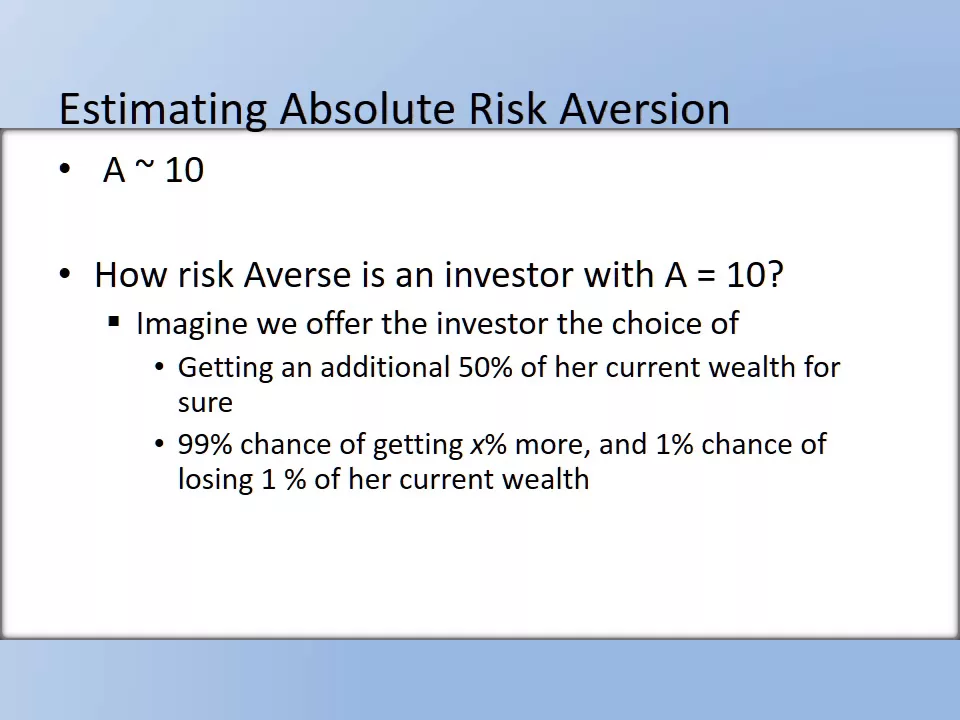



Risk aversion occurs when individuals prefer a certain outcome over a gamble with the same expected value; this behavior arises from diminishing marginal utility of money, where each additional dollar provides less additional satisfaction. Economists measure risk aversion using the Arrow-Pratt measure of absolute risk aversion, which is the ratio of the negative second derivative to the first derivative of the utility function. People use insurance to transfer risk because it removes uncertainty and increases their expected utility, with the amount they're willing to pay for insurance reflecting their degree of risk aversion.
Risk Aversion & Expected Utility: Insurance & Arrow-Pratt Measures
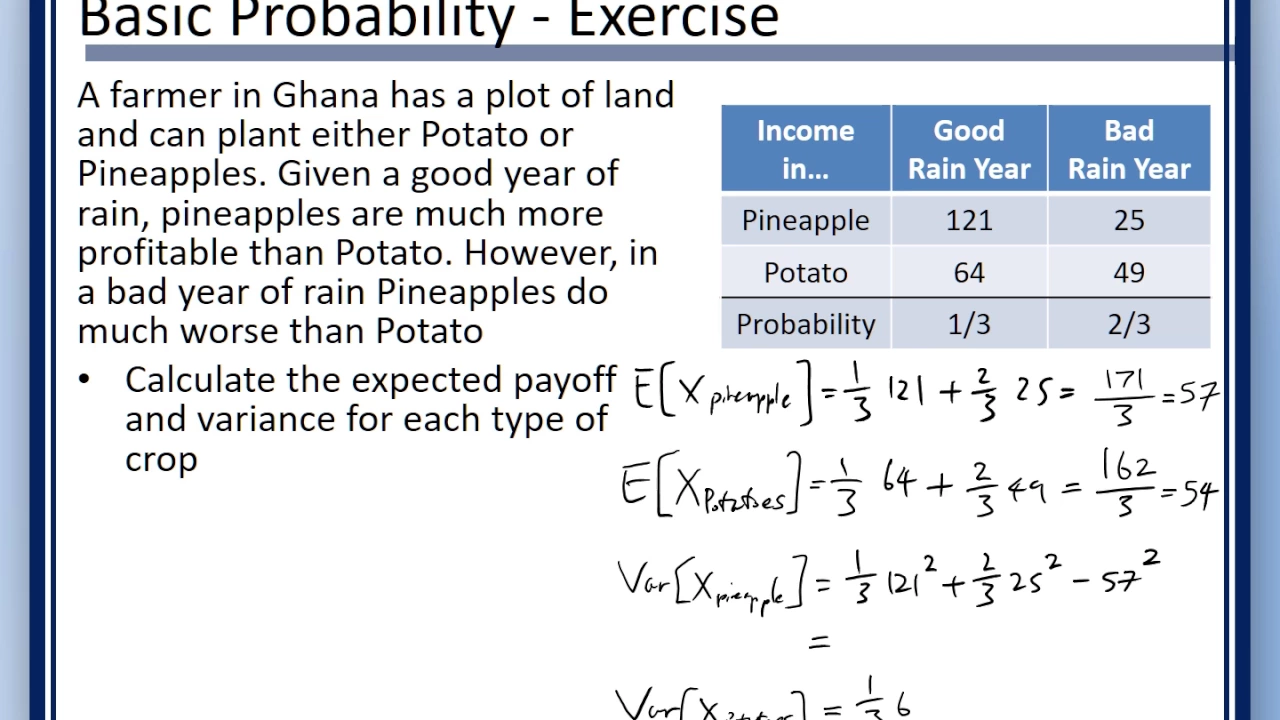
Added:Basic Probability Theory: Mastery of random variables, expected values, probability distributions, and variance.
Microeconomic Consumer Theory: Understanding of utility functions, marginal utility, and the concept of diminishing marginal utility.
Differential Calculus: Ability to calculate first and second derivatives of functions, which is essential for understanding curvature and concavity.
Introduction to Choice Under Uncertainty: Familiarity with the concept of a 'lottery' or risky prospect and the expected value criterion.
Portfolio Selection Theory: Applying risk preferences to optimal asset allocation and wealth diversification (e.g., Mean-Variance Analysis).
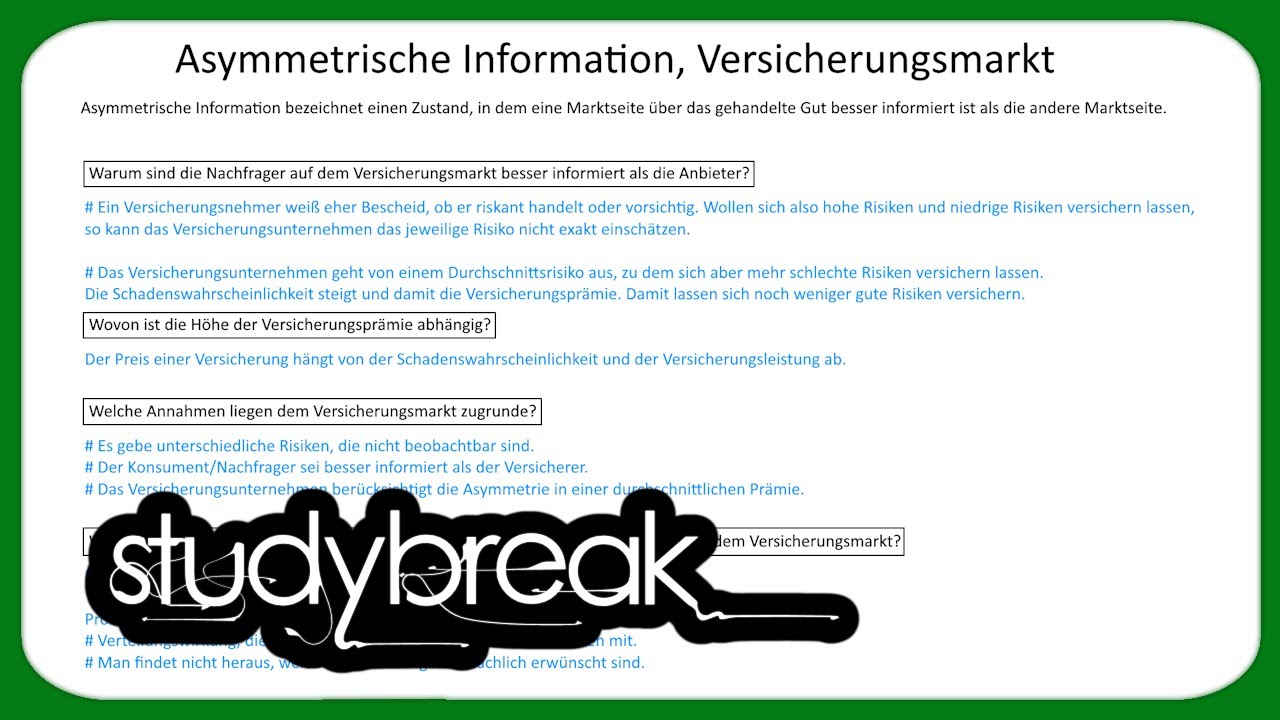
Asymmetric Information in Insurance Markets: Exploring how adverse selection and moral hazard disrupt classical insurance models.
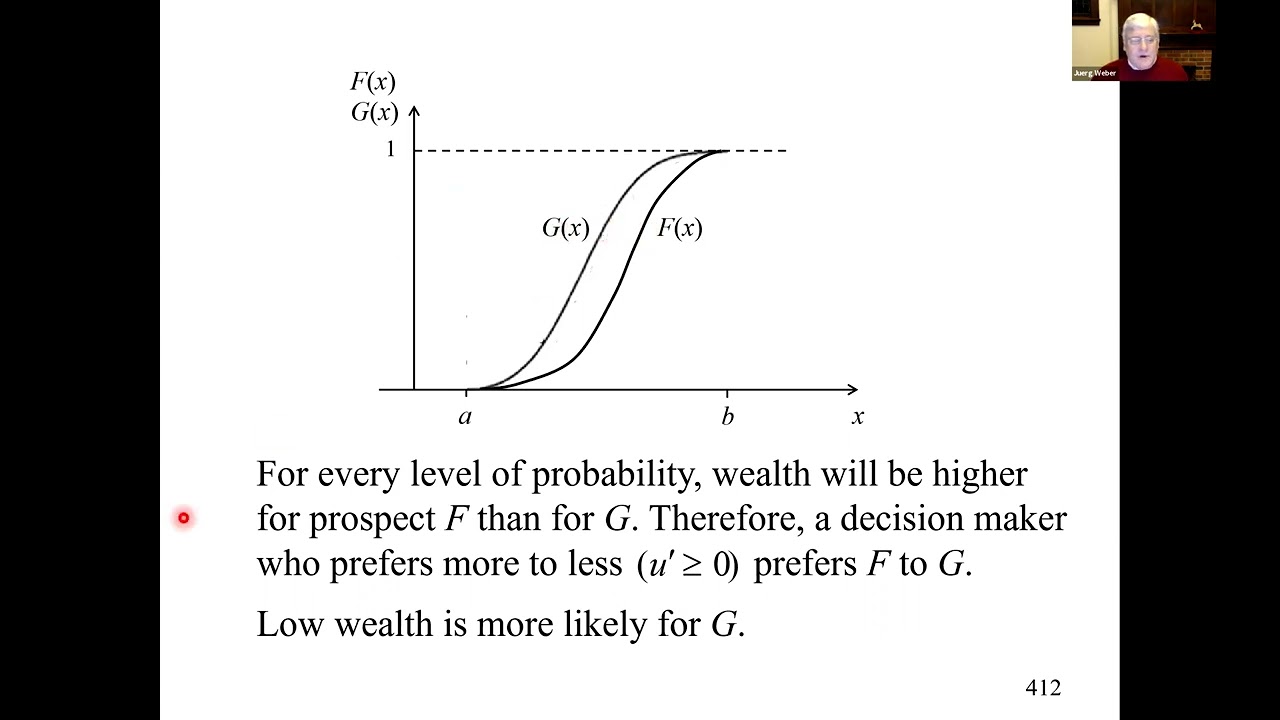
Stochastic Dominance: Learning advanced methods (First and Second-Order Stochastic Dominance) to compare risky prospects without assuming specific utility functions.
Behavioral Economics and Prospect Theory: Examining critiques of Expected Utility Theory, including loss aversion and reference-dependent preferences.
158.3K views2Klikes21:45Original Release: 2017-11-24
[Music] in this video we're going to talk about the idea of risk aversion and we're not going to go too deep into it but we will talk about some of the technical details at the end like how can you measure the degree of risk aversion that someone has but we won't go down that rabbit hole too far but what is risk aversion well suppose you were given two choices and you had to choose whether you liked choice a or choice B better so choice a is $70 they're just going to hand you $70 and you can put it in your pocket and walk away choice B they're gonna give you a 70% chance of winning $100 and a 30% chance of getting nothing which of those two would you prefer $70 in your pocket for sure or a gamble where you might win a hundred and you might win zero well an important idea here is the expected value basic idea from statistics where we calculate in the long run if we were to take a probabilistic or randomly generated outcome over the long run and we were to do it many many many times on average what would the value of this random gamble be the way you do it is you just sum the probabilities times the outcome and then add them all up so probability times the outcome so here we have 70 percent or 0.7 times 100 plus 0.3 times zero and so the expected value the long-run average of playing this kind of random gamble in choice B would be $70 the same amount that you could just put in your pocket so we say that you are risk averse if you would prefer choice a because there's no gambling involved you're just getting the $70 or sure with no risk at all we say that your risk loving if you prefer option B the same expected value as option A but there's a small chance you might get actually a pretty good chance in this case that you might get and a chance you might get a lower amount so you prefer the risk instead of a certainty you would rather have that chance of getting a higher amount even if there is a chance of getting a lower amount or zero in this case and we say that you are risk neutral if you are indifferent between these two options getting the $70 guaranteed or having a gamble that has a $70 expected value the risk doesn't bother you and it doesn't thrill you either so one interesting thing is that we can actually measure if someone's risk-averse we can get at some way to quantify how risk-averse this person is by figuring out okay you said here that you would rather have $70 with certainty instead of taking a gamble that has an expected value of $70 understandable let's try to figure out how risk-averse someone actually is we can do that by adding money to the expected value so by asking questions of somebody we could say well how much do we have to add to the expected value of this gamble before you're going to be indifferent between the two choices still we're going to keep it $70 guaranteed as the choice a but then choice B we might change it to where now there's a 70% chance of 105 dollars and a 30% chance of $0 the expected value now when we add in that $5 in there is going to make the expected value now seventy-three dollars and fifty cents is that enough to make a person indifferent maybe so maybe not the higher and higher and higher we have to increase this expected value before the person says well now I'm thinking about taking the gamble that's one way to try to assess to quantify how risk-averse someone is now why might somebody be risk averse to begin with well the main reason comes from the standard assumption that you hear in most microeconomics classrooms that we assume that people have finishing our gional utility that is the additional utility of money or goods gets lower and lower and lower as you have more and more and more money or more and more and more of a particular good looking at a utility function that has diminishing marginal utility very simple one would be what if utility equals the amount of money you have to the point five power or you equals the square root of M the amount of money you have here's a graph of it over on the right marginal utility the additional utility you get for one more dollar is seen is visualized and calculated by the slope so the slope would be the first derivative or the slope of a tangent line at a point anywhere on the graph and we see as this goes on that the slope starts off pretty steep it's a little flatter and as we go on gets flatter and flatter and flatter still so this is an indication of Domitian marginal utility so when we talk about a utility function and how much happiness how much utility is someone going to get out of a gamble what we do is we calculate the utility for the gamble and calculate the expected value of the utility kind of like we do here with the expected value in terms of this money we sum up the probability times instead of the values of the money we we would put in the utility here all right what we do is to get the expected utility we take the probability point seven times the square root of the money you get in that case there's a 70% chance that you get $100 so that utility is going to be point seven times the square root of 100 which is just going to be seven point seven times ten plus the other 30% chance that you get zero well that's just going to be zero so we end up with your expected utility is seven plus zero is seven utils now let's compare that to for this person who is risk averse they would have chosen option a they would have chosen to have the seventy dollars in their hand with no risk how much utility would that give them well there we just plug the seventy dollars into the utility function because they're getting it for sure and that gives us eight point three six seven square root of 70 so it's pretty obvious now that the gamble gives them seven happiness and the seventy dollars for sure gives them more happiness higher utility now let's visualize this on this graph here let me zoom into the graph let me show you a couple of tricks that we can use to help us visualize what's going on here let's identify the Gamble's so the two Gamble's we're talking about here are one outcome is 0 the other outcome is that we've been a hundred dollars over here try to straight up from there okay and we see that the utility of the hundred dollars is ten all right when we get that seventy percent of the time and the utility of zero dollars is zero of course now whatever you're trying to visualize what is the utility of a gamble a little trick we use is to take the utility function and then draw a straight line between the two points of the gamble so if you have a more complicated gamble than just two outcomes it's not gonna work as easily here but if you just have two outcomes this makes it pretty easy so let me connect these points with a straight line so what this line represents is all of the linear combinations of these two values one hundred and zero a linear combination all we mean is a weighted average kind of like an expected value and how close we are to the 100 over here depends on how highly likely or what is the probability that we get a hundred compared to what is the probability that we get to zero here is $70 the expected value that we calculate and so if we go straight up now we can see what's going on at $70 and you see we're a little bit closer to a hundred here because there's a 70% chance that we get a hundred now let's look at these two points here one is on the little blue line which is true and the other is on the utility function the Green Dot here tells us the utility of getting seventy dollars and over here we see that eight point three seven utility that we were looking at before whereas the utility of the gamble we can see utility that gamble is going to be much less so let me draw a straight lines we can visualize that more easily and so there we see that expected value of seven for a gamble so how far this point is below this point is going to be that measure that I was telling you about of how risk-averse this person is so the further this blue line is below the utility curve the larger the difference between the expected utility of a gamble and the utility of getting that same amount of money for certain to sum up if there's some way we can remove the risks from the gamble this person would be happier on the other hand adding risk makes this person less happy when they are risk-averse so this partly explains why people use insurance companies insurance companies remove some of the risk from life so if your house burns down you're gonna suffer a big loss but you're not certain you're gonna have your house burned down if you could pay some money to someone that would reduce your income with certainty but then there's a chance that if you get the bad outcome someone will step in and fix your house for you rebuild your house so in this case an interesting question would be okay well this person will be able to buy an insurance policy they'd be willing to pay some money in order to remove this risk how much would they be willing to pay well where we would look on the graph here to see this is to trace this black line over here and what we're looking for is this point this point tells us we look down how much income is the gamble worth so how much income with certainty is this gamble worth and in order to solve this problem here's what we do we say well the utility from the gamble is seven and if I was getting that utility with certainty how much money would give me since the utility function is just the square root of them how much money would I need to get a utility of seven if there weren't any uncertainty going on oh well that's easy to see that amount of money square both sides is equal to 49 so this person really values this gamble at $49 if they could remove the uncertainty now if you're an insurance company and you're insuring a lot of people with a lot of different Gamble's then some of those Gamble's will work out in the favor of the insurance company and some of those Gamble's won't work out in the favor of the insurance company but if you have enough people insured then the insurer can act as if they are risk neutral because they're going to be looking at the long-run average value of this gamble or the $70 one simple way to think about this is since the gamble is worth forty nine dollars this person would be willing to pay some money in order to get their utility higher so let's suppose that there was an insurance company out there who approached this person and said hey I see you have this gamble and this gamble has an expected value of $70 how about we take that gamble off your hands in exchange for taking the gamble off of your hands we will pay you $64 or this gamble that's gonna give you a utility of eight right so this person is going to be much happier with the sixty four dollars for sure they'll have a utility of eight instead of only seven but in exchange what's the insurance company getting well they're taking a lot of people's Gamble's and on average they're going to be getting seventy dollars in income for each of these Gamble's and they're only paying $64 out in claims so the insurance company gets to keep the other six dollars so getting a little bit more into the details here I'm not going to go too deep just to let you know that the amount of risk aversion is really related to the curvature of the utility function as we said a minute ago when you're looking at this but just between point like this is telling you how much disutility this person is getting from the gamble so a way to get more distance between the line of the gamble and the curve is to make it more curvy so let me draw a line here with a gamble on it so this black line would represent the gamble and let's suppose we were just looking at say a gamble where you had a fifty percent chance of getting $100 and a fifty percent chance of getting zero dollars the expected value of that gamble would be $50 here is the expected utility for both of these curves because I chose them here are the two functions that give us these but I chose them so that they pretty closely matched up here at the utility of a hundred but we can tell that the blue curve this person is a little bit more risk-averse than the red one the red one is the same one we were looking at before the square root of M but we can tell that the blue person is a little bit more risk-averse even though the expected utility of this particular gamble is the same the person with a blue utility function would be willing to pay more to get rid of this gamble than the person with the red because there's a much higher distance between those two curves interesting result so how can we measure curvature well there are a lot of different ways that you can talk about measuring the curvature of something mathematically let me show you a couple of ways that economists have talked about doing this one of the common ways is using the arrow pressure of absolute risk aversion there are other related measures we're just going to talk about this one and the arab prat measure says look at the ratio of the second derivative of the utility function divided by the first derivative with a little ol minus sign in front of here because we know the second derivative is going to be negative anytime you have decreasing marginal utility the second derivative tells you how the marginal utility is changing and the negative that you get tells you that you have decreasing marginal utility that the slope is getting smaller and smaller so the second derivative tells you if it's negative the slope is getting smaller the TF diminishing marginal utility Marinette to the slope the first derivative here is one way to measure curvature so the higher this value of absolute risk aversion the more curvature to the curve and when you do this for these two functions the red one the second derivative on the top here divided by the first derivative on the bottom with the obligatory negative sign to make it positive you get 0.5 over m 0.5 over m tells you look the risk aversion gets smaller as your income gets higher which is another way of saying that this red curve curvy as income gets higher and we can see that it's very curvy down here for low values of income and it's pretty straight here we get to higher values of info the blue one very similarly for higher values the risk aversion is lower but overall this one is higher for the same value of income than the red one point eight over again but again looking at this one you can see that it gets straighter for higher values of M and it's certainly a lot more curvy than the red one down here at lower values of income this is one way to quantify it and there are a lot of other ways that you can quantify this and we could keep digging in this idea of risk aversion for a long long time but I'm going on in this video after one last point and that's the idea that well if diminishing marginal utility gives you risk aversion constant marginal utility means you're risk neutral and if you have an increasing slope function as we have here with you equals m to the 1.5 that would give you someone whose risk loving and what's going on here is if we draw a gamble because the shape is convex the expected utility of a gamble be higher and the utility that we would get from that same money with certainty and so that's how you get someone who is risk loving the expected value of the gamble is higher than the value of the utility someone would get with certainty why somebody be like this why might somebody have increasing marginal utility there are a lot of stories one could tell let me leave you with one brief story here suppose you needed a certain amount of money to buy some kind of surgery that was going to save your life and so low amounts of money people might give you might have very low marginal utility right so the slope down here is very low and remember slope tells you the marginal utility but as people give you higher and higher and higher amounts of money you might be getting closer and closer to that amount of money you need for that life-saving surgery and perhaps that would be some story you could tell where somebody might be risk loving where we have a higher additional utility for the higher amounts of money slip is higher than we do for lower amounts of money so if you have any questions or comments or any other stories or ideas you think might be a good one to tell for why someone might have increasing marginal utility well if you have any questions about anything else at all here that we went through please let me know and as I said before I really encourage you to download this worksheet share it with friends and give me any comments about how I can make this better this is Berkey academy signing out and as always I wish you the best of luck with all of your economic studies [Music]
Up Next

25:37
Adverse Selection in Insurance Markets: Rothschild-Stiglitz Death Spiral
@dbishai
760 views•2023-02-20

5:07
Impact of Yuan in Indo-Russian Trade Amid Sanctions
@WION
261.9K views•2022-07-01
10:33
Behavioral Economics Explained: Rationality, Nudges, and Risk
@crashcourse
1.1M views•2016-03-12

113:18
The Age of Easy Money: Fed & Inflation | Full Documentary
@frontline
21.2M views•2023-03-15
Related Study Plans & Knowledge Roadmaps
Structured learning paths in Economics
economics
Sovereign Debt: Defaults, IMF & Restructuring
01Introduction to Sovereign Debt & Government Bonds
02Debt Sustainability & Credit Ratings
03Anatomy and History of Debt Crises
+ 2 more learning modules
12h5 modules
Explore Roadmap
economics
Market Design: Matching Theory & Gale-Shapley
01Introduction to Market Design and Price-Free Markets
02Two-Sided Matching & The Gale-Shapley Algorithm
03School Choice Systems and Mechanism Design
+ 2 more learning modules
10h5 modules
Explore Roadmap
economics
Impossible Trinity: Forex, Capital & Policy
01Introduction to Monetary Policy and Central Banking
02Exchange Rates and International Capital Flows
03The Mundell-Fleming Model
+ 2 more learning modules
8h5 modules
Explore Roadmap
economics
Healthcare Economics: Market Failures & Systems
01Introduction to Healthcare Markets and Market Failure
02Asymmetric Information and Adverse Selection
03Moral Hazard and Insurance Design
+ 2 more learning modules
12h5 modules
Explore Roadmap