




















In the labor market, firms demand labor while individuals supply it; the demand curve for labor is downward sloping (DL), meaning firms hire less when wages are high, while the supply curve is upward sloping (SL), meaning workers offer more labor at higher wages; equilibrium occurs where these curves intersect, determining the equilibrium wage (w0) and quantity of labor employed (q0); when demand shifts right, both wage and employment increase, while a rightward shift in supply decreases wage but increases employment.
Supply and Demand for Labor: Market Equilibrium Explained
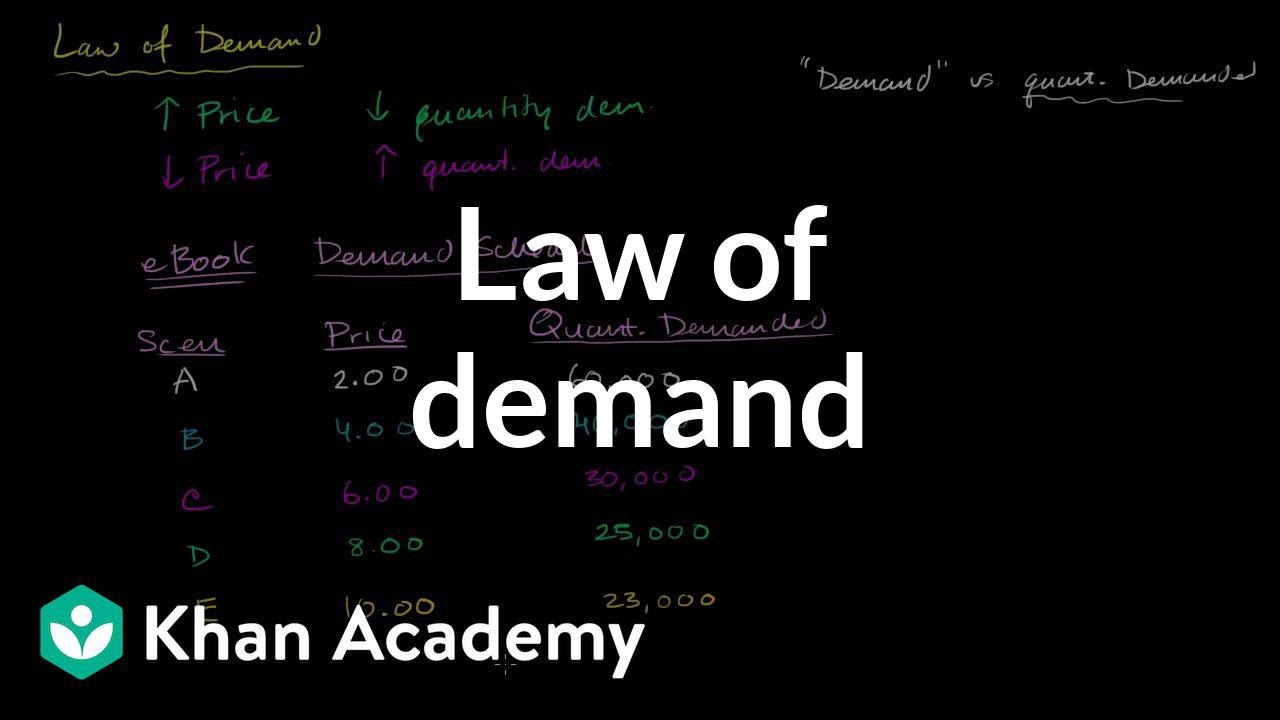
Added:Basic principles of microeconomics, specifically the law of demand, the law of supply, and how market equilibrium is established in product markets.
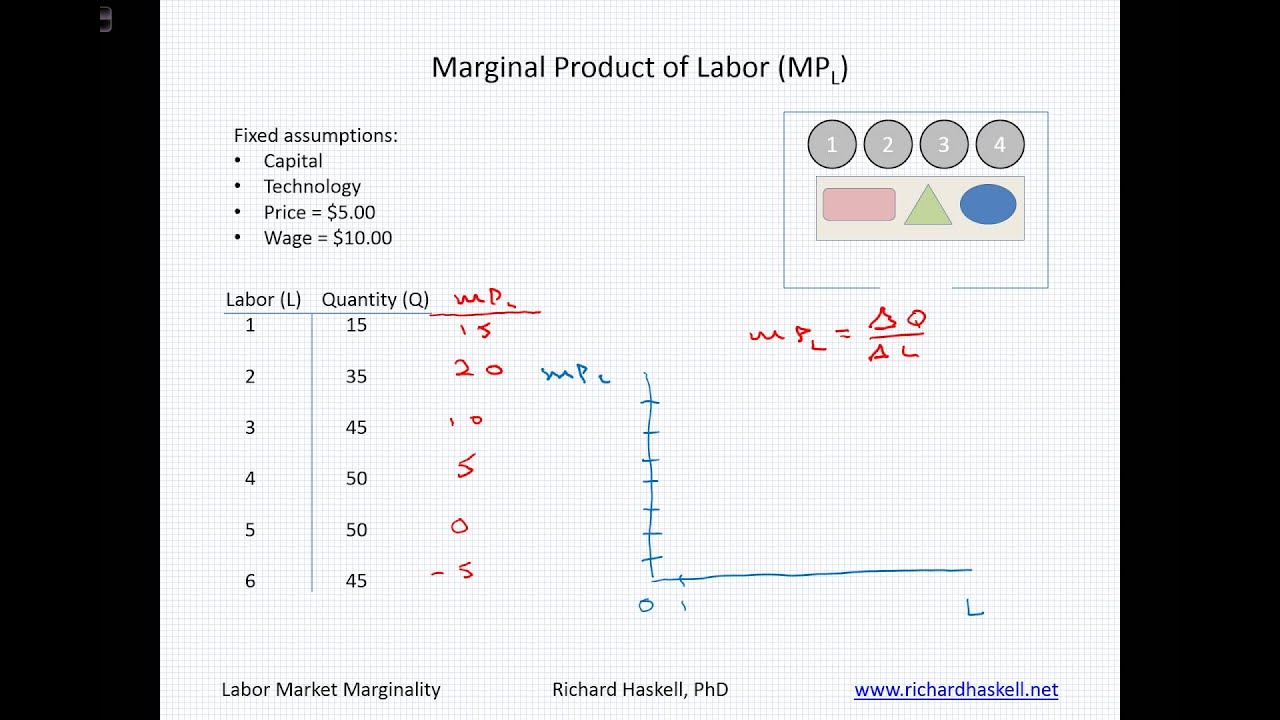
The concept of marginal product of labor (MPL) and the law of diminishing marginal returns in a firm's production function.
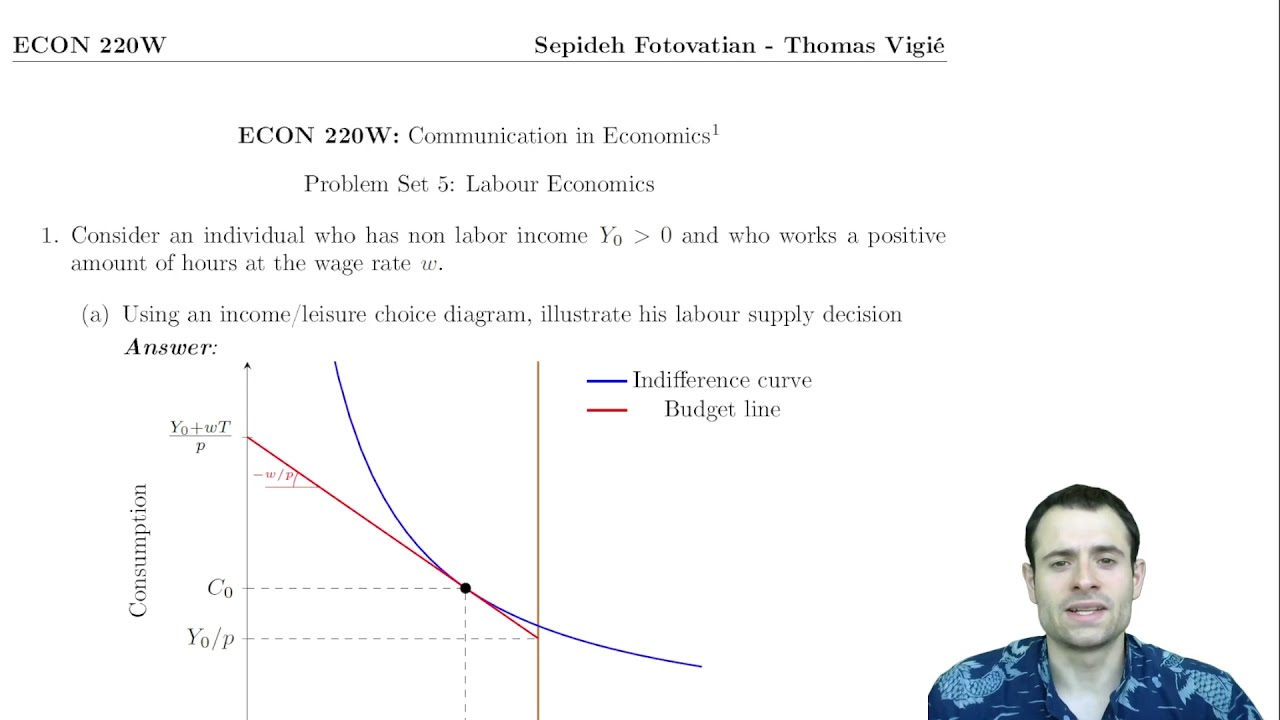
The labor-leisure tradeoff and opportunity cost, which explain how individuals make utility-maximizing decisions to supply labor.
The distinction between resource (factor) markets and product markets, noting that in labor markets, firms are the demanders and households are the suppliers.
The economic impact of labor market interventions, such as the introduction of minimum wage laws (price floors), payroll taxes, and labor subsidies.
Analysis of imperfectly competitive labor markets, specifically monopsony (where there is only one buyer of labor) and how it affects wages and employment.
Theories explaining wage differentials, including human capital theory, compensating wage differentials, and efficiency wage theory.
The role of labor unions and collective bargaining on market outcomes, and how they interact with bilateral monopolies.
95.7K views510likes10:27Original Release: 2012-10-14
in this short video we will look at the supply for labor in an economy and the demand for labor in an economy there are two po key points to remember about the supply of labor and the demand for labor first firms in the economy are the economic agents that are demanding labor and second you and I are the economic agents supplying the labor in the economy before starting on the demand for labor by firms let's take a minute to review the structure of our graph the horizontal line or the back and forth line represents the quantity of Labor as with other demand graphs the amount of Labor increases as the viewer moves from left to right the vertical access represents the real wage rate remember that the word real tells us that the wage rate has been adjusted for prices so we are measuring the wage rate that allows the workers to buy what they want as with other demand grass the real wage rate which is essentially a price increases as the viewer moves up the access now let's spend a minute and see how a firms decides how much labor to hire if the real wage rate is relatively high like W1 The Firm will demand a relatively low amount of Labor like L1 let's put a dot where the real wage rate and the quantity of Labor meet if the real wage rate is lower than W1 like W2 The Firm will demand more labor like at L2 let's put a dot where the real wage rate and the quantity of Labor meet if the real wage late is low like W3 The Firm will demand even more labor L3 let's put a dot where the real wage rate and the quantity of Labor meet if we connect the dots we have a demand curve for labor notice that as the real wage rate decreases the amount of Labor demanded by The Firm decreases there are two points about the demand for labor first the demand for labor is downward sloping second theand for labor is been given the name DL before starting on the supply of labor let's take a minute to review the structure of our graph the horizontal axis or the back and forth line represents the quantity of Labor as with other Supply graphs the amount of Labor increases as the viewer moves from left to right the vertical access represents the real wage rate remember that the word real tells us that the wage rate has been adjusted for prices so we're measuring the amount of stuff that workers can actuallyy buy as with other demand graphs the real wage rate increases as the viewer moves up the AIS now let's take a look at the individuals decision to supply labor if the real wage rate is relatively low like at W1 individuals will supply a small amount of Labor like L1 let's put a dot where the real wage rate and the quantity of labor meet if the wheel rage rate is a little higher than W1 like W2 individuals will supply more labor like L2 let's put a dot where the real wage rate and the quantity of Labor meet if the real real rage rate is relatively high like a W3 individuals will supply even more labor like L3 let's put a dot where the real rage rate and the quantity of Labor meet if we connect the dots we have a supply curve for labor notice that as the real wage increases individuals will supply more labor it's worth mentioning that this view of Labor Supply is very simplistic and for those of you who go on to a microeconomics course you will learn that supply of labor may not necessarily be behave in the way we have depicted in our little model there are are two points to remember about Supply curves first off the supply of labor is upward sloping and second the supply curve has been given the name SL when the demand for labor and the supply of labor are placed on the same graph we get an equilibrium point like an ordinary supply and demand model the equilibrium point gives us an equilibrium wage which is really an equilibrium price and an equilibrium quantity or amount of Labor which we call l0 if the wage rate is above the equilibrium point for example you W1 the demand for labor is QD and the supply of labor is Qs then there will be an excess supply of labor and a surplus of Labor will exist there are two ways the situation can be red first the real rate could drop second the demand for labor needs to shift to the right if the real wage rate is below the equilibrium real wage rate the quantity supplied is Qs and the quantity demanded is QD then the demand for labor will exceed the supply of labor or shortage of Labor will exist there are two ways the situation can be remedied first the real wage weight will have to increase to w0 or the demand the supply of labor will need to shift to the [Music] right on the graph the supply curve of Labor crosses the demand curve for labor at e0 since the supply of labor costes the demand for labor at e0 the labor market is in equilibrium at e0 if the equilibrium point is e0 then we draw a line from the equilibrium point to the real wage access we would find that the real wage the real Market wage or the real equilibrium wage is w0 if the equilibrium point e z we draw a line down from the equilibrium point to the amount of Labor axis we would find that the amount of Labor employed is q0 if the demand curve shifts to the right the equilibrium point changes to E1 if we now draw a line from the new equilibrium point E1 to the real wage axis the new equilibrium wage is W1 notice that W1 is higher up the real wage AIS than w0 since W1 is higher than w0 there has been an increase in the real wages of workers now if we draw a line from the new equilibrium point E1 to the amount of Labor access we would find that the amount of Labor employed Q is q1 notice that q1 is farther to the right on the real wage axis than q0 since q1 is farther to the right than q0 there has been an increase in the amount of Labor employed thus a shift to the right of the demand for labor will cause the real wage rate to increase and the quantity of Labor employed to increase as well on the graph the supply curve of Labor crosses the demand curve for labor at e zero since the the demand curve of Labor crosses the demand curve for labor at e0 the labor market is in equilibrium at e0 what this is really saying is that the amount of Labor demanded by the firm is equal to the amount of Labor individuals are willing to supply if the equilibrium point is e0 and we draw a line from the equilibrium point to the real wage AIS we would find that the market real Market wage or the real equilibrium wage is w0 if the equilibrium point is e0 and we draw a line down from the equilibrium point to the amount of the labor axis we would find that the amount of Labor employed is q0 if the supply curve shifts to the right a the equilibrium point changes from e0 to E1 if we now draw a line from the new equilibrium point E1 to the real wage AIS we find that the new market equilibrium wage is W1 notice that W1 is lower on the real wage access than w0 since W1 is lower than w0 there has been a decrease in the real wages of workers if we now draw a line from the new equilibrium point E1 to the amount of labor at access the new amount of Labor employed is q1 notice that q1 is farther to the right on the real wage access than q0 since q1 is farther to the right than q0 there has been an increase in the amount of Labor employed thus a shift to the right of the supply for labor will cause the real wage to decrease and the quantity of Labor employed to increase
Up Next

16:15
AS-Level Economics: Labour Market Equilibrium & Wage Elasticity
@pajholden
32.1K views•2013-11-11

5:07
Impact of Yuan in Indo-Russian Trade Amid Sanctions
@WION
261.9K views•2022-07-01

10:33
Behavioral Economics Explained: Rationality, Nudges, and Risk
@crashcourse
1.1M views•2016-03-12

113:18
The Age of Easy Money: Fed & Inflation | Full Documentary
@frontline
21.2M views•2023-03-15
Related Study Plans & Knowledge Roadmaps
Structured learning paths in Economics
economics
Sovereign Debt: Defaults, IMF & Restructuring
01Introduction to Sovereign Debt & Government Bonds
02Debt Sustainability & Credit Ratings
03Anatomy and History of Debt Crises
+ 2 more learning modules
12h5 modules
Explore Roadmap
economics
Market Design: Matching Theory & Gale-Shapley
01Introduction to Market Design and Price-Free Markets
02Two-Sided Matching & The Gale-Shapley Algorithm
03School Choice Systems and Mechanism Design
+ 2 more learning modules
10h5 modules
Explore Roadmap
economics
Impossible Trinity: Forex, Capital & Policy
01Introduction to Monetary Policy and Central Banking
02Exchange Rates and International Capital Flows
03The Mundell-Fleming Model
+ 2 more learning modules
8h5 modules
Explore Roadmap
economics
Healthcare Economics: Market Failures & Systems
01Introduction to Healthcare Markets and Market Failure
02Asymmetric Information and Adverse Selection
03Moral Hazard and Insurance Design
+ 2 more learning modules
12h5 modules
Explore Roadmap